
ABSTRACT
Analysis of DNA methylation helps to understand the effects of environmental exposures as well as the role of epigenetics in human health. Illumina, Inc. recently replaced the HumanMethylation450 BeadChip (450K) with the EPIC BeadChip, which nearly doubles the measured CpG sites to >850,000. Although the new chip uses the same underlying technology, it is important to establish if data between the two platforms are comparable within cohorts and for meta-analyses. DNA methylation was assessed by 450K and EPIC using whole blood from newborn (n = 109) and 14-year-old (n = 86) participants of the Center for the Health Assessment of Mothers and Children of Salinas. The overall per-sample correlations were very high (r >0.99), although many individual CpG sites, especially those with low variance of methylation, had lower correlations (median r = 0.24). There was also a small subset of CpGs with large mean methylation β-value differences between platforms, in both the newborn and 14-year datasets. However, estimates of cell type proportion prediction by 450K and EPIC were highly correlated at both ages. Finally, differentially methylated positions between boys and girls replicated very well by both platforms in newborns and older children. These findings are encouraging for application of combined data from EPIC and 450K platforms for birth cohorts and other population studies. These data in children corroborate recent comparisons of the two BeadChips in adults and in cancer cell lines. However, researchers should be cautious when characterizing individual CpG sites and consider independent methods for validation of significant hits.
Introduction
Epigenome-wide association studies (EWAS) elucidate associations between altered DNA methylation and health outcomes as well as environmental impacts on DNA methylation. Until 2016, the most common method for characterization of DNA methylation in humans was the Illumina HumanMethylation450 BeadChip (450K), which measured methylation at ~ 450,000 CpG sites throughout the genome; however, Illumina, Inc. has replaced the 450K chip with the Illumina HumanMethylationEPIC BeadChip (EPIC), which uses the same technology to measure methylation at >850,000 CpG sites and covers approximately 90% of the same sites represented on the 450K chip. The majority of the sites no longer included on the EPIC chip were sites previously reported to be poor performing [Citation1].
Many cohorts already have well characterized methylation data from the 450K chip and, since the 450K array has been discontinued, any new genome-wide DNA methylation data will now, by necessity, come from the EPIC chip. Consortiums such as Pregnancy and Childhood Epigenetics (PACE) currently pool 450K data for large-scale EWAS meta-analyses [Citation2]; however, many participating cohorts are now obtaining EPIC data. With the shift to the EPIC platform, a critical question is whether individual cohort studies or meta-analyses can make use of data from both platforms.
Prior studies have examined reliability and reproducibility of overlapping EPIC and 450K probes in matched samples of cancer tissue [Citation1,Citation3] and adult whole blood [Citation4]. Pidsley et al. showed that correlation between 450K and EPIC for two of the same samples of both cancerous and non-cancerous cell lines across all overlapping sites was high (r >0.9) and that reproducibility for identifying differentially methylated positions (DMPs) between cancer and non-cancerous cells (n = 3 pairs) was excellent, using FDR P <0.01. Kling et al. also reported high overall correlations between EPIC and 450K in both fresh-frozen and formalin-fixed paraffin embedded tumors [Citation3]. Similar results were reported for overall correlation in adult whole blood (n = 145); however, low correlation was observed for many individual sites (55% with r <0.2) and were found to correspond with the variance or range of methylation at a site [Citation4]. Studies comparing the two platforms in samples collected from children have not yet been reported.
This study seeks to examine reproducibility between EPIC and 450K in umbilical cord blood and in whole blood of children at age 14. We will use data from the same DNA samples analyzed on both the EPIC and 450K chips to explore correlations, difference in performance by type I and II probes, comparability of estimates for cell-type proportions, and reproducibility of a DMP analysis between boys and girls. Overall correlations indicate the correlation between a sample analyzed by both platforms across all sites [Citation4]. In contrast, individual site correlations refer to the correlation of a single site analyzed in all samples on both platforms.
Results
Study participants
This study included 109 newborns (54.1% girls) and 86 14-year-old subjects (55.8% girls) (). The mean age at blood draw for the 14-year-old subjects was 14.1 (±0.1). There were few preterm births (7.3% of the newborns, 4.7% among 14-year-old children), and only one subject with low birthweight in both datasets. All subjects were Mexican-Americans living in the Salinas Valley in California. The majority (62.8%) of 14-year subjects were overweight or obese, which is typical for the Center for the Health Assessment of Mothers and Children of Salinas (CHAMACOS) cohort [Citation5].
Table 1. Characteristics of the study population CHAMACOS.
Overall correlation between 450K and EPIC
Replicates ran multiple times on the EPIC platform had very high correlations across all EPIC probes that passed our filtering quality control (QC; cord n = 795,592, 14yr n = 795,566). For four replicates of a newborn sample ran on four separate chips, the correlation coefficient was r = 0.998 for each pair of samples. The same was seen for two sets of 14-year replicates (r = 0.998), and for a set of Jurkat cell line replicates used as internal control (r = 0.997).
The correlations for subjects analyzed on both 450K and EPIC were also high in both newborn and 14-year participants (). For the newborn samples with methylation measured at 410,741 CpG sites, correlations ranged from 0.988 to 0.994, with a median of 0.993 (). For the 14-year samples measuring methylation at 410,988 CpG sites, correlations were similar, ranging from 0.985 to 0.995 with a median of 0.994.
Table 2. Pearson Correlation coefficients for all EPIC and 450K comparisons for the population CHAMACOS.
Figure 1. β values for all overlapping probes on 450K vs. beta values on EPIC for a newborn sample.
Correlation and difference at individual CpG sites
In order to compare and combine methylation values from 450K and EPIC, it is also important to consider the correlation at each individual CpG site. These correlations were much lower than overall sample correlations (). In newborn samples, the correlations between the two Illumina platforms at each CpG site that they have in common ranged from −0.782 to 0.999, with a median of 0.235. Samples from 14-year-old showed a similar distribution of correlations (−0.877 to 0.999, median = 0.232). In both the newborn and 14-year samples, 71% of CpG sites had a correlation lower than 0.5, while only 10–11% of CpG sites had a correlation greater than 0.8.
We also examined these correlations separately for the two types of Infinium chemistry utilized on both the 450K and EPIC BeadChips. Type II probes had a better representation of high correlation probes than type I probes. shows the density of correlations for type I, type II, and type I/II combined in newborn samples with a shift toward a higher density of strong correlations in type II probes. The median correlation for type I probes was 0.128 while type II probes had a median correlation of 0.277. Similar results were seen for type I and II probes in 14-year samples (). In cord samples, correlations were stronger at CpG sites with higher variance of methylation between subjects, whereas correlations were weaker at CpG sites with low methylation variance ()). Sites in the lowest quartile of correlation (including all sites with negative correlation) had a median variance of 5e-5 with mean methylation at those sites very close to 0 or 1 ()), while sites in the highest quartile of correlation had a median variance of 0.001 with a much broader range of methylation values among the subjects ()). Similar results were seen in 14-year samples.
Figure 2. Distribution of correlation coefficients for individual CpG sites, separated by probe type. Type II probes have a greater density of CpG sites with higher correlation coefficients.
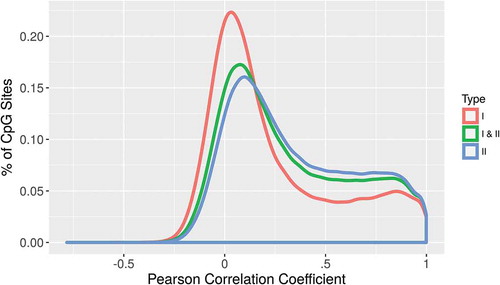
Figure 3. The correlation of β values between 450K and EPIC relative to the variance of methylation at each site (top). Sites in the lowest quartile of correlation had low variance and were mostly completely methylated or completely unmethylated (bottom left). Sites in the highest quartile of correlation had high variance of methylation (bottom right).
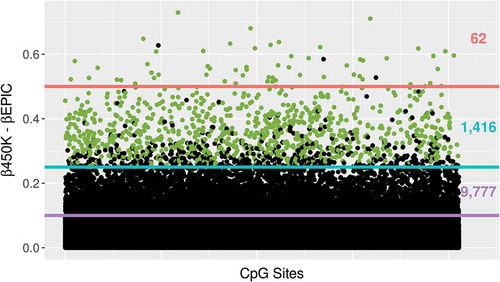
Paired t-tests showed substantial β value differences between 450K and EPIC measures for a small fraction of CpG sites. In the newborn samples, 1,416 (0.003%) sites had a mean β difference greater than 0.25 while 62 sites had a mean β difference greater than 0.5 (). Similarly, in 14-year samples, 1,062 (0.004%) sites had a mean β difference greater than 0.25, while 38 sites had a mean β difference greater than 0.5. There was considerable overlap between CpG sites with large β differences in the cord and 14-year datasets, meaning there were consistent differences in β between the two Illumina platforms in both datasets for many of the CpG sites. Of the 38 CpG sites with a β difference greater than 0.5 at 14 years, 31 were included in the 62 CpG sites significant in cords. Of the 1,062 sites with β difference greater than 0.25 at 14 years, 942 were included in the 1,416 CpG sites significant in cords. All sites with an average β difference greater than 0.25 had an FDR adjusted P value lower than 0.05. This subset of CpGs had a similar distribution of probe type and distance from genes as the overall BeadChip. Further investigation of these sites did not identify specific biological pathways either. The CpG sites with the largest mean β differences (>0.5) in both cord and 14-year datasets were not low variance sites.
Figure 4. The absolute difference in β value at each CpG site between 450K and EPIC for newborns is plotted on the y-axis. Sites which also showed large differences >0.25 in the 14-year data set are highlighted in green and counts of sites exceeding thresholds of 0.1, 0.25, and 0.5 are shown on the right side of the plot.
Cell type predictions estimated by two platforms
Many methylation studies adjust for cell type heterogeneity using the estimateCellCounts function in the R package minfi [Citation6]. Cell type predictions for seven cell types in newborns, estimated using a cord blood reference data set, were highly correlated for samples run on 450K and EPIC (r = 0.96 to 0.99). For 14-year samples the six cell types estimated using an adult reference dataset also showed high correlations; however they were slightly lower than newborn cell composition estimates (r = 0.88 to 0.98) (). Individual site correlations between the two platforms for the subset of 600 to 700 CpG sites used for cell type prediction in children were higher than average for the other sites on the BeadChips with a median r = 0.73 and small mean differences between the platforms. These sites also had higher variance of methylation.
Replication of DNA methylation sex differences
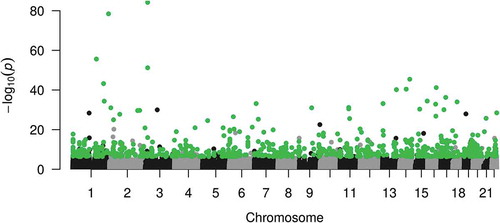
We previously reported on site-specific differential DNA methylation between boys and girls in the CHAMACOS cohort [Citation7]. Here, we used a similar analysis in order to assess the reproducibility between EPIC and 450K in EWAS studies by running the same regression analyses to identify autosomal DMPs between boys and girls using both 450K and EPIC methylation values as the outcome, adjusting for cell type heterogeneity. There was high correlation of the regression coefficients from each model in both newborn (r = 0.975) and 14-year analyses (r = 0.976) (). Of the 16,368 significant CpG sites differentially methylated by sex in 450K, 80% (n = 13,134) were also found significant in EPIC analyses. Of the top 1,000 450K hits, 999 (99%) were significant EPIC hits in regard to sex differences in DNA methylation ().
Figure 5. Regression β values for all overlapping probes on 450K vs. regression beta values on EPIC analyses of differentially methylation positions by sex in newborns.
Figure 6. Manhattan plot showing differentially methylation positions by sex in newborns on 450K in autosomes. Sites highlighted in green are the 999 of the top 1,000 autosomal 450K hits, which were significant (FDR q <0.05) in EPIC analyses.
Discussion
Comparisons of DNA methylation at birth and adolescence by both 450K and EPIC BeadChips show that the overall methylation patterns between 450K and EPIC are highly correlated; however, individual sites have a broad range including some low and even negative correlations. We found type II probes to have higher individual site correlations than type I probes between the platforms and also report a relatively small subset of CpG sites with consistently large β value differences. We also saw high correlation of cell type proportion estimates and strong replication of DMPs between boys and girls in both datasets. Since all samples from both datasets in our CHAMACOS study were isolated from whole blood, the results of this comparison are primarily informative to other studies analyzing DNA methylation in blood. This is one of the most frequently used sample type for epigenetic population studies of children and adults [Citation8].
Results for overall correlations in children corroborate studies in adult blood [Citation4] and cancer tissue [Citation1], which show overall correlation coefficients greater than 0.9. Also, similar to the study in adult blood, individual site correlations were much lower in the newborns and children in our study. We also observed that CpG sites with lower variance of methylation values had weaker correlations. Sites with small variance showed that nearly all subjects were completely unmethylated (β = 0) or completely methylated (β = 1). Sites with low variance and extreme methylation values are likely more sensitive to small differences between the two platforms. Weak correlation could mean that methylation measurements are unreliable and could have difficulty replicating at those sites. Our results of a practical application in a cohort study exploring DMPs related to sex shows the majority of hits replicate very well by the two platforms in the newborn and 14-year-old datasets.
The majority of new probes on the EPIC chip are type II – EPIC consists of 84% type II probes, while 450K contains 72% type II probes. Even after quantile normalization, which aims to adjust for differences in Infinium chemistry at type I vs. type II probes, we see that type II probes have a higher distribution of strong correlations between the two platforms. Interestingly, a study in adult blood reported very similar results for the two probe types [Citation4]. These differences underscore the importance of including a normalization technique for probe type in the methylation data processing pipeline.
We observed a subset of sites with large β value differences by 450K and EPIC that overlap in the newborn and 14-year datasets. We analyzed these sites for specific characteristics that may differ from better performing sites. We first looked for enrichment of location in CpG islands, shores, and shelfs, and saw similar distributions to the overall chip. Proportions of type I and type II probes also did not differ from the rest of the probes. Additionally, a pathway analysis revealed that no specific genes or biological processes were enriched in the problematic probes. Overall, these probes with large β value differences between the 450K and EPIC chip were spread throughout the epigenome without any identifying characteristics. These CpG sites showed significantly lower correlations than the median of all sites, showing that this finding is not explained by a shift in mean β values between the platforms. The same CpG sites with large differences in β values were not observed between replicate samples analyzed on either 450K or EPIC, suggesting this difference is likely due to the variation between the two platforms. Unlike many of the CpG sites with lower correlations between 450K and EPIC, these sites did not show significantly lower variance in methylation values, suggesting that these probes may be poor performing. This subset of CpG sites could be unreliable for comparison when combining EPIC and 450K datasets. Researchers may consider filtering these sites and/or validation by an alternative methodology, particularly when conducting an analysis that includes data from both platforms (Table S1).
We were also able to assess the performance of minfi’s implementation of a cord blood reference data set as well as an adult reference dataset and found that estimates for cell type proportions in each subject were very similar whether using 450K or EPIC data. Currently, the cell-sorted reference methylation datasets for both cord and adult blood are limited to 450K data; therefore, only overlapping probes were used for cell proportion estimates in our analysis. The high correlation estimates for both platforms mean that the subset of CpG sites used for these blood cell composition estimations perform comparably on the two BeadChips. Additionally, we noted that the median correlations for the subset of probes used to estimate cell type proportions are higher than the median correlations for overall probes. This stability is encouraging for studies that use this popular reference method to adjust for cell type heterogeneity in their epigenetic analyses.
A prior study in the CHAMACOS cohort reported over 3,000 CpG sites in autosomes to be differentially methylated between newborn boys and girls [Citation7]. To assess reproducibility of DMP analyses between the two platforms, we performed a similar analysis using the newborns and 14- year subjects with data on both the 450K and EPIC chips. Results from running the same analysis using either 450K or EPIC data with their respective estimated cell-count adjustments produced very similar results of differential DNA methylation by sex at both ages. The majority of significant hits replicate by the two platforms, and the effect sizes for differential methylation are highly correlated across all sites. We saw that the median correlation for sites that replicated (r = 0.89) was higher than sites that did not replicate (r = 0.53). This shows that sites with lower correlation may be less reliable by at least one of the platforms. Similar replication between 450K and EPIC for DMP analyses was reported in cancer cell lines [Citation1] and in adult age differences [Citation4]. Ongoing analyses with the PACE consortium will further investigate sex-related DNA methylation differences as well as the combination of data from the 450K and EPIC BeadChips in meta-analyses of multiple participating cohorts.
We suggest that future studies incorporating data from one or both BeadChips conduct sensitivity analyses filtering sites with large differences, lower correlation, or lower variance, and/or validate hits with an alternative method, such as targeted pyrosequencing [Citation8]. Since CpG sites with low variability or at the extreme ends of methylation distribution could still be biologically informative to certain studies, sensitivity analyses may be more appropriate rather than strict filtering based on variability or correlation between platforms. In general, we anticipate the EPIC chip to be more reliable than the 450K chip. The new EPIC chip contains 90% of the probes on 450K, and many of the 10% no longer included on the EPIC chip were previously identified as underperforming. Additionally, in our analyses we saw slightly better performance of type II probes, and the majority of new probes added to the EPIC chip make use of the type II Infinium chemistry. Although we found that individual site correlations are relatively low, these new data add to previous studies that have shown that the EPIC and 450K chips behave similarly in the practical use of DMP analyses. Now, we also show that the performance between EPIC and 450K is consistent between whole blood of both newborns and children.
Methods
Study participants
Subjects were participants in the CHAMACOS longitudinal birth cohort study examining the impact of pesticide and other environmental exposures on the health and development of Mexican-American children living in the Salinas Valley, an agricultural region in California. A detailed description of the CHAMACOS cohort has previously been published [Citation9]. A total of 601 women were enrolled during pregnancy and 526 were followed to delivery of a liveborn singleton infant. For this study, we included subjects that had methylation data on both the 450K and EPIC platforms measured in cord and blood from the children at 14 years. This included 109 newborns (cord blood) and 86 14-year-old subjects (M± SD = 14.1 ± 0.1 years old) with sufficient DNA for these analyses.
Blood collection and processing
Cord blood specimens were collected by hospital staff at time of delivery and 14 year blood was collected by venipuncture by a phlebotomist at the CHAMACOS field office. After separation into clots, serum, and buffy coats, they were stored at −80°C until analysis. DNA was isolated from the banked non-heparinized umbilical cord and 14-year blood clot samples using QIAamp DNA Blood Maxi Kits (Qiagen, Valencia, CA) according to the manufacturer’s protocol with minor modifications, as previously described [Citation10].
EPIC and 450K BeadChip methylation analysis
DNA aliquots of 1 µg were bisulfite converted using Zymo Bisulfite Conversion Kits (Zymo Research, Orange, CA). DNA was whole-genome amplified, enzymatically fragmented, purified, and applied to the Illumina Infinium HumanMethylation450 BeadChips (Illumina, San Diego, CA) according to the Illumina methylation protocol [Citation11,Citation12]. Both EPIC and 450K chips were analyzed using the Illumina Hi-Scan system. DNA methylation was measured at 485,512 CpG sites on the 450K BeadChip and 866,836 CpG sites on the EPIC BeadChip. QC measures were previously described [Citation13] and included use of repeats and randomization of samples across chips and plates. The same QC was applied for EPIC analyses.
DNA methylation data processing
DNA methylation data was processed using the R package minfi [Citation6]. Raw intensity data (IDAT) files for both 450K and EPIC data were loaded and combined into an array including only overlapping CpG sites and subjects with DNA analyzed on both platforms. Cord and 14-year samples were processed separately. Prior to probe filtering, there were 452,567 overlapping probes. We then checked for samples where <95% of probes had a detection P value <0.01. All samples passed this quality control. We then subtracted background signal and corrected for dye bias using ‘noob’ normalization (preprocessNoob) and normalized for differences between type I and type II probes using quantile normalization (preprocessQuantile). Before conducting any correlation analyses, we confirmed samples were from the same subject on each platform by comparing β values at the 59 overlapping SNPs included on the 450K and EPIC chip.
Sites with annotated probe SNPs (n = 59), and with common SNPs identified in the MXL (Mexican ancestry in Los Angeles, California) HapMap population (n = 13,754) [Citation14] were excluded. Cross-reactive probes have been previously identified [Citation15] and were removed according to Chen et al. (n = 27,167) [Citation16]. Probes where 95% of samples had detection P values >0.01 were also dropped (cord n = 834; 14yr n = 561). Finally, we removed probes which Illumina identified as underperforming leaving 410,741 CpGs for analysis in cord samples and 410,988 CpGs for analysis in 14-year samples.
Cell type proportions were also estimated using minfi [Citation6] (estimateCellCounts). For cord samples, this function predicts proportions of seven cell types in relation to a cord reference data set that includes nucleated red blood cell counts [Citation17], while for 14 year samples, this function uses the Reinius adult reference data set to estimate proportions of six cell types [Citation18].
Statistical analyses
In order to assess overall reproducibility, we calculated the Pearson correlation coefficient for each subject across all probes to obtain an overall correlation per subject on both platforms. In addition to looking at correlation across all sites, we assessed correlation separately by type I and type II probes. We also calculated correlation coefficients as well as variance of β-methylation per probe, meaning a single probe across all subjects, to assess comparability of an individual methylation value. Finally, we calculated correlations between the estimated cell type proportions from each platform. In order to determine the average difference in β value produced by 450K and EPIC, we subtracted the mean β for all subjects at each probe on EPIC from the mean β for all subjects at each probe on 450K and conducted paired t-tests to check for statistical significance. We also conducted a pathway analysis to determine if the sites with large differences between the two platforms are enriched for any biological pathways [Citation19].
Assessment of the reproducibility of interrogating differentially methylated positions (DMPs) was performed by fitting a limma [Citation20] linear model with empirical Bayes variance shrinkage using either 450K or EPIC methylation as the outcome and sex as the predictor. Analyses also adjusted for cell type proportions. All statistical analyses were conducted using R version 3.4.1 [Citation21].
Supplemental Material
Download MS Excel (12.5 KB)Acknowledgments
We are grateful to CHAMACOS participants, researchers, and field staff. Contributions of the personnel and students in Holland, Barcellos, Eskenazi, Kobor, and Meaney laboratories are acknowledged. Generous support from the JPB Foundation of New York is appreciated. The content is solely the responsibility of the authors and does not necessarily represent the official views of the EPA, NIEHS, or the National Institutes of Health.
Disclosure statement
No potential conflict of interest was reported by the authors.
Supplemental data
Supplemental data for this article can be accessed here.
Additional information
Funding
References
- Pidsley R, Zotenko E, Peters TJ, et al. Critical evaluation of the illumina MethylationEPIC BeadChip microarray for whole-genome DNA methylation profiling. Genome Biol. 2016;17:208.
- Felix JF, Joubert BR, Baccarelli AA, et al. Cohort profile: pregnancy and childhood epigenetics (PACE) consortium. Int J Epidemiol. 2018;47:22–23.
- Kling T, Wenger A, Beck S, et al. Validation of the MethylationEPIC BeadChip for fresh-frozen and formalin-fixed paraffin-embedded tumours. Clin Epigenetics. 2017;9:33.
- Logue MW, Smith AK, Wolf EJ, et al. The correlation of methylation levels measured using illumina 450K and EPIC BeadChips in blood samples. Epigenomics. 2017;9:1363–1371.
- Harley KG, Berger K, Rauch S, et al. Association of prenatal urinary phthalate metabolite concentrations and childhood BMI and obesity. Pediatr Res. 2017;82:405.
- Aryee MJ, Jaffe AE, Corrada-Bravo H, et al. Minfi: A flexible and comprehensive bioconductor package for the analysis of infinium DNA methylation microarrays. Bioinformatics. 2014;30:1363–1369.
- Yousefi P, Huen K, Davé V, et al. Sex differences in DNA methylation assessed by 450 K BeadChip in newborns. BMC Genomics. 2015;16:911.
- Breton CV, Marsit CJ, Faustman E, et al. Small-magnitude effect sizes in epigenetic end points are important in children’s environmental health studies: the children’s environmental health and disease prevention research center’s epigenetics working group. Environ Health Perspect. 2017;125:511–526.
- Eskenazi B, Bradman A, Gladstone EA, et al. CHAMACOS, A longitudinal birth cohort study: lessons from the fields. J Child Health Care. 2003;1:3–27.
- Holland N, Furlong C, Bastaki M, et al. Paraoxonase polymorphisms, haplotypes, and enzyme activity in latino mothers and newborns. Environ Health Perspect. 2006;114:985–991.
- Bibikova M, Barnes B, Tsan C, et al. High density DNA methylation array with single CpG site resolution. Genomics. 2011;98:288–295.
- Sandoval J, Heyn H, Moran S, et al. Validation of a DNA methylation microarray for 450,000 CpG sites in the human genome. Epigenetics. 2011;6:692–702.
- Yousefi P, Huen K, Aguilar Schall R, et al. Considerations for normalization of DNA methylation data by illumina 450K BeadChip assay in population studies. Epigenetics. 2013;8:1141–1152.
- Zhou W, Laird PW, Shen H. Comprehensive characterization, annotation and innovative use of infinium DNA methylation BeadChip probes. Nucleic Acids Res. 2016;45:gkw967.
- Price ME, Cotton AM, Lam LL, et al. Additional annotation enhances potential for biologically-relevant analysis of the illumina infinium HumanMethylation450 BeadChip array. Epigenetics Chromatin. 2013;6:4.
- Chen Y, Lemire M, Choufani S, et al. Discovery of cross-reactive probes and polymorphic CpGs in the illumina infinium HumanMethylation450 microarray. Epigenetics. 2013;8:203–209.
- Bakulski KM, Feinberg JI, Andrews SV, et al. DNA methylation of cord blood cell types: applications for mixed cell birth studies. Epigenetics. 2016;11:354–362.
- Houseman EA, Accomando WP, Koestler DC, et al. DNA methylation arrays as surrogate measures of cell mixture distribution. BMC Bioinformatics. 2012;13:86.
- Mi H, Huang X, Muruganujan A, et al. PANTHER version 11: expanded annotation data from gene ontology and reactome pathways, and data analysis tool enhancements. Nucleic Acids Res. 2017;45:D189.
- Smyth GK. Linear models and empirical bayes methods for assessing differential expression in microarray experiments. Stat Appl Genet Mol Biol. 2004;3:Article3.
- R Core Team. R: A language and environment for statistical computing. 2017. p. 3.4.1.