
ABSTRACT
Gestational age (GA) is an important determinant of child health and disease risk. Two epigenetic GA clocks have been developed using DNA methylation (DNAm) patterns in cord blood. We investigate the accuracy of GA clocks and determinants of epigenetic GA acceleration (GAA), a biomarker of biological ageing. We hypothesize that prenatal and birth characteristics are associated with altered GAA, thereby disrupting foetal biological ageing. We examined 372 mother-child pairs from the Center for the Health Assessment of Mothers and Children of Salinas study of primarily Latino farmworkers in California. Chronological GA was robustly correlated with epigenetic GA (DNAm GA) estimated by the Knight (r = 0.48, p < 2.2x10⁻¹⁶) and Bohlin clocks (r = 0.67, p < 2.2x10⁻¹⁶) using the Illumina 450K array in cord blood samples collected at birth. GA clock performance was robust, though slightly lower, using DNAm profiles from the Illumina EPIC array in a smaller subsample (Knight: r = 0.39, p < 3.5x10⁻⁵; Bohlin: r = 0.60, p < 7.7x10⁻¹²). After adjusting for confounders, high maternal serum triglyceride levels (Bohlin: β = −0.01 days per mg/dL, p = 0.03), high maternal serum lipid levels (Bohlin: β = −4.31x10⁻³ days per mg/dL, p = 0.04), preterm delivery (Bohlin: β = −4.03 days, p = 9.64x10⁻⁴), greater maternal parity (Knight: β = −4.07 days, p = 0.01; Bohlin: β = −2.43 days, p = 0.01), and male infant sex (Knight: β = −3.15 days, p = 3.10x10⁻³) were associated with decreased GAA.Prenatal and birth characteristics affect GAA in newborns. Understanding factors that accelerate or delay biological ageing at birth may identify early-life targets for disease prevention and improve ageing across the life-course. Future research should test the impact of altered GAA on the long-term burden of age-related diseases.
Background
Ageing is a complex process that has been associated with physiological changes at molecular, cellular, and tissue levels [Citation1]. While the causes of ageing are not fully understood, it is established that both genetic and environmental factors have an impact on this process [Citation1]. Over the past decade, a number of studies have shown that epigenetic modifications can serve as biomarkers of ageing [Citation2,Citation3]. Differences and changes in methylation of cytosine nucleotides, one of the most widely studied epigenetic marks, have been strongly correlated with longevity and age-related diseases, such as cancer and cardiovascular disease [Citation4,Citation5].
Because the epigenome is influenced by the environment over time, epigenetic marks have the potential to predict ‘biological aging’ of an individual’s cells, tissues, and organ systems as opposed to their chronological age, which is based on birthdate [Citation6]. In recent years, epigenetic clocks have been established as highly accurate DNA methylation-based biomarkers of biological ageing, outperforming traditional markers such as telomere length [Citation7]. Several epigenetic clocks have been developed, each trained using methylation levels of different sets of individual cytosines, or CpG sites in the genome, to predict the biological age of a specific DNA source [Citation2]. The divergence between epigenetic age (DNAm age) and chronological age, known as epigenetic age acceleration (EAA), serves as an indicator of biological ageing associated with all-cause mortality and morbidities like cancer and obesity [Citation2].
Infants might be particularly sensitive to biological ageing at birth. For example, differences in gestational age, as small as 1 week, can significantly impact neonatal morbidity and mortality, as well as long-term outcomes related to cognitive ability and respiratory health [Citation8–10]. Yet, studies of epigenetic age acceleration in infants are limited. Adult studies have shown accelerated epigenetic ageing to be associated with poor health outcomes [Citation2]. However, due to the importance of proper foetal development and maturity, decelerated epigenetic ageing at birth may be as detrimental to later disease burden as age acceleration at birth.
Two epigenetic clocks developed by Knight et al. [Citation11] and Bohlin et al. [Citation12] were constructed to predict gestational age at delivery using DNA methylation profiles of CpG sites measured from foetal umbilical cord blood and newborn blood spots. Using methylation levels from 148 CpG sites analysed on the Illumina Infinium HumanMethylation27 and HumanMethylation450 (450K) arrays, Knight’s clock reported a high predictive accuracy between DNAm GA and chronological GA (r = 0.91) [Citation11]. Using a more reduced model with 96 CpG sites analysed on the 450K array, Bohlin’s clock also resulted in estimates that were positively correlated with chronological GA (r2 = 0.66) [Citation12]. Bohlin and Knight’s clocks only have two CpG sites in common (cg07816074, cg16536918), suggesting that they may offer a complementary means of estimating epigenetic gestational age.
Both Knight and Bohlin’s clocks were initially trained and developed with DNA methylation data from the Illumina 450K array. Until 2016, the Illumina 450K array was the most widely used method to characterize DNA methylation levels, measuring around 450,000 CpG sites in humans. The newer Illumina Infinium HumanMethylationEPIC 850K array (EPIC) improves coverage of regulatory elements by measuring methylation levels of over 850,000 CpG sites, including over 90% of the sites analysed with the 450K and an additional 413,743 CpGs [Citation13]. A cord blood-based gestational age clock using the EPIC DNA methylation array was recently developed [Citation14]. In this study, we will focus on the Knight and Bohlin clocks due to their widespread use and because of the greater availability of 450K array DNAm profiles in our cohort.
While adult epigenetic clocks have been validated with the EPIC array [Citation15,Citation16], the impact of the newer EPIC array on the estimation of Bohlin and Knight’s DNAm GA has been evaluated by few other studies thus far [Citation17,Citation18]. Some studies have explored the associations between pregnancy and birth outcomes with GAA [Citation19–23], but findings have been inconsistent. For example, one study reported female infant sex to be associated with increased GAA [Citation20], while another found an association between male infant sex and increased GAA [Citation21]. Furthermore, these studies have solely used DNA methylation profiles from the 450K array and applied them to predominantly white, European cohorts [Citation19–23]. There is a clear need for epigenetic studies that include diverse populations and validate the EPIC DNA methylation array with existing cord blood-based gestational age clocks.
We aimed to evaluate the performance of the Knight and Bohlin gestational age clocks using the Illumina 450K and EPIC arrays by the correlation between chronological GA and DNAm GA in infants. We also aimed to determine the associations of prenatal maternal factors and birth outcomes with altered GAA using data from Latino mothers and children participating in the CHAMACOS birth cohort. We hypothesize that prenatal maternal and newborn birth characteristics influence epigenetic gestational age acceleration, thereby disrupting foetal programming and ageing.
Methods
Study population
Between October 1999 and October 2000, the Center for the Health Assessment of Mothers and Children of Salinas (CHAMACOS) study recruited 601 pregnant women from farmworker communities of Salinas Valley in California. At enrollment, women were ≤20 weeks gestation, English- or Spanish-speaking, Medicare eligible, planning to deliver at the county hospital, and attending prenatal care visits at one of the six local community clinics or hospitals. Of 601 initial enrollees of the cohort, 526 were followed to delivery of live, singleton newborns in 2000–2001 [Citation24,Citation25]. For this study, we included mother-child pairs with available DNA methylation data who provided samples and consent for genomic analysis. Mothers were interviewed near the end of the 1st and 2nd trimesters of pregnancy and shortly after delivery and provided biological samples at these time points. Study activities were conducted by well-trained, bilingual, and bicultural study staff [Citation24,Citation25].
A subset of children in the CHAMACOS cohort had DNAm measured from cord blood specimens using the 450K array (N = 381). Of these 381 participants, a subset also had cord blood specimens analysed by the EPIC array (N = 109). Nine participants of N = 381 were excluded due to missing reported sex or mismatch between reported sex and predicted sex derived from X chromosome intensities. These samples were deemed of low quality based on array intensity. One participant of N = 109 was excluded due to mismatch between reported and predicted sex results. Based on this exclusion criterion, the final sample sizes were 372 children for the epigenetic data derived from the 450K array and 108 children for the epigenetic data generated from the EPIC array. N = 359 (96.5%) mothers of the 372 children with 450K array data identified as Latina. Specifically, N = 355 (95.4%) identified as being Mexican, Mexican-American, or Mexican-Indian. All N = 108 (100%) mothers of the 108 children with EPIC array data identified as Latina, with N = 107 (99.1%) being Mexican, Mexican-American, or Mexican-Indian.
Umbilical cord blood DNA methylation
Cord blood specimens were collected at the time of delivery, and DNA was extracted from the banked non-heparinized umbilical cord using QIAamp DNA Blood Maxi Kits (Qiagen, Valencia, CA) according to the manufacturer’s protocol with some modifications, as previously described [Citation26]. DNA aliquots of 1 µg were bisulphite converted using Zymo Bisulphite Conversion Kits (Zymo Research, Orange, CA). After whole-genome amplification, enzymatic fragmentation, and purification, DNA was applied to the Illumina Infinium HumanMethylation450 and HumanMethylationEPIC BeadChips (Illumina, San Diego, CA) according to the Illumina methylation protocol [Citation27,Citation28]. Genome-wide DNAm levels were measured at 485,512 CpG sites on the 450K array. The EPIC array measured DNA methylation at 866,836 CpG sites, including 90% of the sites used by the 450K array [Citation29]. These arrays calculate the relative methylation (β) for each CpG site as the ratio of methylated-probe signal to total (methylated + unmethylated) fluorescent signal intensity, ranging from 0 (no methylation) to 1 (complete methylation).
Quality control steps included the use of repeats and randomization of samples across chips and plates [Citation30]. Data processing was completed using the minfi R package [Citation31] and involved removal of poor-quality samples, filtering of probes containing common SNPs, cross-reactive probes, or low-quality probes (detection p-values >0.01), background correction, dye bias adjustment using the ‘noob’ method, and quantile normalization, as described elsewhere [Citation29,Citation31]. Proportions of seven cell types (CD8+ T cells, CD4+ T cells, natural killer cells, B cells, monocytes, granulocytes, and nucleated red blood cells) were estimated from cord blood methylation profiles, using the method of Bakulski et al. [Citation32].
DNAm GA prediction and gestational age acceleration
DNAm GA was calculated using the method and model published by Knight et al., which uses 148 CpG sites to predict GA from cord blood methylation profiles [Citation11]. DNAm GA was additionally calculated using the Bohlin et al. model, which is based on the methylation profiles of 96 CpG sites using the GAprediction Bioconductor package [Citation12,Citation33]. The 450K and EPIC array data in our samples measured methylation at 148 (100%) and 141 (95.3%) of the 148 CpG sites used in the Knight model and 93 (96.9%) and 88 (91.7%) of the 96 CpGs used in the Bohlin et al. model, respectively, after quality control. The missing values for three CpG sites in the 450K array (N = 372 samples per CpG) and 15 CpG sites in the EPIC array (N = 108 samples per CpG) were imputed with the k-nearest-neighbours algorithm as implemented by the impute.knn function in the impute R package [Citation34]. This imputation approach is commonly used with DNA microarray data and has been shown to be more robust and sensitive than other methods like singular value decomposition and row averages [Citation35]. The first multi-tissue epigenetic clock developed by Horvath uses the k-nearest-neighbours algorithm for imputation [Citation36]. No samples were missing values for the other CpG sites. GAA was calculated as the residuals from a linear model of DNAm GA regressed on chronological GA as a proxy for biological ageing.
Maternal characteristics
Data on maternal characteristics primarily came from medical records and maternal interviews conducted during pregnancy at around 13 and 26 weeks gestation and shortly after delivery. Clinical variables of interest were maternal age at delivery, pre-pregnancy body mass index (BMI), pregnancy weight gain, and serum cholesterol, triglyceride, and lipid levels.
Pre-pregnancy weight was obtained from prenatal medical records. If pre-pregnancy weight was missing from medical records, weight at the first prenatal visit (≤13 weeks gestation) was used. If women received prenatal care after 13 weeks gestation, regression models were used to impute pre-pregnancy weight based on weight at all prenatal visits. Pregnancy weight gain was computed as the difference between maternal weight at delivery and pre-pregnancy weight. Maternal weight at delivery was abstracted from medical records. If weight at delivery was missing, weight at last prenatal care visit was used if it occurred within 3 weeks of delivery.
Maternal lipid profiles, including total lipids, triglycerides, and cholesterol (mg/dL), were measured in blood collected at 26 weeks gestation. If a serum sample was not collected at 26 weeks, samples from the time of delivery were used. The serum concentration of total lipids was calculated with concentrations for triglycerides and cholesterol, using a mathematical formula described by Phillips et al. [Citation37].
Other covariates obtained from prenatal study interviews included maternal smoking during pregnancy (no, yes), alcohol consumption during pregnancy (no, yes), baseline marital status (married/living as married, separated, divorced, single), baseline maternal education status (≤6th grade, 7–12th grade, ≥high school graduate), maternal parity (0, 1, 2+), and maternal occupation during pregnancy (did not work, field work, other agricultural work, other work only). Field work included activities such as harvesting crops and thinning or weeding fields. Agricultural work was defined as tasks other than those which involved direct field work, such as working in a packing shed, nursery/greenhouse, or as a truck driver in the fields. Maternal adversity was characterized in terms of the number of maternal adverse childhood experiences (ACEs) reported by the mother at the 18-year follow-up visit (0, 1–2, 3+). Type of delivery (vaginal, caesarean section), and preterm delivery (<37 weeks, ≥37 weeks) were abstracted by a registered nurse from infant and maternal medical records or delivery logs.
Infant characteristics
Chronological GA in days was obtained by asking mothers the date of their last menstrual period (LMP). If LMP was unknown (N = 56), chronological GA largely based on ultrasound methods was abstracted from medical records by a registered nurse [Citation38]. The data from the medical records was systematically biased down since it was available to the nearest completed week. To account for this, chronological GA from medical records was adjusted by adding a half week before converting to days. Other factors of interest included infant sex and birth weight, which were also abstracted by a registered nurse from infant and maternal medical records or delivery logs.
Statistical analysis
We described our study sample using means and proportions for the characteristics of interest among the entire sample with available 450K array data and the subsample with EPIC array data. We tested the accuracy of epigenetic ageing biomarkers derived from two DNA methylation technologies (450K and EPIC arrays) via their empirical correlation with chronological GA using Pearson correlation coefficients. The median absolute error (MAE) for each gestational age clock was calculated as the median of the absolute difference between estimated DNAm GA and chronological GA as previously done for the adult epigenetic clocks [Citation39]. We used scatter plots with fitted regression lines and 95% confidence intervals (95% CIs) to depict the accuracy of the clocks across DNA methylation arrays. We also tested the inter-clock agreement by determining the correlation between Knight and Bohlin clock estimates derived from the same DNA methylation array. Similar analysis was also performed to determine inter-array agreement of estimates from the same epigenetic clock, but different DNA methylation arrays.
Due to a larger sample size, associations between maternal and infant characteristics with GAA were determined for the 372 mother-child pairs with DNA methylation profiles analysed with the 450K array. We evaluated the impact of adjusting for potential confounders selected a priori, including maternal age at delivery, smoking during pregnancy, maternal education, maternal marital status, and infant sex. Maternal education, marital status, and income as a proxy for prenatal socioeconomic status [Citation40] and prenatal smoking [Citation41] have been associated with differential DNA methylation patterns in cord blood samples. Maternal age at delivery [Citation42] and infant sex [Citation20,Citation21] have also been shown to be related to altered rates of gestational ageing in cord blood samples.
Ageing is associated with changes in immune-related components such as white blood cell composition. CD8+ T cells and plasma B cells have been shown to be correlated with extrinsic epigenetic age acceleration (EEAA), a type of epigenetic age acceleration that incorporates immune system ageing [Citation43]. A second multivariate linear regression model for each maternal child characteristic was further adjusted for estimated cell-type proportions (CD8+ T cells, CD4+ T cells, natural killer cells, B cells, monocytes, granulocytes, and nucleated red blood cells). Adjusting for maternal and infant covariates as well as cell-type proportions allowed us to evaluate associations with GAA independent of changes in immune cell composition. In this model, GAA is not confounded by changes in blood cell counts, and thus measures ‘pure’ epigenetic ageing effects, or intrinsic epigenetic age acceleration (IEAA) [Citation43]. To examine associations between estimated cell-type proportions, the clocks, and their respective measures of GAA, we also tested their empirical correlations across estimated nucleated cells from the cord blood samples.
We report effect sizes as regression coefficients and 95% CIs and consider statistical significance at p < 0.05. We also used the Benjamini–Hochberg method to correct for multiple hypotheses for GAA derived from each epigenetic clock. To improve the comparability of effect sizes, we converted the units of maternal serum biomarkers from mg/dL to g/L in Forest plots. All statistical analyses were performed using RStudio Version 4.1.2 (RStudio, Boston, MA, USA).
Results
Study sample characteristics
describes the clinical and socioeconomic characteristics of the 372 mother-child pairs whose DNA methylation profiles were obtained by analysing foetal cord blood samples with the Illumina 450K array. Of the 372 participants, 189 (50.81%) were female and 183 (49.19%) were male. The mean chronological GA at birth for this sample was 39.46 (standard deviation [SD] 1.54) weeks and 6.99% were born preterm. The mean age of mothers at delivery was 25.73 (SD 5.00) years. Mean pre-pregnancy BMI among mothers was 26.78 (SD 5.10) kg/m2 with over 50% of mothers being overweight or obese. About 6.45% of women reported smoking tobacco during pregnancy and 22.04% reported consuming any alcohol during pregnancy. Table S1 describes the characteristics of a subset of 108 mother-child pairs who had their foetal cord blood DNA samples also analysed with the EPIC array. This subsample of 108 mother-child pairs had similar clinical and socioeconomic characteristics.
Table 1. Characteristics of participants in the CHAMACOS birth cohort with Illumina 450K DNA methylation profiles from umbilical cord blood samples (N = 372).
Epigenetic clock performance
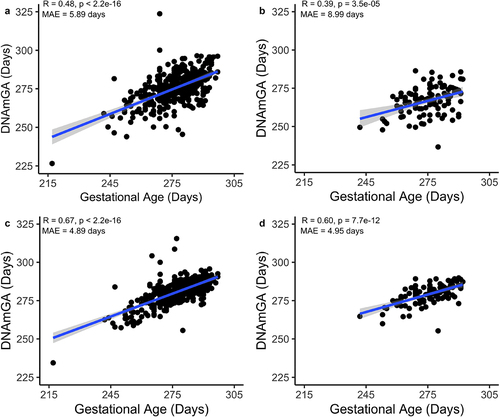
We observed positive Pearson correlations between chronological gestational age and the estimated DNAm GA from the Knight clock using both the 450K (r = 0.48, p < 2.2x10⁻¹⁶) and EPIC (r = 0.39, p = 3.5x10⁻⁵) methylation profiles (). The median absolute difference between Knight’s DNAm GA and chronological GA (‘median absolute error’) in test samples was 5.89 days among the subjects analysed with the 450K array and 8.99 days among those with the EPIC array. A positive Pearson correlation was also observed between chronological GA and DNAm GA as calculated with the Bohlin clock using the 450K (r = 0.67, p < 2.2x10⁻¹⁶) and EPIC (r = 0.60, p = 7.7x10⁻¹²) methylation measurements (). The median absolute errors between Bohlin’s DNAm GA and chronological GA were 4.89 days and 4.95 days when this clock was applied to the 450K and EPIC samples, respectively.
Figure 1. Performance of the DNAm GA Clock Predictions in the CHAMACOS Cohort Using Illumina 450K (N = 372) and EPIC (N = 108) DNAm Arrays. Pearson’s correlation and median absolute error (MAE) between chronological gestational age and DNAm GA calculated using (a) Knight’s clock and the 450K methylation data, (b) Knight’s clock and the EPIC methylation data, (c) Bohlin’s clock and the 450K methylation data, and (d) Bohlin’s clock and the EPIC methylation data.
Comparison of DNAm GA estimates from the Bohlin and Knight clocks
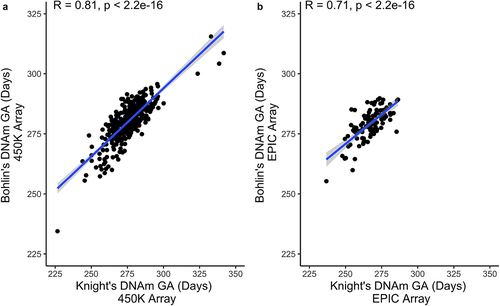
shows the relationship between the DNAm GA estimates from the two clocks across the same methylation array. As estimated with the 450K DNA methylation array, DNAm GA from the Knight clock was strongly correlated with DNAm GA from the Bohlin clock (r = 0.81, p < 2.2x10⁻¹⁶) (). Similarly, in the subsample with EPIC array measurements, DNAm GA from the Knight clock was strongly correlated with DNAm GA from the Bohlin clock (r = 0.71, p < 2.2x10⁻¹⁶) (). GAA derived from both clocks was also found to be highly correlated (r = 0.76, p < 2.2x10⁻¹⁶) ().
Figure 2. Comparison of DNAm GA Predictions by the Knight vs. Bohlin Clock Across the Same DNAm Array. Pearson’s correlation between (a) Knight DNAm GA and Bohlin DNAm GA determined from the 450K DNA methylation data (N = 372) and (b) Knight DNAm GA and Bohlin DNAm GA determined from the EPIC DNA methylation data (N = 108).
Comparison of DNAm GA estimates from 450K and EPIC methylation array
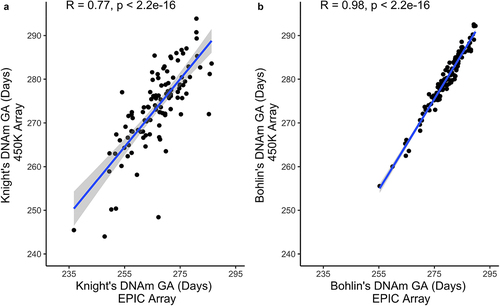
compares DNAm GA estimates from the two methylation arrays across the same gestational age clock from the same child. Using the Knight clock, DNAm GA estimates from the EPIC array were strongly correlated with those from the 450K array (r = 0.77, p < 2.2x10⁻¹⁶) (). The correlation across arrays using the Bohlin clock was stronger with less deviation (r = 0.98, p < 2.2x10⁻¹⁶) (). Figure S2 shows a strong, positive correlation between average estimated DNA methylation levels (β) measured by the 450K vs. EPIC array from CHAMACOS cord blood samples (r = 0.9963, p < 2.2x10⁻¹⁶). Each point represents one of the 224 non-missing CpG sites used by the Knight and Bohlin epigenetic clocks.
Figure 3. Comparison of DNAm GA Predictions by the Illumina 450K vs. EPIC DNAm array across the same epigenetic clock (N=108). Pearson’s correlation between (a) Knight’s DNAm GA from the EPIC array and Knight’s DNAm GA from the 450K array (b) Bohlin’s DNAm GA from the EPIC array and Bohlin’s DNAm GA from the 450K array.
Adjusted associations of maternal and infant characteristics with GAA
shows the results from linear regression models testing associations between GAA and individual maternal and infant characteristics among the 372 mother-child pairs with DNA methylation profiles from the Illumina 450K array. These associations were adjusted for maternal age at delivery, smoking during pregnancy, maternal education, marital status, and infant sex, selected a priori as potential confounders. GAA was defined as the residual from regressing DNAm GA estimates from the Knight and Bohlin clocks on chronological gestational age. Thus, GAA is independent of chronological gestational age. Positive or increased GAA indicates that epigenetic age, or DNAm GA, is greater than chronological age. Negative or decreased GAA indicates that DNAm GA is less than chronological age.
Table 2. Adjusted associations between gestational age acceleration estimated by the Knight and Bohlin epigenetic clocks with prenatal and birth characteristics in the CHAMACOS cohort (N = 372)†,‡.
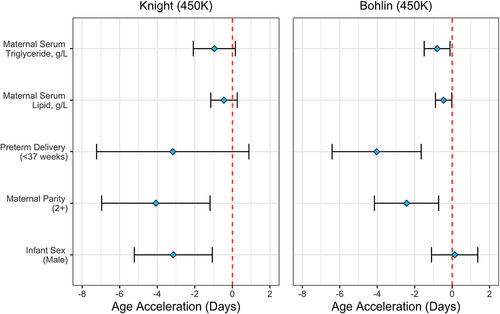
After covariate adjustment, higher levels of maternal serum triglycerides were significantly associated with decreased GAA (Bohlin: β = −0.01 days per mg/dL increase, 95% CI: −0.01, −8.95x10⁻⁴). Higher levels of total maternal serum lipids were also significantly associated with decreased GAA (Bohlin: β = −4.31x10⁻³ days per mg/dL increase, 95% CI: −8.82x10⁻³, -1.12x10⁻⁴). Preterm delivery (<37 weeks) was associated with decreased GAA (Bohlin: β = −4.03 days, 95% CI: −6.41, −1.65). Compared to infants of mothers without any prior deliveries (parity = 0), infants of mothers who had two or more prior deliveries had decreased GAA (Knight: β = −4.07 days, 95% CI: −6.96, −1.19; Bohlin: β = −2.43 days, 95% CI: −4.15, −0.72). Male infants had decreased GAA compared to females (Knight: β = −3.15 days, 95% CI: −5.22, −1.07). After adjusting for multiple comparisons, preterm delivery remained significantly associated with decreased GAA. depicts estimates and 95% CIs for these associations after covariate adjustment.
Figure 4. Adjusted Associations between Gestational Age Acceleration and Prenatal and Birth Characteristics in the CHAMACOS Cohort (N = 372)†. Estimates (β) and 95% CIs for characteristics significantly associated with gestational age acceleration after adjusting for maternal age at delivery, maternal smoking during pregnancy, maternal education, marital status, and infant sex across the two clocks. †Units for maternal serum triglyceride and maternal serum lipid levels converted from standard mg/dL to d/L for greater comparability of effect sizes in plot.
To determine if associations between the prenatal and birth environment with GAA might be influenced by age-related changes in immune cell-type composition, we further adjusted models by estimated nucleated cell-type proportions in cord blood (CD8+, CD4+, natural killer cells, B-cells, monocytes, granulocytes, and nucleated red blood cells), as well as the maternal and child covariates from the initial adjusted model. After additional adjustment of cell-type proportions, greater maternal serum triglyceride levels (Bohlin: β = −0.01, 95% CI: −0.01, -2.03x10⁻⁵), greater maternal parity (Knight: β = −3.50 days, 95% CI: −6.21, −0.80; Bohlin: β =-2.00 days, 95% CI: −3.64, −0.37) and male infant sex (Knight: β = −2.75 days, 95% CI: −4.69,-0.81) remained associated with decreased GAA (Table S2, Figure S1).
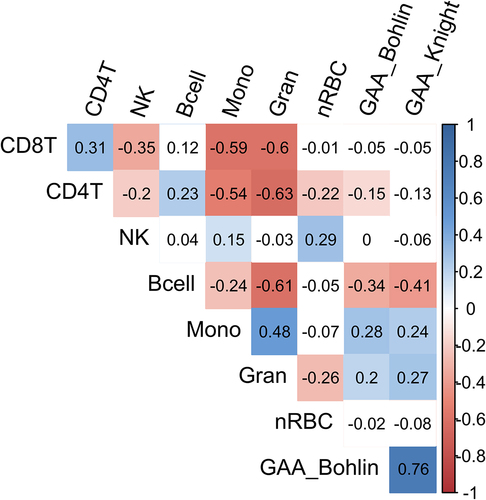
We further tested correlations between immune cell-type proportions and GAA as derived from the Bohlin and Knight clocks using the DNA methylation profiles from the 450K array. GAA estimated from the Bohlin and Knight clocks were both significantly correlated with lower proportions of B cells (Bohlin GAA: r = −0.34, Knight GAA: r = −0.41) and greater proportions of monocytes (Bohlin GAA: r = 0.28, Knight GAA: r = 0.24), and granulocytes (Bohlin GAA: r = 0.20, Knight GAA: r = 0.27) in the cord blood samples (). CD4 T-cell proportions were significantly negatively correlated with GAA derived from the Bohlin clock (r = −0.15). Natural killer cell (NK) and nucleated red blood cell (nRBC) proportions were not correlated with GAA for either clock ().
Figure 5. Correlations Coefficients Between Estimated Cell-Type Proportions and Gestational Age Acceleration Estimated by the Knight and Bohlin Clocks (N = 372). Pearson’s correlations between cell-type proportions estimated from DNA methylation profiles and gestational age acceleration calculated by the Bohlin and Knight models using the 450K array (blank/white cell = non-significant correlation p > 0.05).
Discussion
We observed that several maternal and newborn parameters, some known to reflect an adverse intrauterine environment, were associated with changes in GAA, a measure of biological ageing at birth. Higher levels of maternal serum triglycerides and total serum lipids during pregnancy, preterm delivery, greater maternal parity, and male infant sex were associated with decreased GAA. After adjustment for estimated cell-type proportions, some of these covariates remained negatively associated with GAA, which suggests that these exposures influence intrinsic rates of ageing. There was no consistent evidence of associations of GAA with pre-pregnancy BMI, pregnancy weight gain, maternal age at delivery, alcohol consumption and smoking during pregnancy, type of delivery, maternal adverse childhood experiences, or maternal socioeconomic status (i.e., marital status, education, occupation).
Our study presented novel findings on the association between maternal serum triglyceride levels, total maternal serum lipid levels, preterm delivery, parity, and infant sex with GAA. Although some of these factors associated with rates of epigenetic ageing are known to influence chronological gestational age, our results now provide evidence that, beyond disrupting time of delivery, these factors also influence the biological age of the newborns. GAA was derived from DNA methylation levels in cord blood samples. Identifying exposures associated with GAA makes it clear that biological ageing is a phenomenon that starts as early as conception, influencing the progression of health outcomes later in life, a paradigm in line with the Developmental Origins of Health and Disease (DOHaD) hypothesis [Citation44].
In adults, accelerated epigenetic ageing has been shown to be predictive of poor health outcomes [Citation2,Citation4,Citation5]. However, in the intrauterine environment, gestational age acceleration and gestational age deceleration can both be considered risk factors for later disease burden. Increased GAA has been associated with higher birth weight, length, and head circumference [Citation21,Citation23], which have been shown to contribute to age-related diseases such as obesity and increased mortality [Citation45]. Decreased GAA has been linked to prenatal environmental adversity and lower developmental maturity [Citation22,Citation46,Citation47] – risk factors for age-related diseases like cardiovascular disease and non-insulin dependent diabetes [Citation48,Citation49]. Longitudinal analyses should be designed to follow the impact of altered GAA on disease onset and progression later in life. We hypothesized that deaccelerated or accelerated ageing at birth and in childhood are both risk factors for health and development. Our hypothesis is that birth and paediatric epigenetic ageing might follow a specific tempo and disruptions (i.e., acceleration or deacceleration) are both detrimental.
Consistent with findings from Simpkin et al. [Citation50] and Dieckmann et al. [Citation17], we also demonstrate that the Bohlin clock predicted GA with a higher accuracy compared to the Knight clock using DNAm data from both the 450K and EPIC arrays. The Bohlin clock also resulted in predictions that had a lower median absolute error compared to the Knight clock. Even though only two CpGs (cg07816074, cg16536918) overlap between the Knight and Bohlin epigenetic clocks, we observed strong correlations (r > 0.7) between DNAm GA estimates from both clocks across the 450K and EPIC arrays. Consistently, the residual GAA estimates as determined by both clocks were found to be highly correlated, supporting that both clocks are measuring biological gestational age by leveraging different changes that occur in the human genome from conception to birth. This suggests that while both clocks reflect foetal development timing, they might differ in their biological insight by utilizing methylation of different sets of genes. Indeed, associations with sex were only captured by Knight’s GAA and not Bohlin’s GAA. Our results suggest that the greater accuracy of the Bohlin clock makes it more sensitive to detect associations, including those related to the external environment (i.e., triglycerides and lipids), while the Knight clock might be able to capture biological influences such as parity and sex. However, this needs further confirmation in other cohorts.
Another important observation in our data is that DNAm GA estimates from both clocks were more accurate when derived from the 450K DNAm data as opposed to the EPIC data. As seen by the strong correlation in average CpG DNAm levels estimated by the 450K and EPIC arrays, this difference in accuracy is not driven by some CpG sites. Instead, it may arise because both clocks were initially developed and trained with DNAm data from the 450K arrays, which measures fewer and different CpG sites than the newer EPIC array. Poorer accuracy using the EPIC DNAm array can also be attributed to a smaller overall sample size and more missing CpG sites in our EPIC DNAm profile. Seven CpGs (out of 148 CpGs) used in the Knight model and eight CpGs (out of 96 CpGs) used in the Bohlin model were missing. In contrast, none of the 148 CpGs used in the Knight model and three CpGs (out of 96 CpGs) used in the Bohlin model were missing in the 450K data after quality control. Compared to the Knight clock, the Bohlin clock demonstrated a higher accuracy using data from the EPIC array as shown by its stronger correlations between DNAm GA derived from EPIC data with chronological GA as well as between DNAm GA estimates from both array types. Correlations between DNAm GA and GA may provide insight into the accuracy of these clocks in predicting chronological gestational age. However, greater predictive accuracy does not necessarily translate to a better measure of biological age, which often deviates from chronological age.
Heterogeneous tissues, like cord blood, can vary in immune cell-type proportions over time and might be responsive to environmental conditions. We observed significant relationships between certain cell-type proportions and GAA estimates from both the Knight and Bohlin clocks. GAA residuals from both clocks had a significant moderate negative correlation with B cell proportions and significant positive correlations with monocyte and granulocyte proportions. GAA from the Bohlin clock was also negatively correlated with CD4T proportions. These findings highlight that, prior to adjustment, GAA from the Knight and Bohlin clocks might partially reflect and depend on cell-type proportions for a given sample and inherently measure extrinsic epigenetic age acceleration, a measure of ageing that captures age-related changes in immune cell composition [Citation43]. However, our findings related to maternal parity and infant sex remained significant after adjustment for cell-type composition, demonstrating an influence on intrinsic ageing processes independent of the immune system. Going forward, we suggest that investigators test both unadjusted and cell-type composition adjusted associations to address changes that might be related or independent of immune system changes. This approach will help test the influence of exposure on different aspects of ageing to help target interventions and biological pathways.
Our finding regarding male sex and decreased GAA was only supported by another study by Girchenko et al. [Citation20]. In contrast, Khouja et al. reported that male infants had greater GAA [Citation21]. Similarly, Horvath et al. found that adult men experienced higher rates of epigenetic ageing [Citation51], but this study did not include newborns, which could influence findings. According to Knight et al., the predictive accuracy of their clock is not dependent on neonatal sex, so further investigation is needed to corroborate the relationship of infant sex with differences in GAA derived from the Knight clock [Citation11]. We did not observe some previously reported associations in our cohort. For example, Girchenko et al. found a higher maternal age (>40 years at delivery) to be associated with increased GAA among newborns [Citation20]. Furthermore, Khouja et al. reported that increased maternal pre-pregnancy BMI and vaginal delivery were associated with increased GAA – a finding that we also did not observe in our population [Citation21]. We also did not find increased GAA to be associated with increased maternal BMI, maternal smoking during pregnancy, caesarean section delivery [Citation19], and increased birth weight and length [Citation23], as reported by Simpkin et al. and Bright et al., respectively.
The main strength of our study was its use of a well-characterized, primarily Latino birth cohort to extend studies of early life influences on epigenetic age acceleration. In addition to increasing diversity and representation within epigenetic studies, our study filled important gaps in knowledge by incorporating two relatively new epigenetic clocks that were specifically developed using umbilical cord blood and designed for newborns. By validating the performance of these clocks with both the traditional 450K and newer EPIC arrays, we hope to pave the way for future epigenetic ageing research on prenatal and early life exposures and the programming of ageing. The prospective nature of the study allowed us to assess exposures that occurred before or during the prenatal period and their association with GAA at birth. Our definition of GAA as the residual of DNAm GA regressed on chronological GA as opposed to the raw difference between these two measures allowed us to entirely remove the effect of chronological GA on DNAm GA in our analysis. This analytical approach has been taken with adult epigenetic clocks to reduce the residual influence of chronological age from inferences.
There are also several study limitations to consider. The chronological GA data are of different granularity with accuracy to the closest day for those with LMP estimates available and to the nearest completed week for those with ultrasound-based estimates from medical records. However, this is unlikely to be systematic and any exposure misclassification would be non-differential biasing results towards the null. The ethnic homogeneity of our sample may preclude generalizations to other groups. Our study design is primarily observational and draws upon cohort data, but some of our analyses are cross-sectional (i.e., maternal age at delivery, type of delivery, preterm delivery, birth weight, parity), which means we cannot establish causality but can only identify correlates of gestational age acceleration. While we adjusted for multiple comparisons, we also presented estimates and 95% CIs without this adjustment due to our limited sample size and interest in describing the properties of various epigenetic clocks in our cohort. We reported effect sizes and 95% CIs as measures of precision to allow for comparability to future studies.
Conclusions
Our study provides important evidence that the prenatal environment and neonatal birth parameters significantly impact epigenetic age acceleration at birth. Understanding the factors that affect biological ageing in newborns can help to identify early life influences of age-related conditions and new targets for public health interventions.
Authors’ contributions
SD analysed and visualized the data and drafted the manuscript. K Huen assisted with the design of the data analysis, performed laboratory epigenetics analyses, and edited the manuscript. LVDL and PAC helped with epigenetic data analysis and data management. JCN edited the manuscript. K Harley, JD, BE, and NH conceived the original study, supervised initial data and sample collection, and edited the manuscript. AC conceptualized the project, developed the data analysis plan, was involved in developing study methodology and funding acquisition, and edited the manuscript. All authors read and approved the final manuscript.
Availability of data and materials
Datasets generated and analysed during the current study are available from the corresponding authors with appropriate permission from the CHAMACOS study team and investigators upon reasonable request and institutional review board approval.
Ethics approval and consent to participate
The University of California, Berkeley Committee for the Protection of Human Subjects approved all study activities. Written informed consent was obtained from the CHAMACOS mothers.
Supplemental Material
Download PDF (1.6 MB)Acknowledgments
We gratefully acknowledge CHAMACOS participants and staff.
Supplementary material
Supplemental data for this article can be accessed online at https://doi.org/10.1080/15592294.2022.2102846
Disclosure statement
The authors declare they have no actual or potential competing financial interests.
Additional information
Funding
References
- Yu M, Hazelton WD, Luebeck GE, et al. Epigenetic aging: more than just a clock when it comes to cancer. Cancer Res. 2020 Feb 1;80(3):367–374.
- Horvath S, Raj K. DNA methylation-based biomarkers and the epigenetic clock theory of ageing. Nat Rev Genet. 2018 Jun;19(6):371–384.
- Pal S, Tyler JK. Epigenetics and aging. Sci Adv. 2016 Jul 1;2(7):e1600584.
- Esteller M. CpG island hypermethylation and tumor suppressor genes: a booming present, a brighter future. Oncogene. 2002 Aug;21(35):5427–5440.
- Lorenzen JM, Martino F, Thum T. Epigenetic modifications in cardiovascular disease. Basic Res Cardiol. 2012 Jan 11;107(2):245.
- Bell CG, Lowe R, Adams PD, et al. DNA methylation aging clocks: challenges and recommendations. Genome Biol. 2019 Nov 25;20(1):249.
- Lu AT, Quach A, Wilson JG, et al. DNA methylation GrimAge strongly predicts lifespan and healthspan. Aging (Albany NY). 2019 Jan 21;11(2):303–327.
- Engle WA. Morbidity and mortality in late preterm and early term newborns: a continuum. Clin Perinatol. 2011 Sep 1;38(3):493–516.
- Yang S, Platt RW, Kramer MS. Variation in child cognitive ability by week of gestation among healthy term births. Am J Epidemiol. 2010 Feb 15;171(4):399–406.
- Hansen AK, Wisborg K, Uldbjerg N, et al. Risk of respiratory morbidity in term infants delivered by elective caesarean section: cohort study. BMJ. 2008 Jan 10;336(7635):85–87.
- Knight AK, Craig JM, Theda C, et al. An epigenetic clock for gestational age at birth based on blood methylation data. Genome Biol. 2016 Oct 7;17(1):206.
- Bohlin J, Håberg SE, Magnus P, et al. Prediction of gestational age based on genome-wide differentially methylated regions. Genome Biol. 2016 Oct 7;17(1):207.
- Pidsley R, Zotenko E, Peters TJ, et al. Critical evaluation of the illumina methylationEPIC BeadChip microarray for whole-genome DNA methylation profiling. Genome Biol. 2016 Oct 7;17(1):208.
- Haftorn KL, Lee Y, Denault WRP, et al. An EPIC predictor of gestational age and its application to newborns conceived by assisted reproductive technologies. Clin Epigenetics. 2021 Apr 19;13(1):82.
- Dhingra R, Kwee LC, Diaz-Sanchez D, et al. Evaluating DNA methylation age on the illumina MethylationEPIC bead chip. PLoS ONE. 2019 Apr 19;14(4):e0207834.
- McEwen LM, Jones MJ, Lin DTS, et al. Systematic evaluation of DNA methylation age estimation with common preprocessing methods and the Infinium MethylationEPIC BeadChip array. Clin Epigenetics. 2018 Oct 16;10(1):123.
- Dieckmann L, Lahti-Pulkkinen M, Kvist T, et al. Characteristics of epigenetic aging across gestational and perinatal tissues. Clin Epigenetics. 2021 Apr 29;13(1):97.
- Chen L, Wagner CL, Dong Y, et al. Effects of maternal vitamin D3 supplementation on offspring epigenetic clock of gestational age at birth: a post-hoc analysis of a randomized controlled trial. Epigenetics. 2020 Aug 2;15(8):830–840.
- Simpkin AJ, Hemani G, Suderman M, et al. Prenatal and early life influences on epigenetic age in children: a study of mother–offspring pairs from two cohort studies. Hum Mol Genet. 2016 Jan 1;25(1):191–201.
- Girchenko P, Lahti J, Czamara D, et al. Associations between maternal risk factors of adverse pregnancy and birth outcomes and the offspring epigenetic clock of gestational age at birth. Clin Epigenetics. 2017 May 8;9(1):49.
- Khouja JN, Simpkin AJ, O’Keeffe LM, et al. Epigenetic gestational age acceleration: a prospective cohort study investigating associations with familial, sociodemographic and birth characteristics. Clin Epigenetics. 2018 Jun 27;10(1):86.
- Suarez A, Lahti J, Czamara D, et al. The epigenetic clock at birth: associations with maternal antenatal depression and child psychiatric problems. J Am Acad Child Adolesc Psychiatry. 2018 May;57(5):321–328.e2.
- Bright HD, Howe LD, Khouja JN, et al. Epigenetic gestational age and trajectories of weight and height during childhood: a prospective cohort study. Clin Epigenetics. 2019 Dec 16;11(1):194.
- CHAMACOS Study | CERCH [Internet]. [ cited 2021 Jun 5]. Available from: https://cerch.berkeley.edu/research-programs/chamacos-study
- Eskenazi B, Bradman A, Gladstone EA, et al. CHAMACOS, a longitudinal birth cohort study: lessons from the fields. J Child Health. 2003 Jan 1;1(1):3–27.
- Holland N, Furlong C, Bastaki M, et al. Paraoxonase polymorphisms, haplotypes, and enzyme activity in Latino mothers and newborns. Environ Health Perspect. 2006 Jul;114(7):985–991.
- Bibikova M, Barnes B, Tsan C, et al. High density DNA methylation array with single CpG site resolution. Genomics. 2011 Oct;98(4):288–295.
- Sandoval J, Heyn H, Moran S, et al. Validation of a DNA methylation microarray for 450,000 CpG sites in the human genome. Epigenetics. 2011 Jun 1;6(6):692–702.
- Solomon O, MacIsaac J, Quach H, et al. Comparison of DNA methylation measured by Illumina 450K and EPIC BeadChips in blood of newborns and 14-year-old children. Epigenetics. 2018 Jun 3;13(6):655–664.
- Yousefi P, Huen K, Davé V, et al. Sex differences in DNA methylation assessed by 450 K BeadChip in newborns. BMC Genomics. 2015 Nov 9;16(1):911.
- Aryee MJ, Jaffe AE, Corrada-Bravo H, et al. Minfi: a flexible and comprehensive Bioconductor package for the analysis of Infinium DNA methylation microarrays. Bioinforma Oxf Engl. 2014 May 15;30(10):1363–1369.
- Bakulski KM, Feinberg JI, Andrews SV, et al. DNA methylation of cord blood cell types: applications for mixed cell birth studies. Epigenetics. 2016 May 3;11(5):354–362.
- Bohlin J. GAprediction: prediction of gestational age with Illumina HumanMethylation450 data [Internet]. Bioconductor version: Release (3.14); 2022 [cited 2022 Apr 17]. Available from: https://bioconductor.org/packages/GAprediction/
- Hastie T, Tibshirani R, Narasimhan B, et al. impute: impute: imputation for microarray data [Internet]. Bioconductor version: Release (3.14); 2022 [cited 2022 Apr 17]. Available from: https://bioconductor.org/packages/impute/
- Troyanskaya O, Cantor M, Sherlock G, et al. Missing value estimation methods for DNA microarrays. Bioinformatics. 2001 Jun 1;17(6):520–525.
- DNAm age: frequently asked questions [Internet]. [ cited 2022 Apr 17]. Available from: https://horvath.genetics.ucla.edu/html/dnamage/faq.htm
- Phillips DL, Pirkle JL, Burse VW, et al. Chlorinated hydrocarbon levels in human serum: effects of fasting and feeding. Arch Environ Contam Toxicol. 1989 Jul 1;18(4):495–500.
- Eskenazi B, Harley K, Bradman A, et al. Association of in utero organophosphate pesticide exposure and fetal growth and length of gestation in an agricultural population. Environ Health Perspect. 2004 Jul;112(10):1116–1124.
- Horvath S. DNA methylation age of human tissues and cell types. Genome Biol. 2013;14(10):R115.
- Laubach ZM, Perng W, Cardenas A, et al. Socioeconomic status and DNA methylation from birth through mid-childhood: a prospective study in project viva. Epigenomics. 2019;11(12):1413–1427.
- Joubert BR, Håberg SE, Nilsen RM, et al. 450K epigenome-wide scan identifies differential DNA methylation in newborns related to maternal smoking during pregnancy. Environ Health Perspect. 2012 Oct;120(10):1425–1431.
- Markunas CA, Wilcox AJ, Xu Z, et al. Maternal age at delivery is associated with an epigenetic signature in both newborns and adults. PLoS ONE. 2016 Jul 6;11(7):e0156361.
- Horvath S, Ritz BR. Increased epigenetic age and granulocyte counts in the blood of Parkinson’s disease patients. Aging (Albany NY). 2015 Dec 9;7(12):1130–1142.
- Heindel JJ, Vandenberg LN. Developmental origins of health and disease: a paradigm for understanding disease etiology and prevention. Curr Opin Pediatr. 2015 Apr;27(2):248–253.
- Williams CB, Mackenzie KC, Gahagan S. The effect of maternal obesity on the offspring. Clin Obstet Gynecol. 2014 Sep;57(3):508–515.
- Knight AK, Smith AK, Conneely KN, et al. Relationship between epigenetic maturity and respiratory morbidity in preterm infants. J Pediatr. 2018 Jul;198:168–173.e2.
- Palma-Gudiel H, Eixarch E, Crispi F, et al. Prenatal adverse environment is associated with epigenetic age deceleration at birth and hypomethylation at the hypoxia-responsive EP300 gene. Clin Epigenetics. 2019 May 9;11(1):73.
- Barker DJ, Godfrey KM, Fall C, et al. Relation of birth weight and childhood respiratory infection to adult lung function and death from chronic obstructive airways disease. BMJ. 1991 Sep 21;303(6804):671–675.
- Visentin S, Grumolato F, Nardelli GB, et al. Early origins of adult disease: low birth weight and vascular remodeling. Atherosclerosis. 2014 Dec;237(2):391–399.
- Simpkin AJ, Suderman M, Howe LD. Epigenetic clocks for gestational age: statistical and study design considerations. Clin Epigenetics. 2017 Sep 15;9(1):100.
- Horvath S, Gurven M, Levine ME, et al. An epigenetic clock analysis of race/ethnicity, sex, and coronary heart disease. Genome Biol. 2016 Aug 11;17(1):171.