
Abstract
Objectives
Disrupted auditory networks play an important role in the pathophysiology of psychosis, with abnormalities already observed in individuals at clinical high-risk for psychosis (CHR). Here, we examine structural and functional connectivity of an auditory network in CHR utilising state-of-the-art electroencephalography and diffusion imaging techniques.
Methods
Twenty-six CHR subjects and 13 healthy controls (HC) underwent diffusion MRI and electroencephalography while performing an auditory task. We investigated structural connectivity, measured as fractional anisotropy in the Arcuate Fasciculus (AF), Cingulum Bundle, and Superior Longitudinal Fasciculus-II. Gamma-band lagged-phase synchronisation, a functional connectivity measure, was calculated between cortical regions connected by these tracts.
Results
CHR subjects showed significantly higher structural connectivity in the right AF than HC (p < .001). Although non-significant, functional connectivity between cortical areas connected by the AF was lower in CHR than HC (p = .078). Structural and functional connectivity were correlated in HC (p = .056) but not in CHR (p = .29).
Conclusions
We observe significant differences in structural connectivity of the AF, without a concomitant significant change in functional connectivity in CHR subjects. This may suggest that the CHR state is characterised by a decoupling of structural and functional connectivity, possibly due to abnormal white matter maturation.
Introduction
Psychosis is a group of severe mental disorders and is among the top ten causes of long-term disability in the world (Mueser and McGurk Citation2004). While treatment is often challenging (Owen et al. Citation2016), early targeted interventions have been shown to improve treatment response and clinical outcomes (Keshavan et al. Citation2010; Fusar-Poli et al. Citation2017). To implement early treatment interventions, the clinical research community has defined a set of behavioural criteria to characterise individuals at clinical high-risk (CHR) for developing psychosis (Addington et al. Citation2011, Citation2015). Research in this area has increasingly focussed on not only describing the CHR state, but also on examining the neuropathological factors that may underlie the emergence of clinical symptoms in these individuals.
In particular, results from different research fields point towards a crucial role of disrupted auditory networks in CHR individuals (Karlsgodt et al. Citation2009; Perez et al. Citation2013; von Hohenberg et al. Citation2014; Leicht et al. Citation2016). Studies in these at-risk populations have reported structural and functional impairments in auditory pathways (Karlsgodt et al. Citation2009; Perez et al. Citation2013; von Hohenberg et al. Citation2014; Leicht et al. Citation2016). For instance, an array of electroencephalography (EEG)-linked abnormalities in auditory networks have been observed, with studies consistently reporting altered gamma-band oscillations (30–100 Hz) in subjects across the psychosis illness course, including CHR subjects (Reilly et al. Citation2018). More specifically, the reaction to auditory stimuli, the so-called auditory-evoked gamma-band response (aeGBR), has been shown to be diminished in CHR subjects (Perez et al. Citation2013). In our previous work (Leicht et al. Citation2016), utilising a combined EEG-functional magnetic resonance imaging paradigm, we found that the network of regions which generated the aeGBR in healthy controls was impaired in CHR individuals. The identified network, critical for the cognitive processing of auditory stimuli (Polomac et al. Citation2015), is comprised of the bilateral primary auditory cortices (PAC), the thalamus, and frontal brain regions, including the dorsal anterior cingulate cortex (dACC) and the bilateral dorsolateral prefrontal cortex (DLPFC) (Leicht et al. Citation2016).
In addition to functional magnetic resonance imaging and EEG findings, studies employed diffusion magnetic resonance imaging (dMRI) for the in vivo analysis of white matter microstructure in psychosis based on the magnitude and directionality of water diffusion along axons (Pierpaoli and Basser Citation1996; Mori and Zhang Citation2006). The primary outcome measure, fractional anisotropy, is a putative marker of overall white matter microstructure and may represent structural connectivity of underlying fibre tracts (Assaf and Pasternak Citation2008; Jones et al. Citation2013). Changes in fractional anisotropy in auditory pathways in subjects with psychosis and CHR subjects have been frequently reported (Knöchel et al. 2012; Mulert et al. Citation2012; Ćurčić-Blake et al. Citation2017), albeit with some inconsistencies (Peters et al. Citation2008, Citation2010; Domen et al. Citation2013; Wigand et al. Citation2015). Taken together, these results point towards both functional and structural alterations in auditory networks in the CHR state.
In order to understand better the neuropathology underlying the CHR state, more studies are needed which examine both structural and functional connectivity in auditory networks in CHR individuals. As aberrant communication between distributed brain areas is the potential source of pathology in psychosis, the investigation of an entire network by means of structural and functional connectivity offers a unique insight into mechanisms that are likely to be impaired in psychosis and at-risk states (van den Heuvel et al. Citation2013; van den Heuvel and Fornito Citation2014).
In the present study, we investigate the structure and function of the previously described aeGBR-specific network combining EEG and dMRI. Here, we analyse the functional connectivity of the aeGBR-specific network (i.e. bilateral dACC, PAC, DLPFC) using a source localisation approach. Next, we examine the white matter pathways that provide connectivity between the structures of this network (Arcuate Fasciculus (AF), Cingulum Bundle (CB), Superior Longitudinal Fasciculus II (SLF-II)) with unscented Kalman Filter (UKF) tractography with free-water correction (Malcolm et al. Citation2009; Lienhard et al. Citation2011; Gong et al. Citation2018). Based on previous literature, we hypothesise that we will observe both structural and functional abnormalities in CHR subjects compared to healthy controls (HC). Moreover, we believe that these abnormalities will be more pronounced in CHR subjects who later convert to psychosis (CHR-P) as opposed to those who do not later convert (CHR-NP) (Wang et al. Citation2016; Nägele et al. Citation2021). Last, we explore the relationship between structural and functional connectivity measures to understand the role of neuronal networks in the neuropathology of CHR.
Materials and methods
Participants
The current study includes 26 CHR subjects and 13 HC who received a baseline dMRI scan and underwent an EEG recording while performing an auditory choice reaction task. This study was approved by the Ethics Committee of the Medical Association Hamburg, and written informed consent was obtained from all participants or their legal guardians in the case of minors. The present study was part of a larger project investigating functional and structural connectivity in psychosis within the context of the Collaborative Research Centre 936 (‘multi-site communication in the brain,’ www.sfb936.net). Portions of these data have already been published (Leicht et al. Citation2016, Citation2021; Nägele et al. Citation2021; Steinmann et al. Citation2021).
We defined CHR individuals following the Early Detection and Intervention Program of the German Research Network on Schizophrenia (GRNS) (Wölwer et al. Citation2006). Current substance abuse or dependence, the presence of major somatic or neurological disorders, or a hearing range lower than 30 dB at a pitch of 1000 Hz were exclusion criteria for all subjects. Further exclusion criteria for HC included the treatment for any previous psychiatric disorder or a family history of psychotic disorders. Psychiatrists assessed the applicability of inclusion and exclusion criteria using a semi-structured interview. To preclude a diagnosis of schizophrenia spectrum disorder and to record comorbid psychiatric diagnoses, we conducted the Mini-International Neuropsychiatric Interview (Sheehan et al. Citation1998) for CHR subjects. In addition, the CHR subjects underwent neuropsychiatric testing to assess symptom severity using the Positive and Negative Syndrome Scale (PANSS) (Kay et al. Citation1987), as well as the Scale of Prodromal Symptoms (SOPS) (Miller et al. Citation2003). We repeated the testing after a follow-up period of approximately one year. Four CHR subjects dropped out before follow-up. If subjects reached a score of six in any of the positive SOPS symptom domains at the follow-up assessment, they were considered to have converted to psychosis. We used the Structured Clinical Interview for DSM-IV Axis I Disorders (SCID-I) to specify the type of psychosis.
Overview
We acquired dMRI and EEG data from all 39 participants between 2012 and 2016. This study used brain regions of interest that were previously reported to be impaired in CHR subjects by Leicht et al. (Leicht et al. Citation2016) (i.e. bilateral dACC, PAC, DLPFC). Next, we consulted with a neuroanatomist who helped identify the underlying structural connections present in this network leading to the selection of bilateral AF, CB, and SLF-II ( and ). For an overview of the study process, please see .
Figure 1. Study Protocol. DLPFC, PAC and dACC generate the auditory-evoked gamma-band response. CHR: Clinical High-Risk; -NP: Non-Psychosis; -P: Psychosis; dACC: dorsal Anterior Cingulate Cortex; DLPFC: Dorsolateral Prefrontal Cortex; HC: Healthy Controls; PAC: Primary Auditory Cortex.
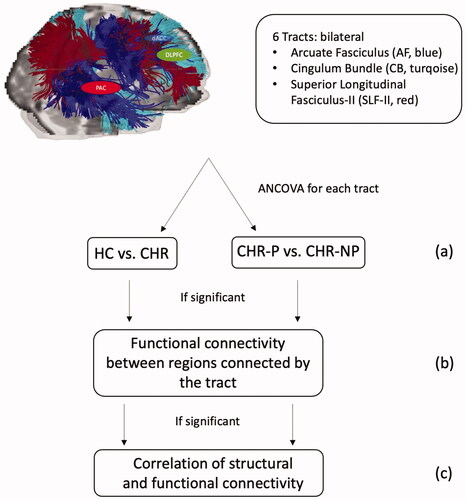
Figure 2. Clustering results of the (a) AF, (b) CB and (c) SLF-II of a CHR subject. White matter fibre clustering was used to extract tracts for each subject. AF: Arcuate Fasciculus; CB: Cingulum Bundle; CHR: Clinical High-Risk; SLF-II: Superior Longitudinal Fasciculus II.
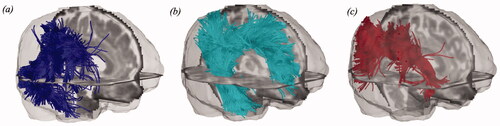
Image acquisition
All dMRI scans were acquired on a 3T MRI scanner (Siemens Magnetom Trio) at the University Medical Centre Hamburg-Eppendorf, using a 12-channel head coil and a spin-echo single-shot echo-planar imaging sequence (EPI) (TR = 7.7 s, TE = 85 ms, flip angle = 90°, 64 interleaved slices, slice thickness = 2 mm, field of view (FOV) = 216 × 256 mm2, matrix = 108 × 128). Thirty non-colinear gradient directions with b = 1000 s/mm2 were acquired twice in addition to 10 images with b = 0 s/mm2.
Image preprocessing
Diffusion images were visually inspected and corrected for head motion and eddy current distortion by applying an affine registration of each gradient direction to the baseline B0 utilising FLIRT (FSL, Oxford; http://fsl.fmrib.ox.ac.uk/fsl (Jenkinson et al. Citation2002)). Brain masks were then automatically generated using 3D Slicer (software version 4.5; www.slicer.org (Fedorov et al. Citation2012)) employing Otsu’s method and manually edited to guarantee anatomical precision. After preprocessing, each gradient was averaged from both acquisitions using an in-house developed script (Billah et al. Citation2019).
Clustering and diffusion parameter extraction
Whole-brain UKF tractography was conducted employing a two-tensor multi-fibre tracking algorithm (Malcolm et al. Citation2009; Lienhard et al. Citation2011) with free-water correction (Lienhard et al. Citation2011; Gong et al. Citation2018). In addition to the two cylindrically symmetric tensors, the free-water model estimates a third isotropic tensor with a fixed diffusivity to represent freely diffusing water in the extracellular compartment (Gong et al. Citation2018). This method provides accurate results despite noise, uncertainty, and crossing fibres (Malcolm et al. Citation2009; Lienhard et al. Citation2011). Furthermore, adding the free-water model eliminates the partial volume effects of freely diffusing water, enabling more precise analysis of tissue properties (Pasternak et al. Citation2009). We performed visual and quantitative quality control of the tractography using a quality control tool in the white matter analysis software (https://github.com/SlicerDMRI/whitematteranalysis). A fibre clustering anatomical annotation method independent from cortical or subcortical segmentations was utilised (Zhang et al. Citation2018). First, an individual subject’s tractography was aligned to the atlas space. Each fibre was then assigned to the closest cluster, removing outliers with a low affinity to their cluster to reject uncommon tractography errors (for details, see (O’Donnell et al. Citation2017; Zhang et al. Citation2018)). After this, the clusters were transformed back into the subject-specific diffusion-weighted image space. Next, we conducted anatomical tract identification separately for each hemisphere by finding each tract’s corresponding annotated atlas clusters. For each tract, we extracted the free-water corrected fractional anisotropy (FA) by averaging across all obtained streamlines (Pasternak et al. Citation2009; Zhang et al. Citation2018; Zekelman et al. Citation2022) as our measure of structural connectivity within the network.
EEG paradigm
We used a cognitively demanding auditory choice reaction task (Mulert et al. Citation2001) that had previously been demonstrated to increase the aeGBR amplitude in HC (Mulert et al. Citation2007). During the task, 300 tones of three different pitches (33% 800 Hertz (Hz), 33% 1000 Hz, and 33% 1200 Hz; duration: 200 ms, generated using the Presentation software version 17) were presented with pseudo-randomised interstimulus intervals (ISI: 2.5–7.5 s; mean 5.0 s) via earphones at 85 dB sound pressure level. Tones at a pitch of 800 Hz and 1200 Hz were considered target stimuli and had to be responded to differentially by button-press with the left or the right index finger as fast and accurately as possible. Reaction times and the number of correct trials (correct responses within 2000 ms after target stimulus presentation) were registered during the experimental run.
EEG acquisition
Participants were seated in a sound-attenuated and electrically-shielded room, eyes open, in a slightly reclined chair with a headrest, and looked at a fixation cross presented at a 19‶ computer monitor. We recorded the EEG with a sampling rate of 1000 Hz, with 66 active electrodes mounted on an elastic cap (ActiCaps, Brain Products, Munich, Germany) using the Brain Vision Recorder software Version 1.10 (Brain Products, Munich, Germany). Electrodes were positioned in a modified 10/10 system without electrodes at FPz, F9, F10, T9, T10, CP3, CP4, P9, P10, PO7, PO8, and additional electrodes positions PO9 and PO10. Eye movements were recorded through four EOG channels. An electrode at the FCz position was the reference electrode. The electrode at position AFz served as ground. Impedances were always below 5 kΩ.
EEG preprocessing
Data analyses were performed using Brain Vision Analyser Version 2.1 (Brain Products, Munich, Germany). We excluded channels PO9 and PO10 from further analyses due to persistent muscle artefacts. After band-pass filtering (1–120 Hz), topographic interpolation (spherical splines) of up to six channels was conducted (M = 2.89, SD = 1.88). Channels were selected for interpolation if more than 5% of data in the respective channel was affected by technical artefacts or muscle artefacts exceeding amplitudes of 70 μV. Continuous EEG was segmented into epochs of 1024 ms starting 400 ms prior to the auditory stimulus. We automatically rejected segments including incorrect responses or amplitudes exceeding 70 μV within a 410 ms window starting 210 ms pre-stimulus in any channel. Subsequently, the number of trials incorporated in further analyses was matched to the subject with the least number of trials (30), based on a random choice, to control sample size bias (Helfrich et al. Citation2016; Clayson and Miller Citation2017; Meier et al. Citation2019).
Lagged phase synchronization
Functional connectivity analysis was executed in source space, applying the LORETA KEY software package (http://www.uzh.ch/keyinst/loreta.htm). The eLORETA approach is an inverse solution that allows exact, zero-error localisation in the presence of measurement and structured biological noise (Pascual-Marqui Citation2007a; Pascual-Marqui et al. Citation2011). Lagged phase synchronisation (LPS) measures functional connectivity in the low gamma band (30–50 Hz). In contrast to power measures (used in the previous analysis (Leicht et al. Citation2016)), it offers the opportunity to investigate connectivity between the regions that are involved in the generation of the aeGBR (Pascual-Marqui Citation2007b; Pascual-Marqui et al. Citation2011; Steinmann et al. Citation2014). These were extracted from the eLORETA software, which is based on the Talairach Daemon (http://www.talairach.org). LPS is specified as the coherency between normalised Fourier transformed signals, thus incorporating only phase information in a highly nonlinear way. Additionally, it eliminates the effects of zero-lag phase synchrony (Pascual-Marqui Citation2007b), mainly attributed to non-physiological effects, such as volume conduction and low spatial resolution, making it more precise than conventional connectivity measures (Nolte et al. Citation2004; Stam et al. Citation2007). In the present analyses, we investigated the average LPS from stimulus onset up to 200 ms post-stimulus presentation. This timeframe includes the typical aeGBR with its peak between 30 and 100 ms post-stimulus (Tiitinen et al. Citation1993; Mulert et al. Citation2007; Leicht et al. Citation2010; Mulert et al. Citation2010) and is based on findings from Leicht et al. (Citation2016) who identified the investigated brain regions as generators of the aeGBR in EEG-informed functional magnetic resonance imaging.
Statistical analyses
We carried out all statistical analyses using SPSS Statistics Version 24. We compared CHR individuals with HC and subsequently CHR-P with CHR-NP in separate analyses for all group comparisons. First, differences in FA were assessed between groups employing univariate ANCOVAs for both left and right AF, CB, and SLF-II, controlling for age, sex, and education years (p ≤ .008, Bonferroni-corrected threshold for six tracts, ).
In the event of significant group differences for a given tract, we calculated functional connectivity between the regions connected by that tract. Univariate ANOVAs were utilised to detect group differences, using the average LPS from stimulus onset up to 200 ms post-stimulus presentation as the dependent variable ().
Additionally, given a significant group difference in a tract, we correlated the FA and LPS measures with the PANSS (Positive, Negative, Global) and the SOPS (Positive, Negative, Disorganisation, Global) scores. We repeated the same analyses for reaction time and number of correct trials using Spearman’s rho (non-parametric two-tailed; p ≤ .006, Bonferroni-corrected threshold for nine measures).
Finally, we correlated the LPS with the FA of the corresponding tract that showed significant group differences utilising Spearman’s rho (p ≤ .05 for one comparison; non-parametric one-tailed, ). Subsequently, Fisher’s Exact Score was used to identify correlation coefficients that differed significantly from 0.
Results
Participants
CHR subjects and HC were matched regarding age, sex, and years of education (). Nine out of the 26 CHR individuals were receiving one or two atypical antipsychotics during the study (aripiprazole [n = 3]; quetiapine [n = 2]; olanzapine [n = 3]; risperidone [n = 2]). Two CHR individuals were concomitantly medicated with anti-depressants (citalopram [n = 1]; escitalopram [n = 1]) and one with ADHD medication (atomoxetine).
Table 1. Demographic and clinical characteristics.
The prevalence of psychiatric comorbidities in the CHR group was relatively high (n = 20); the most common comorbidity was mood disorders (n = 12), followed by substance use disorders (n = 9 [all subjects were currently abstinent]). Within the follow-up period (M = 15.62 months, SD = 6.83), seven CHR subjects (27%) converted to psychosis, as assessed using the SCID-I (DSM-IV). The groups remained matched for all demographic and clinical characteristics when comparing the CHR converters to the non-converters ().
White matter microstructure
CHR subjects showed significantly higher FA in the right AF than HC (p < .001, η2 = .31, ). We did not find significant group differences in any other tract (left AF, bilateral CB, and SLF-II), and there were no significant differences when comparing CHR-P with CHR-NP ().
Figure 3. FA and LPS compared between CHR subjects and HC. CHR subjects exhibited significantly increased FA in the right AF compared to HC (CHR: .64 ± .02; HC: .61 ± .03; F(1, 34) = 12.41; p < .001, η2 = .31). The LPS between right PAC and DLPFC, which are connected by the AF, was decreased in CHR subjects compared to HC (CHR: .69 ± .14; HC: .77 ± .12; F(1, 37) = 3.3; p = .078, η2 = .08). AF: Arcuate Fasciculus; CHR: Clinical High-Risk; DLPFC: Dorsolateral Prefrontal Cortex; FA: free-water corrected Fractional Anisotropy; HC: Healthy Controls; LPS: Lagged Phase Synchronisation; PAC: Primary Auditory Cortex.
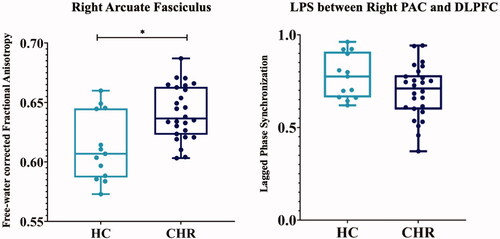
Table 2. ANCOVAs for group differences in each tract.
Gamma band connectivity
The number of correct trials during the performance of the auditory choice reaction task was significantly lower in CHR subjects compared to HC (CHR: 73.54 ± 7.75; HC: 77.23 ± 2.35; t(33) = 2.23; p = .033). The average reaction time to the auditory stimulus did not significantly differ between CHR subjects and HC (CHR: 718.86 ± 116.85 ms; HC: 663.43 ± 124.34 ms; t(23) = −1.34; p = .19). In an ANOVA with the average LPS between right PAC and DLPFC from stimulus onset up to 200 ms, CHR subjects displayed a lower LPS compared to HC, although the significance level of p ≤ .05 was not reached (CHR: .69 ± .14; HC: .77 ± .12; F(1, 37) = 3.3; p = .078, η2 = .08, ). Conducting the same analysis to compare both subgroups, CHR-P did not significantly differ from CHR-NP (CHR-NP: .69 ± .16; CHR-P: .70 ± .12; F(1, 24) = 0.03; p = .87).
Correlation with clinical scores and behavioral data
We did not find a significant correlation between the FA in the right AF, the corresponding LPS between right PAC and DLPFC, and any PANSS (Positive, Negative, Global) or SOPS (Positive, Negative, Disorganisation, Global) sub-scores. Also, we did not find significant correlations between the FA in the right AF or the corresponding LPS and measures of task performance (i.e. number of correct trials, reaction time) (Supplementary Table 1).
Correlation between measures of connectivity
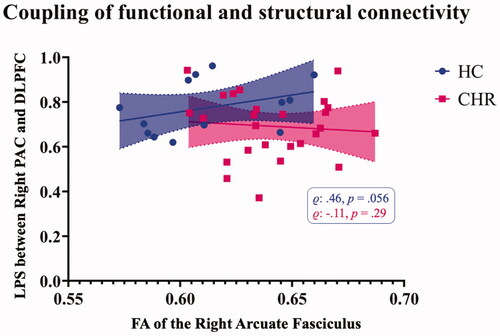
We detected a positive correlation between FA in the right AF and the LPS between right DLPFC and PAC for HC, although the significance did not reach the threshold of p ≤ .05 (r = .46, p = .056, ). This correlation was not present in the CHR group (r = −.11, p = .29; CHR-NP: r = .032, p = .46; CHR-P: r = −.32, p = .24).
Figure 4. Correlation of functional and structural connectivity measures. In HC, the FA of the right AF was positively correlated with the LPS between the respective regions, right PAC and DLPFC. This correlation was absent in CHR individuals. AF: Arcuate Fasciculus; CHR: Clinical High-Risk; DLPFC: Dorsolateral Prefrontal Cortex; FA: free-water corrected Fractional Anisotropy; HC: Healthy Controls; LPS: Lagged Phase Synchronisation; PAC: Primary Auditory Cortex.
Discussion
The present study combines a white matter structural connectivity analysis with an EEG functional connectivity analysis to investigate the aeGBR-specific network in CHR individuals and matched HC. We find that CHR subjects exhibit significantly higher FA in the right AF and, while non-significant, show reductions in functional connectivity between brain regions connected by the AF compared to HC. Furthermore, structural and functional connectivity measures were correlated in HC but not CHR, indicating that the network of aeGBR generators is not intact in CHR subjects.
Structural connectivity
Given its central role in auditory and language processing, the AF has been reported to be tightly linked to the emergence of auditory verbal hallucinations (Catani and Thiebaut de Schotten Citation2008; Wu et al. Citation2015), making it a tract of great interest in psychosis research (Ćurčić-Blake et al. Citation2015). Our finding of significantly higher FA in CHR subjects than HC in the right AF has previously been described in the literature in unaffected populations with a high genetic risk for schizophrenia (Hoptman et al. Citation2008; Kim et al. Citation2012; Knöchel et al. Citation2012; Boos et al. Citation2013). Moreover, a recent large-scale study found significantly increased whole-brain FA in CHR adolescents, yet the whole-brain FA began to decrease by the age of 30 (Di Biase et al. Citation2021). The finding of higher FA in CHR contrasts a large number of reports of widespread FA reductions in populations of first-episode and chronic schizophrenia subjects (Holleran et al. Citation2014; Zhuo et al. Citation2016; Del Re et al. Citation2019; Mamah et al. Citation2019). Authors have interpreted these seemingly contradicting findings as evidence of potentially altered maturational trajectories for specific white matter tracts in CHR individuals. Findings regarding the CB and SLF have also been ambiguous, with some prior studies reporting increases and decreases in FA in individuals at CHR (Karlsgodt et al. Citation2009; Bloemen et al. Citation2010; Carletti et al. Citation2012; Schmidt et al. Citation2015; Tang et al. Citation2019). Our findings provide additional support that the AF might be particularly relevant for psychosis pathology. However, studies aimed to characterise long-term white matter development across the illness course will help construct a more complete picture of its involvement in emerging psychosis.
Functional connectivity
The reductions in functional connectivity, as measured by LPS in CHR individuals, though non-significant, supplement the prior work by Leicht and colleagues (Leicht et al. Citation2016). In the earlier study on this sample, the authors reported diminished gamma power in the aeGBR-specific network. While power is a commonly used EEG metric, LPS is more advanced because it allows for the analysis of the physiological connectivity between cortical regions of interest, thereby providing more specific insights into the communication of distributed brain areas (Pascual-Marqui Citation2007b; Pascual-Marqui et al. Citation2011). Gamma-band oscillations are the basis of local and long-range synchronisation during higher-order cognitive tasks (Engel et al. Citation2001; Fries Citation2005), and have been shown to be correlated to functional magnetic resonance imaging connectivity patterns (Leicht et al. Citation2021). Their impairment in CHR subjects has been frequently described (Perez et al. Citation2013; Ramyead et al. Citation2015; Tada et al. Citation2016; Lepock et al. Citation2020). In the present study, the altered functional connectivity in response to the auditory stimulus was accompanied by poorer task performance in CHR subjects. This poorer task performance has previously been demonstrated for individuals at CHR (Leicht et al. Citation2016), across all stages of schizophrenia (Leicht et al. Citation2010, Citation2015), in healthy first-degree relatives (Leicht et al. Citation2011), as well as in the ketamine-model of schizophrenia (Curic et al. Citation2019; Haaf et al. Citation2022) and was attributed to deficits in the cognitive processing of the auditory stimulus.
Investigating the relationship between structural and functional connectivity
As suggested above, our findings of increased FA in the AF may indicate a shift in white matter maturation, potentially manifesting as a premature peak in FA in CHR individuals, which could represent accelerated myelin development, deficient axonal pruning or oligodendroglial hyperplasia (Di Biase et al. Citation2021). Previous studies support the notion of accelerated white matter maturation in CHR individuals and also demonstrate signs of accelerated ageing (shown by faster FA decline after 30) in individuals who convert to psychosis (Kochunov et al. Citation2013; Kochunov and Hong Citation2014; Cetin-Karayumak et al. Citation2020; Di Biase et al. Citation2021). When considering the possibility for altered trajectories, our functional connectivity findings present an interesting avenue to explore as well. Contrary to previous studies of individuals with psychosis, we only observe slight functional connectivity abnormalities in our CHR population. We also find an association between structural and functional connectivity in HC, but not in CHR individuals. This aligns with prior work that has reported a significant relationship between another structural measure, cortical thickness, and gamma oscillations in HC but not in individuals with psychosis (Edgar et al. Citation2014; Kim et al. Citation2019). The authors interpreted these findings as evidence for altered structure-function relationships underlying the pathophysiology of psychosis (Edgar et al. Citation2014; Kim et al. Citation2019). Combining existing literature with our findings might suggest that structural abnormalities precede functional impairments in the auditory network and that the CHR state may be characterised by a decoupling of structural and functional connectivity. However, it is also possible that the FA increase in CHR may represent a failed compensatory mechanism to counteract early functional impairments of the aeGBR-specific network such that increased connectivity does not compensate for functional deficits (Hoptman et al. Citation2008; Kim et al. Citation2012; Boos et al. Citation2013; Di Biase et al. Citation2019). Given the high degree of entanglement between aberrant structural and functional changes in CHR, it is difficult to parse causality within the present study design. To understand better the nature of maturational trajectories and possible compensatory mechanisms in psychosis, multi-modal longitudinal studies, specifically those that collect EEG and structural MRI data, of individuals at risk are needed.
In line with some other studies, we did not observe a significant difference in FA or LPS when comparing CHR-P with CHR-NP (Carletti et al. Citation2012; Perez et al. Citation2013). In contrast, differences in FA (Bloemen et al. Citation2010) and LPS (Ramyead et al. Citation2015) between converters and non-converters have been shown previously. Interestingly, Nägele et al. (Citation2021) report differences between CHR-P and CHR-NP in several white matter regions in a cohort that includes the subjects of this study. We believe that the divergence in this study is potentially due to methodological differences. In contrast to our tractography-based approach of a priori defined tracts, Nägele and colleagues (Citation2021) used a voxel-based whole-brain analytic approach.
Limitations and future directions
The present study is limited by the relatively small sample size, especially when subdividing the CHR-P and CHR-NP subjects, which may account for the lack of significant results in several analyses. Additionally, the HC group was relatively small. However, the groups were well matched regarding demographic and clinical characteristics and the effect sizes were robust for results with trend level significance. Moreover, the analyses were controlled for age, sex, and education years, and there was no observed influence of medication on our outcome variables. Differences between other dMRI studies of CHR populations and ours could potentially arise from deviations in CHR criteria. While the SOPS and Comprehensive Assessment of At-Risk Mental State (CAARMS) are commonly used to identify CHR subjects (Wang et al. Citation2016; Tang et al. Citation2019), this study utilised the German Research Network on Schizophrenia (GRNS) (Wölwer et al. Citation2006) criteria, that additionally allow for at least two subjective cognitive or perceptual disturbances. Furthermore, our sample of CHR subjects exhibited less severe symptoms than CHR populations in several of the respective studies (Karlsgodt et al. Citation2009; Saito et al. Citation2017; Tang et al. Citation2019).
The lack of identification of differences between future converters and non-converters in the current study might be related to the sample size or the length of the follow-up period, which was comparably short (15.6 months). For this reason, longitudinal studies with more, and preferably medication-free subjects, are needed to stratify the risk of conversion through white matter microstructure and functional connectivity.
Moreover, future assessment of the influence of psychiatric comorbidities on structural and functional connectivity will be important, as this is an inherent limitation of studies investigating individuals at CHR. While our study did not offer enough power to further subdivide the CHR group into individuals with and without varying comorbidities, studies with a sufficient number of individuals are needed to establish whether or not comorbidities affect structural and functional connectivity.
Furthermore, future studies should shift from the conversion to psychosis as the only outcome measure to focus on the long-term functionality. Recent findings suggest that anatomical structure could predict the long-term outcome of CHR subjects independent of conversion status (Reniers et al. Citation2016; Di Biase et al. Citation2021). Thus, the assumption that conversion to psychosis determines the long-term functionality of individuals is an area of active investigation.
Conclusion
The present study shows alterations in the auditory network in individuals at CHR for psychosis. This finding corroborates the idea of structural and functional dysconnectivity as a significant pathological underpinning of psychosis and the CHR state. Importantly, we observed decoupling of structural and functional connectivity in CHR subjects, which was absent in HC. Reliably identifying CHR subjects will allow for early and targeted treatment to have a more significant impact on the long-term outcome of psychosis (Keshavan et al. Citation2010; Fusar-Poli et al. Citation2017), which is possibly independent of the clinical conversion status.
Statement of interest
The authors have declared that there are no conflicts of interest in relation to the subject of this study.
Supplementary Material
Download MS Word (14.6 KB)Acknowledgments
Sincere thanks are given to all participants for their contribution to the study. This work is part of Mina Langhein’s doctoral dissertation at the Faculty of Medicine, University of Hamburg, Hamburg, Germany.
Additional information
Funding
References
- Addington J, Cornblatt BA, Cadenhead KS, Cannon TD, McGlashan TH, Perkins DO, Seidman LJ, Tsuang MT, Walker EF, Woods SW, et al. 2011. At clinical high risk for psychosis: outcome for nonconverters. Am J Psychiatry. 168(8):800–805. eng.
- Addington J, Liu L, Buchy L, Cadenhead KS, Cannon TD, Cornblatt BA, Perkins DO, Seidman LJ, Tsuang MT, Walker EF, et al. 2015. North American Prodrome Longitudinal Study (NAPLS 2): the prodromal symptoms. J Nerv Ment Dis. 203(5):328–335. eng.
- Assaf Y, Pasternak O. 2008. Diffusion Tensor Imaging (DTI)-based white matter mapping in brain research: a review. J Mol Neurosci. 34(1):51–61.
- Billah T, Bouix S, Rathi Y. 2019. Various MRI conversion tools. https://githubcom/pnlbwh/conversion.
- Bloemen OJN, de Koning MB, Schmitz N, Nieman DH, Becker HE, de Haan L, Dingemans P, Linszen DH, van Amelsvoort TAMJ. 2010. White-matter markers for psychosis in a prospective ultra-high-risk cohort. Psychol Med. 40(8):1297–1304.
- Boos HBM, Mandl RCW, van Haren NEM, Cahn W, van Baal GCM, Kahn RS, Hulshoff Pol HE. 2013. Tract-based diffusion tensor imaging in patients with schizophrenia and their non-psychotic siblings. Eur Neuropsychopharmacol. 23(4):295–304.
- Carletti F, Woolley JB, Bhattacharyya S, Perez-Iglesias R, Fusar Poli P, Valmaggia L, Broome MR, Bramon E, Johns L, Giampietro V, et al. 2012. Alterations in white matter evident before the onset of psychosis. Schizophr Bull. 38(6):1170–1179. eng.
- Catani M, Thiebaut de Schotten M. 2008. A diffusion tensor imaging tractography atlas for virtual in vivo dissections. Cortex. 44(8):1105–1132.
- Cetin-Karayumak S, Di Biase MA, Chunga N, Reid B, Somes N, Lyall AE, Kelly S, Solgun B, Pasternak O, Vangel M, et al. 2020. White matter abnormalities across the lifespan of schizophrenia: a harmonized multi-site diffusion MRI study. Mol Psychiatry. 25(12):3208–3219.
- Clayson PE, Miller GA. 2017. Psychometric considerations in the measurement of event-related brain potentials: guidelines for measurement and reporting. Int J Psychophysiol. 111:57–67.
- Ćurčić-Blake B, Ford JM, Hubl D, Orlov ND, Sommer IE, Waters F, Allen P, Jardri R, Woodruff PW, David O, et al. 2017. Interaction of language, auditory and memory brain networks in auditory verbal hallucinations. Prog Neurobiol. 148:1–20. eng.
- Ćurčić-Blake B, Nanetti L, van der Meer L, Cerliani L, Renken R, Pijnenborg GHM, Aleman A. 2015. Not on speaking terms: hallucinations and structural network disconnectivity in schizophrenia. Brain Struct Funct. 220(1):407–418.
- Curic S, Leicht G, Thiebes S, Andreou C, Polomac N, Eichler IC, Eichler L, Zöllner C, Gallinat J, Steinmann S, et al. 2019. Reduced auditory evoked gamma-band response and schizophrenia-like clinical symptoms under subanesthetic ketamine. Neuropsychopharmacology. 44(7):1239–1246. eng.
- Del Re EC, Bouix S, Fitzsimmons J, Blokland GAM, Mesholam-Gately RI, Wojcik J, Kikinis Z, Kubicki M, Petryshen TL, Pasternak O, et al. 2019. Diffusion abnormalities in the corpus callosum in first episode schizophrenia: associated with enlarged lateral ventricles and symptomatology. Psychiatry Res. 277:45–51.
- Di Biase MA, Cetin-Karayumak S, Lyall AE, Zalesky A, Cho KIK, Zhang F, Kubicki M, Rathi Y, Lyons MG, Bouix S, et al. 2021. White matter changes in psychosis risk relate to development and are not impacted by the transition to psychosis. Mol Psychiatry. 26(11):6833–6844. eng.
- Di Biase MA, Cropley VL, Cocchi L, Fornito A, Calamante F, Ganella EP, Pantelis C, Zalesky A. 2019. Linking cortical and connectional pathology in schizophrenia. Schizophr Bull. 45(4):911–923.
- Domen PAE, Michielse S, Gronenschild E, Habets P, Roebroeck A, Schruers K, van Os J, Marcelis M. 2013. Microstructural white matter alterations in psychotic disorder: a family-based diffusion tensor imaging study. Schizophr Res. 146(1-3):291–300.
- Edgar JC, Chen Y-H, Lanza M, Howell B, Chow VY, Heiken K, Liu S, Wootton C, Hunter MA, Huang M, et al. 2014. Cortical thickness as a contributor to abnormal oscillations in schizophrenia? Neuroimage Clin. 4:122–129. eng.
- Engel AK, Fries P, Singer W. 2001. Dynamic predictions: oscillations and synchrony in top–down processing. Nat Rev Neurosci. 2(10):704–716.
- Fedorov A, Beichel R, Kalpathy-Cramer J, Finet J, Fillion-Robin J-C, Pujol S, Bauer C, Jennings D, Fennessy F, Sonka M, et al. 2012. 3D Slicer as an image computing platform for the Quantitative Imaging Network. Magn Reson Imaging. 30(9):1323–1341. eng.
- Fries P. 2005. A mechanism for cognitive dynamics: neuronal communication through neuronal coherence. Trends Cogn Sci. 9(10):474–480.
- Fusar-Poli P, McGorry PD, Kane JM. 2017. Improving outcomes of first-episode psychosis: an overview. World Psychiatry. 16(3):251–265. eng.
- Gong S, Zhang F, Norton I, Essayed WI, Unadkat P, Rigolo L, Pasternak O, Rathi Y, Hou L, Golby AJ, et al. 2018. Free water modeling of peritumoral edema using multi-fiber tractography: application to tracking the arcuate fasciculus for neurosurgical planning. PLoS One. 13(5):e0197056. eng.
- Haaf M, Curic S, Steinmann S, Rauh J, Leicht G, Mulert C. 2022. Glycine attenuates impairments of stimulus-evoked gamma oscillations in the ketamine model of schizophrenia. Neuroimage. 251:119004. eng.
- Helfrich RF, Knepper H, Nolte G, Sengelmann M, König P, Schneider TR, Engel AK. 2016. Spectral fingerprints of large-scale cortical dynamics during ambiguous motion perception. Hum Brain Mapp. 37(11):4099–4111.
- Holleran L, Ahmed M, Anderson-Schmidt H, McFarland J, Emsell L, Leemans A, Scanlon C, Dockery P, McCarthy P, Barker GJ, et al. 2014. Altered interhemispheric and temporal lobe white matter microstructural organization in severe chronic schizophrenia. Neuropsychopharmacology. 39(4):944–954. eng.
- Hoptman MJ, Nierenberg J, Bertisch HC, Catalano D, Ardekani BA, Branch CA, DeLisi LE. 2008. A DTI study of white matter microstructure in individuals at high genetic risk for schizophrenia. Schizophr Res. 106(2–3):115–124.
- Jenkinson M, Bannister P, Brady M, Smith S. 2002. Improved optimization for the robust and accurate linear registration and motion correction of brain images. Neuroimage. 17(2):825–841.
- Jones DK, Knösche TR, Turner R. 2013. White matter integrity, fiber count, and other fallacies: the do’s and don’ts of diffusion MRI. Neuroimage. 73:239–254.
- Karlsgodt KH, Niendam TA, Bearden CE, Cannon TD. 2009. White matter integrity and prediction of social and role functioning in subjects at ultra-high risk for psychosis. Biol Psychiatry. 66(6):562–569. eng.
- Kay SR, Fiszbein A, Opler LA. 1987. The Positive and Negative Syndrome Scale (PANSS) for schizophrenia. Schizophr Bull. 13(2):261–276.
- Keshavan MS, Shrivastava A, Gangadhar BN. 2010. Early intervention in psychotic disorders: challenges and relevance in the Indian context. Indian J Psychiatry. 52(Suppl 1):S153–S158. eng.
- Kim S, Jang S-K, Kim D-W, Shim M, Kim Y-W, Im C-H, Lee S-H. 2019. Cortical volume and 40-Hz auditory-steady-state responses in patients with schizophrenia and healthy controls. Neuroimage Clin. 22:101732.
- Kim SN, Park JS, Jang JH, Jung WH, Shim G, Park HY, Hwang JY, Choi C-H, Kang D-H, Lee J-M, et al. 2012. Increased white matter integrity in the corpus callosum in subjects with high genetic loading for schizophrenia. Prog Neuropsychopharmacol Biol Psychiatry. 37(1):50–55.
- Knöchel C, O’Dwyer L, Alves G, Reinke B, Magerkurth J, Rotarska-Jagiela A, Prvulovic D, Hampel H, Linden DEJ, Oertel-Knöchel V. 2012. Association between white matter fiber integrity and subclinical psychotic symptoms in schizophrenia patients and unaffected relatives. Schizophr Res. 140(1-3):129–135.
- Kochunov P, Glahn DC, Rowland LM, Olvera RL, Winkler A, Yang Y-H, Sampath H, Carpenter WT, Duggirala R, Curran J, et al. 2013. Testing the hypothesis of accelerated cerebral white matter aging in schizophrenia and major depression. Biol Psychiatry. 73(5):482–491. eng.
- Kochunov P, Hong LE. 2014. Neurodevelopmental and neurodegenerative models of schizophrenia: white matter at the center stage. Schizophr Bull. 40(4):721–728.
- Leicht G, Andreou C, Polomac N, Lanig C, Schöttle D, Lambert M, Mulert C. 2015. Reduced auditory evoked gamma band response and cognitive processing deficits in first episode schizophrenia. World J Biol Psychiatry. 16(6):387–397.
- Leicht G, Björklund J, Vauth S, Mußmann M, Haaf M, Steinmann S, Rauh J, Mulert C. 2021. Gamma-band synchronisation in a frontotemporal auditory information processing network. Neuroimage. 239:118307. eng.
- Leicht G, Karch S, Karamatskos E, Giegling I, Möller H-J, Hegerl U, Pogarell O, Rujescu D, Mulert C. 2011. Alterations of the early auditory evoked gamma-band response in first-degree relatives of patients with schizophrenia: hints to a new intermediate phenotype. J Psychiatr Res. 45(5):699–705. eng.
- Leicht G, Kirsch V, Giegling I, Karch S, Hantschk I, Möller H-J, Pogarell O, Hegerl U, Rujescu D, Mulert C. 2010. Reduced early auditory evoked gamma-band response in patients with schizophrenia. Biol Psychiatry. 67(3):224–231. eng.
- Leicht VS, Polomac N, Andreou C, Rauh J, Mußmann M, Karow A, Mulert C. 2016. EEG-informed fMRI reveals a disturbed gamma-band-specific network in subjects at high risk for psychosis. Schizophr Bull. 42(1):239–249. eng.
- Lepock JR, Ahmed S, Mizrahi R, Gerritsen CJ, Maheandiran M, Drvaric L, Bagby RM, Korostil M, Light GA, Kiang M. 2020. Relationships between cognitive event-related brain potential measures in patients at clinical high risk for psychosis. Schizophr Res. 226:84–94.
- Lienhard S, Malcolm JG, Westin C-F, Rathi Y. 2011. A full bi-tensor neural tractography algorithm using the unscented Kalman filter. EURASIP J Adv Signal Process. 2011:77. eng.
- Malcolm JG, Shenton ME, Rathi Y. 2009. Neural tractography using an unscented Kalman filter. Inf Process Med Imaging. 21:126–138. eng.
- Mamah D, Ji A, Rutlin J, Shimony JS. 2019. White matter integrity in schizophrenia and bipolar disorder: tract- and voxel-based analyses of diffusion data from the Connectom scanner. Neuroimage Clin. 21:101649–101649. eng.
- Meier J, Nolte G, Schneider TR, Engel AK, Leicht G, Mulert C. 2019. Intrinsic 40Hz-phase asymmetries predict tACS effects during conscious auditory perception. PLoS One. 14(4):e0213996.
- Miller TJ, McGlashan TH, Rosen JL, Cadenhead K, Cannon T, Ventura J, McFarlane W, Perkins DO, Pearlson GD, Woods SW. 2003. Prodromal assessment with the structured interview for prodromal syndromes and the scale of prodromal symptoms: predictive validity, interrater reliability, and training to reliability. Schizophr Bull. 29(4):703–715.
- Mori S, Zhang J. 2006. Principles of diffusion tensor imaging and its applications to basic neuroscience research. Neuron. 51(5):527–539.
- Mueser KT, McGurk SR. 2004. Schizophrenia. Lancet. 363(9426):2063–2072.
- Mulert C, Kirsch V, Whitford TJ, Alvarado J, Pelavin P, McCarley RW, Kubicki M, Salisbury DF, Shenton ME. 2012. Hearing voices: a role of interhemispheric auditory connectivity? World J Biol Psychiatry. 13(2):153–158. eng.
- Mulert C, Gallinat J, Pascual-Marqui R, Dorn H, Frick K, Schlattmann P, Mientus S, Herrmann WM, Winterer G. 2001. Reduced event-related current density in the anterior cingulate cortex in schizophrenia. Neuroimage. 13(4):589–600.
- Mulert C, Leicht G, Hepp P, Kirsch V, Karch S, Pogarell O, Reiser M, Hegerl U, Jäger L, Moller HJ, et al. 2010. Single-trial coupling of the gamma-band response and the corresponding BOLD signal. Neuroimage. 49(3):2238–2247.
- Mulert C, Leicht G, Pogarell O, Mergl R, Karch S, Juckel G, Möller H-J, Hegerl U. 2007. Auditory cortex and anterior cingulate cortex sources of the early evoked gamma-band response: relationship to task difficulty and mental effort. Neuropsychologia. 45(10):2294–2306.
- Nägele FL, Pasternak O, Bitzan LV, Mußmann M, Rauh J, Kubicki M, Leicht G, Shenton ME, Lyall AE, Mulert C. 2021. Cellular and extracellular white matter alterations indicate conversion to psychosis among individuals at clinical high-risk for psychosis. World J Biol Psychiatry. 22(3):214–227.
- Nolte G, Bai O, Wheaton L, Mari Z, Vorbach S, Hallett M. 2004. Identifying true brain interaction from EEG data using the imaginary part of coherency. Clin Neurophysiol. 115(10):2292–2307.
- O’Donnell LJ, Suter Y, Rigolo L, Kahali P, Zhang F, Norton I, Albi A, Olubiyi O, Meola A, Essayed WI, et al. 2017. Automated white matter fiber tract identification in patients with brain tumors. Neuroimage Clin. 13:138–153.
- Owen MJ, Sawa A, Mortensen PB. 2016. Schizophrenia. Lancet. 388(10039):86–97.
- Pascual-Marqui RD, Lehmann D, Koukkou M, Kochi K, Anderer P, Saletu B, Tanaka H, Hirata K, John ER, Prichep L, et al. 2011. Assessing interactions in the brain with exact low-resolution electromagnetic tomography. Philos Trans A Math Phys Eng Sci. 369(1952):3768–3784.
- Pascual-Marqui RD. 2007a. Discrete, 3D distributed, linear imaging methods of electric neuronal activity. Part 1: exact, zero error localization. arXiv:07103341 [math-ph] http://arxivorg/pdf/07103341.
- Pascual-Marqui RD. 2007b. Instantaneous and lagged measurements of linear and nonlinear dependence between groups of multivariate time series: frequency decomposition. arXiv:07111455 [statME] http://arxivorg/abs/07111455.
- Pasternak O, Sochen N, Gur Y, Intrator N, Assaf Y. 2009. Free water elimination and mapping from diffusion MRI. Magn Reson Med. 62(3):717–730.
- Perez VB, Roach BJ, Woods SW, Srihari VH, McGlashan TH, Ford JM, Mathalon DH. 2013. Early auditory gamma-band responses in patients at clinical high risk for schizophrenia. Suppl Clin Neurophysiol. 62:147–162. eng.
- Peters BD, de Haan L, Dekker N, Blaas J, Becker HE, Dingemans PM, Akkerman EM, Majoie CB, van Amelsvoort T, den Heeten GJ, et al. 2008. White matter fibertracking in first-episode schizophrenia, schizoaffective patients and subjects at ultra-high risk of psychosis. Neuropsychobiology. 58(1):19–28.
- Peters BD, Dingemans PM, Dekker N, Blaas J, Akkerman E, van Amelsvoort TA, Majoie CB, den Heeten GJ, Linszen DH, de Haan L. 2010. White matter connectivity and psychosis in ultra-high-risk subjects: a diffusion tensor fiber tracking study. Psychiatry Res Neuroimaging. 181(1):44–50.
- Pierpaoli C, Basser PJ. 1996. Toward a quantitative assessment of diffusion anisotropy. Magn Reson Med. 36(6):893–906. eng.
- Polomac N, Leicht G, Nolte G, Andreou C, Schneider TR, Steinmann S, Engel AK, Mulert C. 2015. Generators and connectivity of the early auditory evoked gamma band response. Brain Topogr. 28(6):865–878.
- Ramyead A, Kometer M, Studerus E, Koranyi S, Ittig S, Gschwandtner U, Fuhr P, Riecher-Rössler A. 2015. Aberrant current source-density and lagged phase synchronization of neural oscillations as markers for emerging psychosis. Schizophr Bull. 41(4):919–929.
- Reilly TJ, Nottage JF, Studerus E, Rutigliano G, Micheli AID, Fusar-Poli P, McGuire P. 2018. Gamma band oscillations in the early phase of psychosis: a systematic review. Neurosci Biobehav Rev. 90:381–399.
- Reniers RLEP, Lin A, Yung AR, Koutsouleris N, Nelson B, Cropley VL, Velakoulis D, McGorry PD, Pantelis C, Wood SJ. 2016. Neuroanatomical predictors of functional outcome in individuals at ultra-high risk for psychosis. Schizophr Bull. 43(2):449–458.
- Saito J, Hori M, Nemoto T, Katagiri N, Shimoji K, Ito S, Tsujino N, Yamaguchi T, Shiraga N, Aoki S, et al. 2017. Longitudinal study examining abnormal white matter integrity using a tract-specific analysis in individuals with a high risk for psychosis. Psychiatry Clin Neurosci. 71(8):530–541.
- Schmidt A, Lenz C, Smieskova R, Harrisberger F, Walter A, Riecher-Rössler A, Simon A, Lang UE, McGuire P, Fusar-Poli P, et al. 2015. Brain diffusion changes in emerging psychosis and the impact of state-dependent psychopathology. Neurosignals. 23(1):71–83. eng.
- Sheehan DV, Lecrubier Y, Sheehan KH, Amorim P, Janavs J, Weiller E, Hergueta T, Baker R, Dunbar GC. 1998. The Mini-International Neuropsychiatric Interview (M.I.N.I): the development and validation of a structured diagnostic psychiatric interview for DSM-IV and ICD-10. J Clin Psychiatry. 59:22–33.
- Stam CJ, Nolte G, Daffertshofer A. 2007. Phase lag index: assessment of functional connectivity from multi channel EEG and MEG with diminished bias from common sources. Hum Brain Mapp. 28(11):1178–1193.
- Steinmann S, Leicht G, Ertl M, Andreou C, Polomac N, Westerhausen R, Friederici AD, Mulert C. 2014. Conscious auditory perception related to long-range synchrony of gamma oscillations. Neuroimage. 100:435–443. eng.
- Steinmann S, Lyall AE, Langhein M, Nägele FL, Rauh J, Cetin-Karayumak S, Zhang F, Mussmann M, Billah T, Makris N, et al. 2021. Sex-related differences in white matter asymmetry and its implications for verbal working memory in psychosis high-risk state. Front Psychiatry. 12(686967):686967. eng.
- Tada M, Nagai T, Kirihara K, Koike S, Suga M, Araki T, Kobayashi T, Kasai K. 2016. Differential alterations of auditory gamma oscillatory responses between pre-onset high-risk individuals and first-episode schizophrenia. Cereb Cortex. 26(3):1027–1035.
- Tang Y, Pasternak O, Kubicki M, Rathi Y, Zhang T, Wang J, Li H, Woodberry KA, Xu L, Qian Z, et al. 2019. Altered cellular white matter but not extracellular free water on diffusion MRI in individuals at clinical high risk for psychosis. Am J Psychiatry. 176(10):820–828.
- Tiitinen HT, Sinkkonen J, Reinikainen K, Alho K, Lavikainen J, Näätänen R. 1993. Selective attention enhances the auditory 40-Hz transient response in humans. Nature. 364(6432):59–60.
- van den Heuvel MP, Fornito A. 2014. Brain networks in schizophrenia. Neuropsychol Rev. 24(1):32–48.
- van den Heuvel MP, Sporns O, Collin G, Scheewe T, Mandl RCW, Cahn W, Goñi J, Hulshoff Pol HE, Kahn RS. 2013. Abnormal rich club organization and functional brain dynamics in schizophrenia. JAMA Psychiatry. 70(8):783–792.
- von Hohenberg CC, Pasternak O, Kubicki M, Ballinger T, Vu M-A, Swisher T, Green K, Giwerc M, Dahlben B, Goldstein JM, et al. 2014. White matter microstructure in individuals at clinical high risk of psychosis: a whole-brain diffusion tensor imaging study. Schizophr Bull. 40(4):895–903. eng.
- Wang C, Ji F, Hong Z, Poh JS, Krishnan R, Lee J, Rekhi G, Keefe RSE, Adcock RA, Wood SJ, et al. 2016. Disrupted salience network functional connectivity and white-matter microstructure in persons at risk for psychosis: findings from the LYRIKS study. Psychol Med. 46(13):2771–2783. eng.
- Wigand M, Kubicki M, Clemm von Hohenberg C, Leicht G, Karch S, Eckbo R, Pelavin PE, Hawley K, Rujescu D, Bouix S, et al. 2015. Auditory verbal hallucinations and the interhemispheric auditory pathway in chronic schizophrenia. World J Biol Psychiatry. 16(1):31–44. eng.
- Wölwer W, Baumann A, Bechdolf A, Buchkremer G, Häfner H, Janssen B, Klosterkötter J, Maier W, Möller H-J, Ruhrmann S, et al. 2006. The German Research Network on Schizophrenia–impact on the management of schizophrenia. Dialogues Clin Neurosci. 8(1):115–121. eng.
- Wu C-H, Hwang T-J, Chen Y-J, Hsu Y-C, Lo Y-C, Liu C-M, Hwu H-G, Liu C-C, Hsieh MH, Chien YL, et al. 2015. Altered integrity of the right arcuate fasciculus as a trait marker of schizophrenia: a sibling study using tractography-based analysis of the whole brain. Hum Brain Mapp. 36(3):1065–1076.
- Zekelman LR, Zhang F, Makris N, He J, Chen Y, Xue T, Liera D, Drane DL, Rathi Y, Golby AJ, et al. 2022. White matter association tracts underlying language and theory of mind: an investigation of 809 brains from the Human Connectome Project. Neuroimage. 246:118739.
- Zhang F, Savadjiev P, Cai W, Song Y, Rathi Y, Tunç B, Parker D, Kapur T, Schultz RT, Makris N, et al. 2018. Whole brain white matter connectivity analysis using machine learning: an application to autism. Neuroimage. 172:826–837.
- Zhang F, Wu Y, Norton I, Rigolo L, Rathi Y, Makris N, O’Donnell LJ. 2018. An anatomically curated fiber clustering white matter atlas for consistent white matter tract parcellation across the lifespan. Neuroimage. 179:429–447.
- Zhuo C, Liu M, Wang L, Tian H, Tang J. 2016. Diffusion tensor MR imaging evaluation of callosal abnormalities in schizophrenia: a meta-analysis. PLoS One. 11(8):e0161406. eng.