
 ?Mathematical formulae have been encoded as MathML and are displayed in this HTML version using MathJax in order to improve their display. Uncheck the box to turn MathJax off. This feature requires Javascript. Click on a formula to zoom.
Abstract
To provide scientific support for improvements in land surface modeling on the Tibetan Plateau (TP) by reducing uncertainties in the physical parameters of models, comprehensive uncertainty and sensitivity evaluations were performed for the simulation of surface soil moisture (SSM). Five observational stations were selected for the study. The conditional nonlinear optimal perturbation related to parameters (CNOP-P) approach and the Common Land Model (CoLM) with 28 uncertain parameters were employed to evaluate the maximal uncertainty of the simulated SSM. The uncertainty analysis indicated that the parameter errors could induce large uncertainties. These uncertainties in the SSM generally fluctuated over the range from 0.33 to 0.64 m3 m−3 in terms of absolute changes and from 235% to 510% in terms of percentage changes. The uncertainty analysis addressed the necessity of decreasing the uncertainties in the parameters. When resources are limited, the most important and sensitive parameter set should first be identified in order to reduce uncertainties. To find this parameter set, a sensitivity analysis framework based on the CNOP-P approach was applied. The results showed that the most sensitive and important combinations of 4 parameters changed slightly among the study sites and consisted of soil texture-related parameters. Although the most sensitive and important parameter combinations only had 4 elements, the uncertainties that they could induce accounted for a large proportion of the uncertainties caused by all 28 uncertain parameters. Furthermore, the decreases in parameter errors, which were derived from the CNOP-Ps of the most sensitive and important parameter combinations, led to the maximal reductions in the uncertainties of the simulated SSM. The above results imply that we should prioritize reducing the uncertainty of sensitive parameters or parameter combinations in order to improve prediction and simulation abilities.
1. Introduction
It has been widely accepted that land surface processes can have significant impacts on the climate through vegetation, soil moisture, surface albedo, and surface roughness (Sud and Smith, Citation1985; Seneviratne et al., Citation2010; Huang et al., Citation2011; Zhang and Zuo, Citation2011; Liu et al., Citation2017). Apart from in situ observations, land surface models (LSMs), which are designed to simulate the exchanges of momentum, energy and mass between the land surface and the atmosphere, are also vital tools for comprehensively understanding land surface processes and their interactions with the atmosphere. As indispensable components of numerical weather and climate models, LSMs supply the necessary lower boundary conditions required by atmospheric models, which exert an important influence on weather forecasting and climate predictions (Crossley et al., Citation2000; Pitman, Citation2003; Kumar et al., Citation2014; MacLeod et al., Citation2016; Orth et al., Citation2016). However, extensive studies have demonstrated that there are still great uncertainties in the simulations of current LSMs, especially in regions with complex terrain and sparse vegetation (Yang et al., Citation2009; Chen et al., Citation2012; Zhang et al., Citation2014).
Model parameter uncertainties can lead to great differences between the model simulations in LSMs and observations (Gupta et al., Citation1999; Jackson et al., Citation2003; Xie et al., Citation2007; Rosolem et al., Citation2013). In order to remove uncertainties in parameters, many researchers have focused on parameter estimations by means of data assimilation or calibration methods to improve model simulations (Xia et al., Citation2004; Vrugt et al., Citation2006; Rosolem et al., Citation2013; Shi et al., Citation2015; Zhang et al., Citation2017a). Moreover, at present, the applications of traditional assimilation methods (such as the three-dimensional variational assimilation method, 3DVAR, and the ensemble Kalman filter, EnKF) to land surface assimilation are limited. The 3DVAR method faces the challenges of the derivations of tangent linear models or adjoint equations. A primary drawback of the EnKF is filter inbreeding caused by the underestimations of forecast errors. To overcome this, inflation techniques need to be applied (Zhang et al., Citation2017b; Bauser et al., Citation2018). For example, Zhang et al. (Citation2017b) employed the EnKF with a multiplicative inflation algorithm to estimate both parameters and state variables from two LSMs and reported improved model performance in the calibration and evaluation period.
With the inclusion of more complex and sophisticated parameterization schemes, LSMs often have a large number of parameters (o(10)-o(100)). Due to the limitations of optimization algorithms and computational resources, it is impractical to implement parameter estimation for all model parameters. Moreover, model performance is not critically sensitive to all parameters (e.g., Gupta et al., Citation1999; Li et al., Citation2013; Gan et al., Citation2015; Zhang et al., Citation2017a). As a result, parameters that have the most influence on model simulations should first be discerned to reduce the dimensionality of the parameter estimation problems. Sensitivity analysis (SA), which aims to identify the importance and sensitivity of model parameters by evaluating the influence of perturbations in parameters on the model output(s) of interest, has been widely used for this purpose. SA is helpful in providing guidance for parameter estimation efforts and, ultimately, in supplying scientific guidance for improving LSMs through more accurate parameter values.
Numerous SA approaches exist for LSMs. For example, the OAT (one-at-a-time) method, in which each parameter is changed independently and its impact on model performance is analyzed, was employed to evaluate the sensitivity of parameters from the Biosphere-Atmosphere Transfer Scheme model (Pitman, Citation1994). Bastidas et al. (Citation2006) applied the multiobjective generalized sensitivity analysis algorithm to explore the parameter sensitivities of 5 LSMs with different levels of complexity and reported that the sensitivities of parameters with similar physical meanings across different LSMs were closely related to the model structures and locations. Gan et al. (Citation2015) used Latin hypercube-based OAT screening and multivariate adaptive regression splines (MARS)-based Sobol sensitivity indices to examine the sensitivities of 24 model parameters in the Conjunctive Surface-Subsurface Process (CSSP) LSM for 18 representative watersheds in the contiguous United States. They found that 10 of the 24 parameters were identified as important across different watersheds. In addition, there are numerous other SA approaches for land surface modeling. However, few studies have explored the sensitivity of parameter sets with specified number of members. To identify the sensitive parameter set, Sun and Mu (Citation2017) proposed an approach for identifying important and sensitive parameter combinations based on the conditional nonlinear optimal perturbation related to parameters (CNOP-P) approach (Mu et al., Citation2010), which could reflect the effects of nonlinear interactions among parameters. Furthermore, they employed three steps built on the CNOP-P method to determine the sensitivities of parameter combinations for net primary production (NPP) simulated by the Lund-Potsdam-Jena (LPJ) model and confirmed the key role of nonlinear interactions among parameters in identifying sensitive parameters in the arid and semiarid regions of China. To identify the sensitive parameter sets of LSMs, it is worthwhile to apply the SA approach developed by Sun and Mu (Citation2017).
As the highest plateau on Earth, the Tibetan Plateau (TP) is a region with complex topography and strong land-atmosphere interactions. However, primarily due to model error, TP land surface processes are not yet well represented by the current LSMs (Li et al., Citation2012; Gao et al., Citation2015; Xie et al., Citation2017, Yang et al., Citation2009). For instance, Yang et al. (Citation2009) evaluated the performance of three LSMs for TP land surfaces: the Simple Biosphere scheme (SiB), the Common Land Model (CoLM) and the Noah LSM. They found that all of the models significantly underestimated the soil moisture in the topsoil in the central and eastern TP owing to soil stratification and considerably underpredicted the ground-air temperature gradients for the western TP alpine deserts due to the underestimation or neglect of the excess resistance to heat transfer. By applying the optimized soil parameters and adjusted soil layers in the CoLM, Li et al. (Citation2012) made an obvious improvement to soil moisture simulations at three observational stations on the TP. Gao et al. (Citation2015) reported that at the Amdo (i.e., AnDuo) site, located on the central TP, the default Noah-MP (the Noah LSM with multiparameterization options) underestimated the topsoil moisture by approximately 50%. These uncertainties in land surface modeling on the TP inevitably have an important impact on the numerical weather predictions and climate simulations associated with TP-elevated heating and circulation (Duan et al., Citation2013; Gao et al., Citation2017; Wang et al., Citation2018). It is important to improve land surface modeling over the TP. From previous studies, it can be observed that model parameter errors lead to simulation uncertainties on the TP (van der Velde et al., Citation2009; Li et al., Citation2012). If these uncertainties are substantial, it is necessary to reduce uncertainties in model parameters and thereby improve model performance on the TP.
To provide scientific support for improvements in land surface modeling on the TP by reducing uncertainties in model parameters, it is necessary to conduct a comprehensive uncertainty and sensitivity analysis for LSMs to determine the relatively important parameters. For this purpose, the extent of the uncertainty in land surface modeling that is due to model parameter errors is first investigated. If the uncertainty due to parameter errors is high, it is meaningful and useful to eliminate the uncertainties in those parameters. Then, based on the uncertainty analysis results, the relatively important and sensitive parameter combinations with a specified number of members that primarily contribute to the uncertainties in land surface modeling are identified by considering the nonlinear interactions among parameters using the sensitivity analysis framework presented in Sun and Mu (Citation2017). Finally, the reduction in the extent of uncertainty in land surface modeling is assessed by decreasing errors in the identified important and sensitive parameter combinations to reflect the effectiveness and value of the identified sensitive parameter combinations.
Over the TP, soil moisture is a crucial state variable for land-atmosphere interactions. It controls the partition of net radiation into sensible and latent heat, both of which are closely related to TP thermal forcing and have been demonstrated to exert significant impacts on the Asian monsoon and general circulation (e.g., Ye and Wu, Citation1998; Liu et al., Citation2012; Wu et al., Citation2017). As surface soil moisture (SSM; soil moisture in the top 10 cm of the soil layer) plays a key role in modulating the surface energy and water partition, we primarily focus on SSM modeling here. In addition, in this study, the Common Land Model (CoLM; Dai et al., Citation2003) is applied to conduct offline simulations of land surface processes. The CNOP-P approach (Mu et al., Citation2010), which determines the maximal uncertainties in numerical simulations within the reasonable range of parameter errors and considers the nonlinear interactions among parameters, is employed to conduct the uncertainty analysis and sensitivity evaluations for SSM.
2. Sites, model and data
2.1. Sites
To achieve sufficient representation of land surfaces throughout the entire TP, five sites in total were selected: AnDuo, Ms3478, Ms3637, GaiZe and ShiQuanHe (). Among these sites, three (i.e., AnDuo, Ms3478 and Ms3637) are wet alpine meadow sites in the central and eastern TP, whereas the other two (i.e., GaiZe and ShiQuanHe) are dry alpine desert sites in the western TP.
Table 1. Information about the study sites situated in the TP region.
2.2. The common land model (CoLM)
The CoLM is a land surface model developed by Dai et al. (Citation2003). It combines the best features of three successful land surface models: the Land Surface Model (Bonan, Citation1996), the Biosphere-Atmosphere Transfer Scheme (Dickinson et al., Citation1993), and the 1994 version of the Chinese Academy of Sciences/Institute of Atmospheric Physics LSM (Dai and Zeng, Citation1997). Biophysical, biochemical, ecological and hydrological processes are comprehensively described in the CoLM. In addition, energy and water transmissions among soil, vegetation, snow and the atmosphere are taken into account. To date, the CoLM has been applied to numerous offline tests by employing a variety of observational data, and the results have revealed that the model reasonably captures different land surface processes (Liu and Lin, Citation2005; Xin et al., Citation2006; Luo et al., Citation2008; Meng and Fu, Citation2009). Moreover, this model can be coupled with other earth system model components (Zeng et al., Citation2002). In this research, the CoLM was used to conduct uncoupled simulations.
In the CoLM, one vegetation layer along with up to five snow layers (determined by the total snow depth) are included, and the soil column has a fixed depth of 343.31 cm. The vertical discretization for soil has 10 layers with depths of 1.75 cm, 4.51 cm, 9.06 cm, 16.56 cm, 28.91 cm, 49.3 cm, 82.89 cm, 138.28 cm, 229.61 cm, and 343.31 cm, respectively. The soil water content within each layer is computed based on the water balance equation. Soil ice is computed separately. In each soil layer, the soil moisture is first updated based on the phase changes, including the melting of soil ice and the freezing of soil water, and then altered based on the net water input from the neighboring soil layer. The depth of the first three soil layers in the CoLM is 9.06 cm. Therefore, the SSM is calculated as the weighted average of the soil moisture in the first three soil layers based on soil layer thicknesses. For the surface soil layer, the net water input is mainly associated with soil ice, evapotranspiration (ET), surface runoff (Rsur) and the water transfer between the subsurface and surface soil layers. Here, the variations in soil moisture in the subsurface soil layer are used as an indicator of the water transfer between the subsurface and surface soil layers. In addition, the subsurface soil moisture is calculated as the weighted average of the soil moisture in soil layers 4-10 of the CoLM according to soil layer thicknesses. A decrease in subsurface soil moisture indicates water transfer from the subsurface to the surface soil layers, and an increase in subsurface soil moisture implies water transfer in the opposite direction.
2.3. Data
In situ data from the intensive observation period (May–September 1998) of the GAME-Tibet (GEWEX Asian Monsoon Experiment in the Tibetan Plateau; Koike et al., Citation1999) were used as the forcing dataset to drive the CoLM in an uncoupled run. Due to instances of missing data, different simulation periods were chosen at different sites ().
3. Methods and experimental design
3.1. Methods
3.1.1. The conditional nonlinear optimal perturbation related to parameters (CNOP-P) approach
The CNOP-P approach proposed by Mu et al. (Citation2010) is a nonlinear optimization method to identify a kind of parameter perturbation that satisfies some given constraints and results in the maximal simulation error at a target time. In addition, this type of parameter perturbation acquired by the CNOP-P approach is called CNOP-P. To date, the CNOP-P approach has been applied in studies on ENSO predictability (Yu et al., Citation2012), grassland ecosystems (Sun and Mu, Citation2011), terrestrial ecosystems (Sun and Mu, Citation2012, Citation2013, Citation2014), land surface hydrology (Peng et al., Citation2017; Sun et al., Citation2017a), and parameter sensitivity analyses of numerical models (Sun and Mu, Citation2017; Sun et al., Citation2017b).
The CNOP-P approach is described briefly here. A more detailed introduction to this method is presented in Mu et al. (Citation2010). We assume that the state variable U satisfies the nonlinear differential equations as follows:
(1)
(1)
where F represents a nonlinear operator, U0 represents the initial value of the state variable U, P represents the parameter vector, and Rn represents the n-dimensional real space. Let Mt be the propagator of the nonlinear differential equations above from the initial time 0 to t. Then, the solution at time t, U(t), satisfies U(t)=Mt (U0, P). A perturbation of the parameter vector P, denoted as p, is considered. Now, the solution of Eq. (1) is Mt (U0, P + p) and can be characterized by U(t)+u(t), where u(t)=Mt (U0, P + p)-Mt (U0, P) shows the change in the reference state U(t) due to p.
For a given time T and norm the perturbation
is a CNOP-P under the constraint condition
if and only if
(2)
(2)
where
(3)
(3)
Generally, p is the perturbation of the reference state for the parameter vector P and represents the parameter vector error. represents the feasible domain of the parameter perturbation p. In addition, the cost function J signifies the variation in magnitude of the reference state U (i.e., the simulation error of U) caused by the parameter vector error p. Accordingly, the CNOP-P is the kind of parameter perturbation that makes the cost function J at time T attain its maximum value. The cost function value with the CNOP-P represents the maximal variation magnitude of the reference state U (i.e., the maximal simulation error of U) due to parameter perturbations. In this study, this type of cost function value is interpreted as the maximal uncertainty extent in numerical simulations due to parameter errors.
As the cost function constructed in the CNOP-P approach (Eq. (3)) might be nondifferentiable with respect to the parameter(s) of the CoLM, an efficient and derivative-free method, the differential evolution (DE, Storn and Price, Citation1997) algorithm, was applied to calculate the CNOP-P and the cost function value with the CNOP-P (i.e., the maximum of the cost function).
3.1.2. Sensitivity analysis framework for the model parameter combination based on the CNOP-P approach
To identify the most important and sensitive parameter combinations with a specified number of members and take the nonlinear interactions among parameters into account, a new sensitivity analysis framework for screening sensitive parameter combinations was proposed by Sun and Mu (Citation2017) based on the CNOP-P approach. Generally, this framework includes three steps, as illustrated in , of which the last two steps are the key procedures.
Fig. 1. Sensitivity analysis framework for model parameter combinations based on the CNOP-P approach.
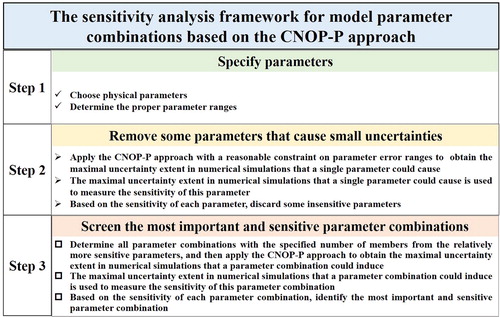
The first step is to specify the parameters. The principle is that these selected parameters should be obtained through direct or indirect observations. Here, we suppose that there are a total of n parameters to identify the sensitivity.
Given that not all parameters lead to large uncertainties in numerical simulations, the second step aims to remove some parameters that cause small uncertainties. To achieve this, the CNOP-P approach is employed. Through the CNOP-P approach with a reasonable constraint on parameter error ranges, the maximal uncertainty extent in numerical simulations that a single parameter could induce can be obtained. Then, this maximal uncertainty extent is used to measure the sensitivity of a single parameter. The greater the maximal uncertainty extent is, the more sensitive the corresponding parameter is. Then, according to the sensitivity rank for every parameter, the first m sensitive parameters, which are relatively more sensitive and important, are identified, where m < n.
In the third step, the sensitivity and importance of parameter combinations with a specified number of members (e.g., k) are evaluated to acquire the most significant and sensitive parameter combinations. From the identified m parameters in the second step, groups of parameter combinations with the member number of k can be determined. As in Step 2, for each parameter combination, the maximal uncertainty extent in numerical simulations due to errors from its parameter members can be acquired using the CNOP-P approach with a reasonable constraint on parameter error ranges. The greater the maximal uncertainty extent is, the more sensitive the corresponding parameter combination is. For the
parameter combinations, the most sensitive combination is identified as the most important and sensitive parameter combination. In the CNOP-P approach for this step, multiple parameters are perturbed simultaneously. Consequently, the impacts of nonlinear interactions among parameters are considered during the determination of the most important and sensitive parameter combination.
3.1.3. The approach for validating the importance of the most sensitive parameter combinations
To verify the identified most sensitive parameter combinations, a formula to measure the gains in reducing errors in parameter combinations is defined in this section. Inspired by the work of Mu et al. (Citation2009) which explored the improvements made in typhoon predictions by reducing the initial errors in sensitive regions, Sun and Mu (Citation2017) investigated the impacts of reduced uncertainties in different parameter combinations on simulations of the terrestrial ecosystem. Similar to Sun and Mu (Citation2017), the gain which describes the reduced extent of the uncertainty in the numerical simulation due to the reduced error of a tested parameter combination, is defined by the following formula:
(4)
(4)
Here, the meaning of each variable is as defined in Eq. (3). In addition, represents a tunable constant (
) used to characterize the reduced extent of the parameter error. Since
represents the simulation error caused by the considered parameter error p, and
represents the simulation error caused by the reduced parameter error
(
), then
characterizes the improvement in the numerical simulation due to the decrease in the parameter error p. The greater the value of
is, the larger the reduction in the extent of the simulation uncertainty will be.
3.2. Experimental design
For conducting the assessment of the uncertainty and sensitivity associated with SSM due to model parameters, 28 physical parameters were selected, as shown in . Both the 28 specific parameters and their ranges were chosen based on expert advice from model developers and existing research by Dai et al. (Citation2003), Li et al. (Citation2013), and Sun et al. (Citation2017b). To characterize the vertical soil heterogeneity in the CoLM, soil-related parameters were differentiated between topsoil and subsoil. The soil in the first five soil layers was classified as topsoil, and the soil in the lower five soil layers was classified as subsoil. At each site, SSM was taken as the state variable in the cost function of the CNOP-P approach. For every selected parameter, the reference state was its default value in the CoLM. The study period relevant to the CNOP-P method was the same as the simulation period noted in . Here, the target time T represents a period (i.e., the entire study period). The propagator at the target time T (i.e., MT) represents the SSM averaged over the entire study period. In calculating a CNOP-P, many parameter perturbation values were sampled. To satisfy the constraint in the CNOP-P approach that model parameter errors should lie within reasonable ranges, the perturbed parameter values for each tested parameter were guaranteed to lie between its minimum and maximum values, which are listed in . Moreover, in each model run, parameter perturbations were static during the entire simulated period. The obtained CNOP-P represented the type of parameter error that led to the maximal extent of uncertainty in the simulated SSM averaged over the entire study period. Hereafter, the parameter error derived from the computed CNOP-P was called the CNOP-P-type parameter error. Therefore, the CNOP-P-type parameter error would induce the maximal uncertainty extent in the simulated SSM, which was the maximum value of the cost function.
Table 2. The physical parameters and their default, minimum and maximum values for the TP sites in the CoLM. Def = Default value; Min = Minimum value; Max = Maximum Value.
From the above description, the number of all selected parameters, n, was 28. Because of the limitation on computational resources, m and k were set to 8 and 4, respectively. The values of both m and k can be appropriately augmented or reduced depending on the practical demands and the available computational resources. After specifying the values of m and k, the abovementioned sensitivity analysis framework based on the CNOP-P approach was accomplished step by step as follows. First, the 8 most sensitive physical parameters were chosen from the 28 parameters according to the sensitivity rank for a single parameter obtained by using the CNOP-P approach. Second, (70) groups of parameter combinations were determined. For each combination, its sensitivity was also determined by employing the CNOP-P approach. Among the
(70) parameter combinations, the 4-parameter combination that generated the largest cost function value was regarded as the most significant and sensitive parameter subset.
It should be noted that a model spin-up of 100 days at every site was first conducted by employing the forcing dataset for the first day of the simulation period repeatedly to run the CoLM. Then, the land surface conditions at the end of the spin-up process were saved and applied to initialize all the model runs involved in the optimization procedure for the CNOP-P approach.
In contrast, the traditional OAT approach (Pitman, Citation1994) was also employed to identify the sensitivity of a single parameter. The OAT approach focuses on the variation due to the representative perturbation value of a parameter. In essence, this method was performed based on the uncertainty extent of the numerical simulation caused by parameter errors. When the sensitivity of a certain parameter was evaluated, the other parameter values remained the same. Consequently, in the OAT method, the interactions among the parameters were neglected. In our research, the sensitivities based on this method were evaluated by fixing each parameter at its maximum and minimum values. The greater one of the two uncertainty extents in the simulated SSM, that were caused by the maximal and minimal parameter errors respectively, was used to determine the sensitivity of a single parameter.
4. Results and analyses
4.1. Uncertainties in SSM due to parameter uncertainties
As SSM was the state variable in the cost function of the CNOP-P approach, the maximal value of the cost function represented the maximal magnitude of the variation in the SSM reference state due to parameter errors. The maximal value of the cost function can be understood as the maximal uncertainty of the simulated SSM due to parameter errors. At this moment, the maximal uncertainty in SSM was demonstrated in the form of absolute changes. For each observation station, the reference state of SSM was fixed. Consequently, the CNOP-P-type parameter error also induced the maximal percentage magnitude change in SSM due to parameter errors and could illustrate the maximal uncertainty in the form of percentage change. In the following section, the maximal uncertainties related to SSM at all observational sites will be presented in terms of both absolute changes and percentage changes.
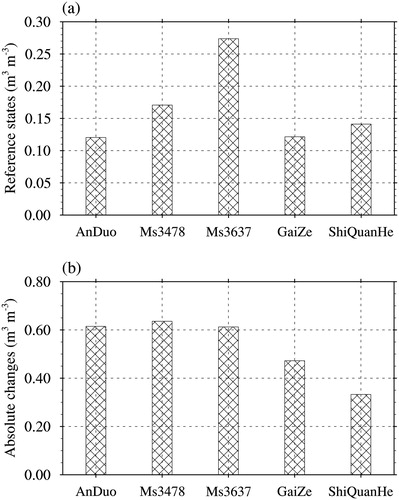
displays the reference states of SSM simulated using the default parameter values. shows the maximum uncertainties in the simulated SSM due to the errors in the 28 selected model parameters at the five Tibetan sites. Generally, relative to the reference states, these uncertainties fluctuated in the range 0.33–0.64 m3 m−3 (235–510%) in terms of absolute (relative) change (). Furthermore, this type of uncertainty at the wet alpine meadow sites was greater than that at the dry alpine desert sites. In the wet alpine meadows (AnDuo, Ms3478 and Ms3637), the uncertainties in SSM exceeded 0.6 m3 m−3; however, in the dry alpine deserts (GaiZe and ShiQuanHe), the uncertainties in the SSM were smaller than 0.5 m3 m−3.
Fig. 2. The reference states of SSM simulated by using the default parameter values (a) as well as the maximal uncertainties in the simulated SSM due to errors from all 28 selected parameters at different TP sites during different simulation periods in terms of absolute changes (b).
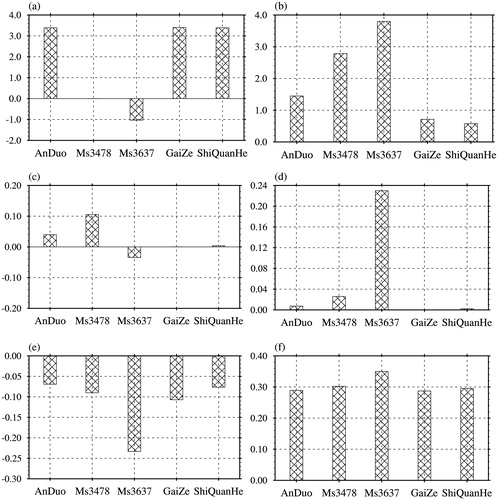
The physical processes that mainly contributed to uncertainties in the SSM were also explored by analyzing the variations in hydrological processes related to the surface water budget (i.e., ET, soil ice, Rsur and the water transfer between the subsurface and surface soil layers indicated by the changes in the subsurface soil moisture). The CNOP-P-type parameter errors that caused the maximal uncertainties led to increases in SSM at all study sites. The changes in soil ice due to the CNOP-P-type parameter errors at different sites were small and played little role in the SSM variations (figures not shown). For ET, Rsur, and subsurface soil moisture, their variations as well as their reference states simulated using the default parameter values are displayed in . Among the wet alpine meadow sites (e.g., Anduo, Ms3478 and Ms3637), large differences existed in the ET variations (). At Anduo, ET was dramatically enhanced, but at Ms3637, ET was decreased. At Ms3478, ET was almost unchanged. Rsur was shown to experience obvious changes only at these wet alpine meadow sites, and the magnitudes of the changes generally did not exceed 0.1 mm day−1 (). Additionally, the subsurface soil moisture decreased at all sites (). It was suggested that water in the subsurface soil layer was transferred to the surface soil layer, which was conducive to the increases in SSM. Generally, at the wet alpine meadow sites, the interactions among changes in ET, Rsur and the water transfer from the subsurface to surface soil layers resulted in the changes in SSM. At the dry alpine desert sites (i.e., GaiZe and ShiQuanHe), Rsur was almost unchanged (); however, there were significant increases in ET of more than 3.0 mm day−1 (), which facilitated soil water loss. Subsurface soil moisture also decreased, indicating that the water in the subsurface soil layer was transferred to the surface soil layer (). This contributed to the increases in the SSM. Consequently, changes in SSM in the dry alpine deserts were the result of the changes in ET and the water transfer between the subsurface and surface soil layers.
Fig. 3. The variations (left column) in ET (a, mm day−1), Rsur (c, mm day−1) and subsurface soil moisture (e, m3 m−3) relative to their respective reference states (right column) of ET (b, mm day−1), Rsur (d, mm day−1), subsurface soil moisture (f, m3 m−3) caused by the CNOP-P-type parameter errors associated with all 28 parameters at different TP sites during different simulation periods.
4.2. Identification of the most sensitive and important parameter combination
From Section 4.1, we can see that parameter errors might induce great uncertainties in SSM by affecting the representation of some key hydrological processes. The uncertainties caused by inappropriate parameters cannot be ignored. However, not all parameter errors can cause great uncertainties in numerical simulations. To determine which parameters would induce larger uncertainties in the simulated SSM, sensitivity analyses were conducted by employing the new sensitivity analysis framework based on the CNOP-P method and the OAT method.
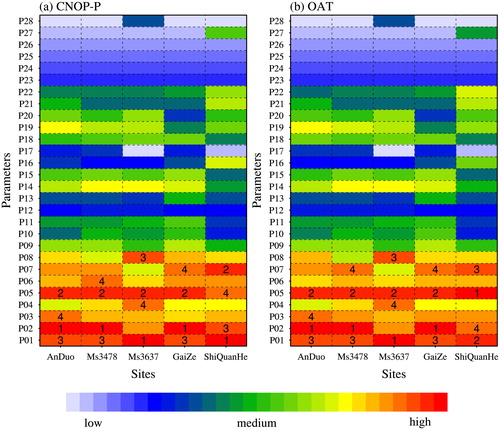
Through the single-parameter sensitivity analysis using the CNOP-P approach, the sensitivities of all 28 parameters were ranked, and they are displayed in . For all TP sites, P01 (i.e., the porosity of the upper soil layer), P02 (i.e., the porosity of the lower soil layer) and P05 (i.e., the Clapp and Hornberger “b” parameter of the upper soil layer) were in the five most sensitive parameters. A similar result was obtained by using the OAT approach (). In fact, in the CoLM, Darcy’s law is used to determine the water flow within the soil to calculate the soil moisture. In Darcy’s law, the water flow is dependent on two variables (i.e., the soil hydraulic conductivity and matric potential), both of which are formulated according to Clapp and Hornberger (Citation1978). In the Clapp and Hornberger empirical formulas (Clapp and Hornberger, Citation1978), P05 is the exponent of wetness in the formulas for soil hydraulic conductivity and matric potential, and P01 and P02 are part of the effective porosity, which is used to compute wetness. As a result, the three parameters P01, P02 and P05 significantly influence water flow in soil by altering the soil hydraulic conductivity and matric potential. Consequently, SSM was very sensitive to P01, P02 and P05. In addition, regardless of which sensitivity analysis approach was used, for all sites, the first 8 sensitive parameters were basically related to soil texture, except for the 8th sensitive parameter at the wet alpine meadow sites (i.e., Anduo, Ms3478 and Ms3637), which was associated with vegetation characteristics. This confirmed the key role of the soil texture-related parameters (i.e., porosity, minimum soil suction, Clapp and Hornberger “b” parameter, and saturated hydraulic conductivity) in simulating soil moisture at the TP sites. Additionally, the vegetation parameters, such as P19 (i.e., maximum ponding of the leaf area) and P14 (i.e., temperature coefficient of the conductance-photosynthesis model), seemed to play a more important role in soil moisture modeling in wet alpine meadows than in dry alpine deserts.
Fig. 4. The sensitivity ranks of all 28 parameters based on the single-parameter sensitivity analyses using the CNOP-P approach (a) and the OAT method (b) at different TP sites. Numbers “1”, “2”, “3”, and “4” on colored boxes label the 4 most sensitive parameters (in order of sensitivity) at each site.
From the above results from the single-parameter sensitivity analysis using the CNOP-P approach, the first 8 sensitive parameters were selected from a total of 28 parameters. Then, from those 8 relatively more sensitive and important parameters, the most sensitive and important 4-parameter combinations were identified and are shown in . For each site, the most sensitive and important combination was only composed of soil texture-related parameters and belonged to a subset of the parameter set composed of P01, P02, P03, P04, and P05. In addition, these combinations all included P01 and P02, which denoted the porosities of the upper and lower soil layers, respectively. On the whole, the difference between the most sensitive and important combinations at different sites was small. The maximal values of the cost function related to the most sensitive 4-parameter combinations, which described the maximal uncertainties in SSM in the form of absolute changes, are shown in . These uncertainties lie in the range between 0.28 and 0.52 m3 m−3. In terms of percentage changes, the maximal uncertainties fluctuated in the range from 150% to 408% (). Comparisons between the simulation uncertainty caused by the most sensitive 4-parameter combination and that caused by all 28 parameters revealed that although the most sensitive and important parameter combination only comprised 4 parameters, the uncertainty that the 4 parameter members could cause accounted for a large proportion of the uncertainty caused by all 28 parameters ( and ).
Fig. 5. The maximal uncertainties in the simulated SSM due to errors from the most sensitive and important 4-parameter combinations identified by using the CNOP-P approach as well as errors from the 4 most sensitive parameters determined by using the OAT method: (a) in terms of absolute changes, (b) in terms of percentage changes.
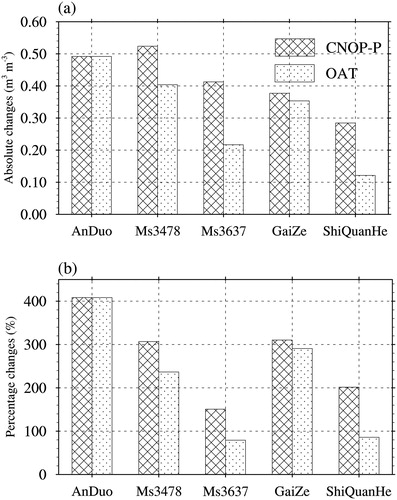
Table 3. The most sensitive parameter combinations at different TP sites identified by using the sensitivity analysis framework based on the CNOP-P approach.
Furthermore, the most 4 sensitive parameters from the single-parameter sensitivity analysis using the OAT approach also comprised a type of 4-parameter combination, which was identified without considering the nonlinear interactions among parameters. At all sites except the Anduo site, these 4-parameter combinations based on the OAT method were different from the most sensitive and important combinations identified by the sensitivity analysis specifically for parameter combinations ( and ). In general, the 4-parameter combinations identified by the two methods possessed 2 or more identical parameter members. In addition, the maximal uncertainties in SSM caused by the 4 most sensitive parameters identified using the OAT method were smaller than those caused by the most sensitive and important 4-parameter combinations ( and ). Therefore, at the TP sites, nonlinear interactions among parameters played a role and should be taken into account when searching for the most sensitive and important parameter combinations. It should be noted that the differences in parameter combination sensitivity between the two different analyses were not statistically significant which might be associated with the limited observations (at only 5 observational sites) we can acquire.
4.3. Verification of the most sensitive and important parameter combinations
By employing the gain defined by Eq. (4), this section compares the impacts of reducing errors in parameter combinations identified by different methods to demonstrate the benefits of eliminating errors in the identified most sensitive parameter combinations for SSM. Then, SSM is chosen as the state variable in Eq. (4), and the value of
characterizes the improvement of the SSM simulation due to the decrease in the parameter error. The greater the value of
is, the larger the reduction in the simulation uncertainty of SSM will be.
Based on the results of the sensitivity analyses using different approaches, at each site, three types of parameter error were chosen. The first type was the CNOP-P-type parameter error corresponding to the most sensitive and important parameter combination identified using the multiple-parameter sensitivity analysis specifically for parameter combinations (denoted as CNOP). The remaining two parameter errors were the CNOP-P-type parameter errors corresponding to the most 4 sensitive parameters using the single-parameter sensitivity analyses – the OAT method (denoted OAT) and the CNOP-P approach (denoted CNOP_single) – as identified in . Then, a series of numerical experiments were conducted to reveal the benefits of reducing the abovementioned three types of parameter errors by setting to be 0.2, 0.4, 0.6, and 0.8, where the different values represent different extents of reduction in the parameter errors.
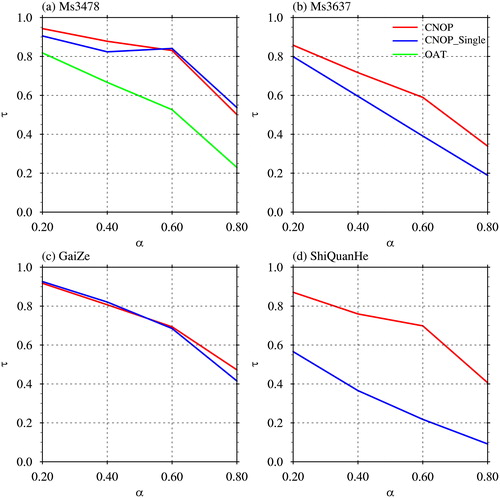
presents the gains that represent the extent of the reduction in uncertainties in the simulated SSM obtained by reducing the different types of parameter errors. Note, the single-parameter analyses using the CNOP-P and OAT methods identified the same 4 parameters for all sites except Ms3478 (); and all 3 sensitivity analyses identified the same 4 parameters for the AnDuo site, which was therefore not included in . It can be seen that decreases in the CNOP errors always made the greatest gains at the Ms3637 and ShiQuanHe sites (). At the other two sites, the gains due to reductions in the CNOP and CNOP_single errors were close (). Moreover, decreases in the OAT errors contributed to the smallest gains. On average, the uncertainties in SSM were reduced by 70.5% (acquired by averaging the values of
across all
and all sites except AnDuo) due to the decreases in the CNOP errors, which corresponded to the most sensitive and important parameter combinations, compared to smaller decreases from the single parameter analyses (57.3% and 51.9% for the reduced CNOP_single and OAT errors respectively). As a result, taking nonlinear interactions among parameters into account resulted in greater improvements.
Fig. 6. The reductions in the uncertainties of the simulated SSM at different TP sites, which are represented by caused by the different decreased extents (as indicated by
) of three types of parameter error: CNOP, CNOP_Single, and OAT.
5. Conclusion and discussion
Previous studies have addressed the poor representation of TP land surface processes in current LSMs, which could significantly affect numerical weather predictions and climate simulations associated with TP-induced elevated heating and circulation. Hence, to provide scientific support for improvements in land surface modeling of the TP by means of reducing uncertainties in model parameters, a comprehensive uncertainty and sensitivity analysis for SSM in the TP has been implemented in this study by using the CNOP-P approach and the uncoupled CoLM along with 28 uncertain parameters. Five sites were investigated, of which three were typical alpine meadows (i.e., Anduo, Ms3478, and Ms3637) in the central and eastern TP, and two were typical alpine deserts (i.e., GaiZe and ShiQuanHe) in the western TP. The CNOP-P approach is a nonlinear optimization method that can be used to determine the upper boundaries of uncertainties in simulations within the reasonable range of parameter errors by considering the nonlinear interactions among parameters.
The uncertainty analysis based on the CNOP-P approach suggested that the uncertainties in the 28 parameters could induce great uncertainties in the simulated SSM, which generally fluctuated in the range 0.33–0.64 m3 m−3 (235–510%) in terms of absolute (relative) changes. Additionally, this type of uncertainty was greater in the wet alpine meadows than in the dry alpine deserts. At the wet alpine meadow sites (i.e., Anduo, Ms3478 and Ms3637), the uncertainties in SSM exceeded 0.6 m3 m−3, but at the dry alpine desert sites (i.e., GaiZe and ShiQuanHe), the uncertainties in SSM were smaller than 0.5 m3 m−3. The key hydrological processes leading to these uncertainties in SSM were closely related to local dry and wet conditions. Generally, in wet alpine meadows, changes in ET, Rsur and water transfer from the subsurface to surface soil layers principally resulted in uncertainties in SSM. In the dry alpine deserts, the uncertainties in SSM were the result of variations in ET and the water transfer between the subsurface and surface soil layers.
The results from the uncertainty analysis indicated that uncertainties in model parameters cannot be ignored for land surface modeling in the TP and should be reduced by parameter estimation methods. For the high-dimensional parameter space of current LSMs, it is necessary to conduct a parameter sensitivity analysis to provide guidance for the determination of parameters in which uncertainties should be reduced first. Here, the sensitivity analysis framework, which is based on the CNOP-P approach and considers the nonlinear interactions among parameters, was applied to examine the sensitivities of individual parameters or parameter combinations. The results revealed that the most sensitive and important combinations of 4 parameter members differed slightly among the study sites. In addition, these combinations only contained soil texture-related parameters and belonged to a subset of the parameter set composed of P01, P02, P03, P04, and P05 (i.e., porosity of topsoil and subsoil, minimum soil suction of topsoil and subsoil, and Clapp and Hornberger “b” parameter). Orth et al. (Citation2016) revealed that total soil depth was one of the sensitive parameters that had the most influence on the model performance of the European Centre for Medium-Range Weather Forecasts (ECMWF) land surface model Hydrology Tiled ECMWF Scheme of Surface Exchanges over Land (HTESSEL) in uncoupled runs. The researchers explained that the soil depth affected the variability of the water storage. In contrast to HTESSEL, the CoLM has a fixed soil depth. The water storage capacity can be modulated by the porosity of the different soil layers. The key roles of P01 and P02 are consistent with the results of Orth et al. (Citation2016). Additionally, based on the Sobol first-order sensitivity indices, Rosero et al. (Citation2010) found that the most sensitive parameter for the top 5 cm soil moisture simulated by different versions of the Noah LSM was porosity at most of the selected sites over transition zones located in the U.S. southern Great Plains. Using the CoLM, Li et al. (Citation2013) also demonstrated the sensitive and important role of porosity and the Clapp and Hornberger “b” parameter in soil moisture modeling for the A’rou observation station located in the arid region of northwestern China. These results were in line with those of our research. Sun et al. (Citation2017b) applied the CNOP-P approach and CoLM to conduct a comprehensive uncertainty and sensitivity analysis for soil moisture due to the uncertain model parameters within four different regions of China that did not cover any area of the TP. Their research was based on simulations averaged over a grid of 0.5ox0.5° rather than observational sites. They found that the most sensitive and important parameter combinations screened were region- and season-dependent. The precise combination of parameters identified in our study were different from those found in Sun et al. (Citation2017b). However, both studies reported the sensitivity and importance of soil texture-related parameters (such as porosity and the Clapp and Hornberger “b” parameter) for soil moisture modeling. Therefore, in the future, soil texture-related parameters should be specified with caution for better land surface modeling.
Although the most sensitive and important parameter combinations only included 4 parameters, the uncertainties they could cause contributed to a great proportion of the uncertainties due to all 28 parameters. In the CoLM, the abovementioned five sensitive parameters (i.e., P01, P02, P03, P04, and P05) were all derived from the soil data inputs. Consequently, the most sensitive and important parameter combinations obtained imply that the development and application of a high-quality soil dataset is of significant importance for improving land surface modeling in the TP. Zheng and Yang (Citation2016) explored the role of soil-type datasets in simulating regional terrestrial water cycles and suggested that in China, the applications of different soil datasets could cause modeled soil moisture to change by 12%.
In addition, the 4 most sensitive parameters identified by the OAT approach generally differed somewhat from the CNOP-P 4-parameter combinations, and the uncertainties they induced were smaller. This further confirmed the effectiveness and value of the sensitivity analysis framework built on the CNOP-P approach that can take account of non-linear interactions among parameters. Compared to the OAT results, the increased sensitivities due to interactions implied by the CNOP-P analysis were not statistically significant which might be due to the limited observations (at only 5 observation sites) we can access. Finally, decreasing the errors in parameter combinations was shown to indicate decreases in the uncertainties of SSM. Generally, the SSM error reductions were largest due to decreasing errors in the CNOP-P parameter combinations.
With the application of model calibrations for improving numerical weather forecasting, the sensitivity analysis results here can provide important land surface parameter candidates for calibration or SA problems associated with numerical weather prediction models (Santanello et al. Citation2013; Quan et al., Citation2016; Duan et al., Citation2017; Di et al., Citation2018). Duan et al. (Citation2017) and Di et al. (Citation2018) calibrated several parameters from different physical parameterizations of the Weather Research and Forecasting (WRF) model, in which one or two crucial soil parameters from the coupled land surface model were incorporated. They reported better forecast results for precipitation and temperature using the optimal parameter values than using the default parameter values. In addition, in research on ensemble prediction, land surface uncertainty has been included by perturbing key parameters from land surface models or land surface states (such as soil temperature and soil moisture) to improve weather predictability and seasonal predictions (Deng et al., Citation2016; MacLeod et al., Citation2016; Orth et al, Citation2016; Duda et al., Citation2017). For example, MacLeod et al. (Citation2016) incorporated land surface uncertainties in an ensemble by perturbing two key soil parameters and considerably improved the prediction of extreme air temperature for summer 2003 in Europe. In this research, the most sensitive parameter combinations for SSM that mainly contributed to the simulation uncertainties were identified by running an uncoupled LSM. Orth et al. (Citation2016) found that the uncoupled calibration of a land surface model improved the coupled forecasts for both temperature and precipitation. Hence, the most sensitive parameter combinations identified may also have the potential to be applied for incorporating land surface uncertainties when ensemble forecasts are constructed.
It should be noted that the sensitivity analysis framework built on the CNOP-P approach is not limited to combinations of only 4 parameters. In practice, if necessary, this framework could be employed to identify the most sensitive and important parameter combinations with five or more members. Additionally, this research is conducted by running an uncoupled LSM. For comparison, a similar uncertainty and sensitivity analysis based on the CNOP-P approach could also be conducted by coupling an LSM to other earth system model components. Limited by the observations we could access, in this study, datasets with relatively short time durations (7 to 31 days) at the five Tibetan sites were applied. A much longer dataset and more Tibetan sites (if available) should be included in the future.
Additional information
Funding
References
- Bastidas, L. A., Hogue, T. S., Sorooshian, S., Gupta, H. V. and Shuttleworth, W. J. 2006. Parameter sensitivity analysis for different complexity land surface models using multicriteria methods. J. Geophys. Res. 111, D20101. doi:10.1029/2005JD006377
- Bauser, H. H., Berg, D., Klein, O. and Roth, K. 2018. Inflation method for ensemble Kalman filter in soil hydrology. Hydrol. Earth Syst. Sci. 22, 4921–4934. doi:10.5194/hess-22-4921-2018
- Bonan, G. B. 1996. Land surface model (LSM version 1.0) for ecological, hydrological, and atmospheric studies: Technical description and user`s guide. NCAR Tech. Note NCAR/TN-417+STR, 150 pp.
- Chen, Y., Yang, K., Tang, W., Qin, J. and Zhao, L. 2012. Parameterizing soil organic carbon's impact on soil porosity and thermal parameters for Eastern Tibet grasslands. Sci. China Earth Sci. 55, 1001–1011. doi:10.1007/s11430-012-4433-0
- Clapp, R. B. and Hornberger, G. M. 1978. Empirical equations for some soil hydraulic properties. Water Resour. Res. 14, 601–604. doi:10.1029/WR014i004p00601
- Crossley, J. F., Polcher, J., Cox, P. M., Gedney, N. and Planton, S. 2000. Uncertainties linked to land-surface processes in climate change simulations. Clim. Dyn. 16, 949–961. doi:10.1007/s003820000092
- Dai, Y. and Zeng, Q. 1997. A land surface model (IAP94) for climate studies part I: formulation and validation in off-line experiments. Adv. Atmos. Sci. 14, 433–460.
- Dai, Y., Zeng, X., Dickinson, R. E., Baker, I., Bonan, G. B. et al. 2003. The common land model. Bull. Amer. Meteor. Soc. 84, 1013–1023. doi:10.1175/BAMS-84-8-1013
- Deng, G., Zhu, Y., Gong, J., Chen, D., Wobus, R. and co-authors. 2016. The effects of land surface process perturbations in a global ensemble forecast system. Adv. Atmos. Sci. 33, 1199–1208. doi:10.1007/s00376-016-6036-8
- Di, Z., Duan, Q., Wang, C., Ye, A., Miao, C. and co-authors. 2018. Assessing the applicability of WRF optimal parameters under the different precipitation simulations in the Greater Beijing Area. Clim. Dyn. 50, 1927–1948. doi:10.1007/s00382-017-3729-3
- Dickinson, R. E., Henderson-Sellers, A., Kennedy, P. and Wilson, M. F. 1993. Biosphere-atmosphere transfer scheme (BATS) version 1e as coupled to the Community Climate Model. NCAR Tech. Note NCAR/TN‐387+STR, 72 pp.
- Duan, Q., Di, Z., Quan, J., Wang, C., Gong, W. et al. 2017. Automatic model calibration: a new way to improve numerical weather forecasting. Bull. Amer. Meteor. Soc. 98, 959–970. doi:10.1175/BAMS-D-15-00104.1
- Duan, A., Wang, M., Lei, Y. and Cui, Y. 2013. Trends in summer rainfall over China associated with the Tibetan plateau sensible heat source during 1980–2008. J. Clim. 26, 261–275. doi:10.1175/JCLI-D-11-00669.1
- Duda, J. D., Wang, X. and Xue, M. 2017. Sensitivity of convection-allowing forecasts to land surface model perturbations and implications for ensemble design. Monthly Weather Rev. 145, 2001–2025. doi:10.1175/MWR-D-16-0349.1
- Gan, Y., Liang, X.-Z., Duan, Q., Choi, H. I., Dai, Y. and co-authors. 2015. Stepwise sensitivity analysis from qualitative to quantitative: application to the terrestrial hydrological modeling of a Conjunctive Surface-Subsurface Process (CSSP) land surface model. J. Adv. Model. Earth Syst. 7, 648–669. doi:10.1002/2014MS000406
- Gao, Y., Li, K., Chen, F., Jiang, Y. and Lu, C. 2015. Assessing and improving Noah-MP land model simulations for the central Tibetan Plateau. J. Geophys. Res. Atmos. 120, 9258–9278. doi:10.1002/2015JD023404
- Gao, Y., Xiao, L., Chen, D., Chen, F., Xu, J. and co-authors. 2017. Quantification of the relative role of land-surface processes and large-scale forcing in dynamic downscaling over the Tibetan Plateau. Clim. Dyn. 48, 1705–1721. doi:10.1007/s00382-016-3168-6
- Gupta, H. V., Bastidas, L. A., Sorooshian, S., Shuttleworth, W. J. and Yang, Z. L. 1999. Parameter estimation of a land surface scheme using multicriteria methods. J. Geophys. Res. 104, 19491–19503. doi:10.1029/1999JD900154
- Huang, J., Fu, Q., Zhang, W., Wang, X., Zhang, R. and co-authors. 2011. Dust and Black Carbon in Seasonal Snow Across Northern China. Bull. Amer. Meteor. Soc. 92, 175–181. doi:10.1175/2010BAMS3064.1
- Jackson, C., Xia, Y., Sen, M. K. and Stoffa, P. L. 2003. Optimal parameter and uncertainty estimation of a land surface model: a case study using data from Cabauw, Netherlands. J. Geophys. Res. 108, 4583. doi:10.1029/2002JD002991
- Koike, T., Yasunari, T., Wang, J. and Yao, T. 1999. GAME-Tibet IOP summary report. In: Proceeding of the 1st International Workshop on GAME-Tibet, Xi’an, China, 11–13 January, 1–2.
- Kumar, A., Chen, F., Barlage, M., Ek, M. B. and Niyogi, D. 2014. Assessing Impacts of Integrating MODIS Vegetation Data in the Weather Research and Forecasting (WRF) Model Coupled to Two Different Canopy-Resistance Approaches. J. Appl. Meteor. Climatol. 53, 1362–1380. doi:10.1175/JAMC-D-13-0247.1
- Li, J., Duan, Q. Y., Gong, W., Ye, A., Dai, Y. and co-authors. 2013. Assessing parameter importance of the Common Land Model based on qualitative and quantitative sensitivity analysis. Hydrol. Earth Syst. Sci. 17, 3279–3293. doi:10.5194/hess-17-3279-2013
- Li, Y., Liu, X. and Li, W. P. 2012. Numerical simulation of land surface process at different underlying surfaces in Tibetan plateau. Plateau Meteorol. 31, 581–591. (in Chinese)
- Liu, S. and Lin, Z. 2005. Validation of common land model using field experiment data over typical land cover types in East Asia. Clim. Environ. Res. 10, 684–699. (in Chinese)
- Liu, Y., Wu, G., Hong, J., Dong, B., Duan, A. and co-authors. 2012. Revisiting Asian monsoon formation and change associated with Tibetan Plateau forcing: II. Change. Clim. Dyn. 39, 1183–1195. doi:10.1007/s00382-012-1335-y
- Liu, L., Zhang, R. and Zuo, Z. 2017. Effect of spring precipitation on summer precipitation in Eastern China: role of soil moisture. J. Clim. 30, 9183–9194. doi:10.1175/JCLI-D-17-0028.1
- Luo, Q., Lv, S., Zhang, Y., Hu, Z., Ma, Y. and co-authors. 2008. Simulation analysis on land surface process of BJ site of central Tibetan Plateau using CoLM. Plateau Meteorol. 27, 259–271. (in Chinese)
- MacLeod, D. A., Cloke, H. L., Pappenberger, F. and Weisheimer, A. 2016. Improved seasonal prediction of the hot summer of 2003 over Europe through better representation of uncertainty in the land surface. QJR. Meteorol. Soc. 142, 79–90. doi:10.1002/qj.2631
- Meng, X. and Fu, Z. 2009. Comparative evaluation of land surface models BATS, LSM, and CoLM at Tongyu Station in Semi-arid Area. Clim. Environ. Res. 14, 352–362. in Chinese)
- Mu, M., Duan, W., Wang, Q. and Zhang, R. 2010. An extension of conditional nonlinear optimal perturbation approach and its applications. Nonlin. Process. Geophys. 17, 211–220. doi:10.5194/npg-17-211-2010
- Mu, M., Zhou, F. and Wang, H. 2009. A method for identifying the sensitive areas in targeted observations for tropical cyclone prediction: conditional nonlinear optimal perturbation. Mon. Wea. Rev. 137, 1623–1639. doi:10.1175/2008MWR2640.1
- Orth, R., Dutra, E. and Pappenberger, F. 2016. Improving weather predictability by including land surface model parameter uncertainty. Monthly Weather Rev. 144, 1551–1569. doi:10.1175/MWR-D-15-0283.1
- Peng, F., Mu, M. and Sun, G. 2017. Responses of soil moisture to climate change based on projections by the end of the 21st century under the high emission scenario in the ‘Huang–Huai–Hai Plain’ region of China. J. Hydro-Environ. Res. 14, 105–118. doi:10.1016/j.jher.2016.10.003
- Pitman, A. J. 1994. Assessing the sensitivity of a land-surface scheme to the parameter values using a single column model. J. Clim. 7, 1856–1869. doi:10.1175/1520-0442(1994)007<1856:ATSOAL>2.0.CO;2
- Pitman, A. J. 2003. The evolution of, and revolution in, land surface schemes designed for climate models. Int. J. Climatol. 23, 479–510. doi:10.1002/joc.893
- Quan, J., Di, Z., Duan, Q., Gong, W., Wang, C. and co-authors. 2016. An evaluation of parametric sensitivities of different meteorological variables simulated by the WRF model. QJR. Meteorol. Soc. 142, 2925–2934. doi:10.1002/qj.2885
- Rosero, E., Yang, Z.-L., Wagener, T., Gulden, L. E., Yatheendradas, S. and co-authors. 2010. Quantifying parameter sensitivity, interaction, and transferability in hydrologically enhanced versions of the Noah land surface model over transition zones during the warm season. J. Geophys. Res. 115, D03106.
- Rosolem, R., Gupta, H. V., Shuttleworth, W. J., de Gonçalves, L. G. G. and Zeng, X. 2013. Towards a comprehensive approach to parameter estimation in land surface parameterization schemes. Hydrol. Process. 27, 2075–2097. doi:10.1002/hyp.9362
- Santanello, J. A., Kumar, S. V., Peters-Lidard, C. D., Harrison, K. and Zhou, S. 2013. Impact of land model calibration on coupled land–atmosphere prediction. J. Hydrometeorol. 14, 1373–1400. doi:10.1175/JHM-D-12-0127.1
- Seneviratne, S. I., Corti, T., Davin, E. L., Hirschi, M., Jaeger, E. B. and co-authors. 2010. Investigating soil moisture–climate interactions in a changing climate: a review. Earth-Sci. Rev. 99, 125–161. doi:10.1016/j.earscirev.2010.02.004
- Shi, Y., Davis, K. J., Zhang, F., Duffy, C. J. and Yu, X. 2015. Parameter estimation of a physically-based land surface hydrologic model using an ensemble Kalman filter: a multivariate real-data experiment. Adv. Water Resour. 83, 421–427. doi:10.1016/j.advwatres.2015.06.009
- Storn, R. and Price, K. 1997. Differential evolution – a simple and efficient heuristic for global optimization over continuous spaces. J. Glob. Optim. 11, 341–359. doi:10.1023/A:1008202821328
- Sud, Y. C. and Smith, W. E. 1985. Influence of local land-surface processes on the Indian monsoon: a numerical study. J. Clim. Appl. Meteorol. 24, 1015–1036. doi:10.1175/1520-0450(1985)024<1015:IOLLSP>2.0.CO;2
- Sun, G. and Mu, M. 2011. Nonlinearly combined impacts of initial perturbation from human activities and parameter perturbation from climate change on the grassland ecosystem. Nonlin. Process. Geophys. 18, 883–893. doi:10.5194/npg-18-883-2011
- Sun, G. and Mu, M. 2012. Responses of soil carbon variation to climate variability in China using the LPJ model. Theor. Appl. Climatol. 110, 143–153. doi:10.1007/s00704-012-0619-9
- Sun, G. and Mu, M. 2013. Understanding variations and seasonal characteristics of net primary production under two types of climate change scenarios in China using the LPJ model. Clim. Change 120, 755–769. doi:10.1007/s10584-013-0833-1
- Sun, G. and Mu, M. 2014. The analyses of the net primary production due to regional and seasonal temperature differences in eastern China using the LPJ model. Ecol. Model. 289, 66–76. doi:10.1016/j.ecolmodel.2014.06.021
- Sun, G. and Mu, M. 2017. A new approach to identify the sensitivity and importance of physical parameters combination within numerical models using the Lund–Potsdam–Jena (LPJ) model as an example. Theor. Appl. Climatol. 128, 587–601. doi:10.1007/s00704-015-1690-9
- Sun, G., Peng, F. and Mu, M. 2017. Uncertainty assessment and sensitivity analysis of soil moisture based on model parameter errors – results from four regions in China. J. Hydrol. 555, 347–360. doi:10.1016/j.jhydrol.2017.09.059
- Sun, G., Peng, F. and Mu, M. 2017. Variations in soil moisture over the ‘Huang-Huai-Hai Plain’ in China due to temperature change using the CNOP-P method and outputs from CMIP5. Sci. China Earth Sci. 60, 1838–1853. doi:10.1007/s11430-016-9061-3
- van der Velde, R., Su, Z., Ek, M., Rodell, M. and Ma, Y. 2009. Influence of thermodynamic soil and vegetation parameterizations on the simulation of soil temperature states and surface fluxes by the Noah LSM over a Tibetan plateau site. Hydrol. Earth Syst. Sci. 13, 759–777. doi:10.5194/hess-13-759-2009
- Vrugt, J. A., Gupta, H. V., Nualláin, B. and Bouten, W. 2006. Real-time data assimilation for operational ensemble streamflow forecasting. J. Hydrometeor. 7, 548–565. doi:10.1175/JHM504.1
- Wang, Z., Yang, S., Lau, N.-C. and Duan, A. 2018. Teleconnection between summer NAO and East China rainfall variations: a bridge effect of the Tibetan plateau. J. Clim. 31, 6433–6444. doi:10.1175/JCLI-D-17-0413.1
- Wu, G., He, B., Duan, A., Liu, Y. and Yu, W. 2017. Formation and variation of the atmospheric heat source over the Tibetan Plateau and its climate effects. Adv. Atmos. Sci. 34, 1169–1184. doi:10.1007/s00376-017-7014-5
- Xia, Y., Sen, M. K., Jackson, C. S. and Stoffa, P. L. 2004. Multidataset study of optimal parameter and uncertainty estimation of a land surface model with bayesian stochastic inversion and multicriteria method. J. Appl. Meteorol. 43, 1477–1497. doi:10.1175/JAM2145.1
- Xie, Z., Hu, Z., Liu, H. et al. 2017. Evaluation of the surface energy exchange simulations of land surface model CLM4.5 in Alpine Meadow over the Qinghai-Xizang Plateau. Plateau Meteorol. 36, 1–12. in Chinese)
- Xie, Z., Yuan, F., Duan, Q., Zheng, J., Liang, M. and co-authors. 2007. Regional parameter estimation of the VIC land surface model: methodology and application to river basins in China. J. Hydrometeor. 8, 447–468. doi:10.1175/JHM568.1
- Xin, Y., Bian, L. and Zhang, X. 2006. The application of CoLM to arid region of northwest China and Qinghai-Xizang plateau. Plateau Meteorol. 25, 567–574.
- Yang, K., Chen, Y. Y. and Qin, J. 2009. Some practical notes on the land surface modeling in the Tibetan Plateau. Hydrol. Earth Syst. Sci. 13, 687–701. doi:10.5194/hess-13-687-2009
- Ye, D.-Z. and Wu, G.-X. 1998. The role of the heat source of the Tibetan Plateau in the general circulation. Meteorl. Atmos. Phys. 67, 181–198. doi:10.1007/BF01277509
- Yu, Y., Mu, M. and Duan, W. 2012. Does model parameter error cause a significant “spring predictability barrier” for El Niño events in the Zebiak–Cane Model? J. Clim. 25, 1263–1277. doi:10.1175/2011JCLI4022.1
- Zeng, X., Shaikh, M., Dai, Y., Dickinson, R. E. and Myneni, R. 2002. Coupling of the common land model to the NCAR community climate model. J. Clim. 15, 1832–1854. doi:10.1175/1520-0442(2002)015<1832:COTCLM>2.0.CO;2
- Zhang, H., Hendricks Franssen, H. J., Han, X., Vrugt, J. A. and Vereecken, H. 2017. State and parameter estimation of two land surface models using the ensemble Kalman filter and the particle filter. Hydrol. Earth Syst. Sci. 21, 4927–4958. doi:10.5194/hess-21-4927-2017
- Zhang, G., Zhou, G. and Chen, F. 2017. Analysis of parameter sensitivity on surface heat exchange in the Noah land surface model at a temperate desert steppe site in China. J. Meteorol. Res. 31, 1167–1182. doi:10.1007/s13351-017-7050-1
- Zhang, G., Zhou, G., Chen, F., Barlage, M. and Xue, L. 2014. A trial to improve surface heat exchange simulation through sensitivity experiments over a desert steppe site. J. Hydrometeor. 15, 664–684. doi:10.1175/JHM-D-13-0113.1
- Zhang, R. and Zuo, Z. 2011. Impact of spring soil moisture on surface energy balance and summer monsoon circulation over East Asia and precipitation in East China. J. Clim. 24, 3309–3322. doi:10.1175/2011JCLI4084.1
- Zheng, H. and Yang, Z. L. 2016. Effects of soil-type datasets on regional terrestrial water cycle simulations under different climatic regimes. J. Geophys. Res. Atmos. 121, 14,387–14402. doi:10.1002/2016JD025187