
 ?Mathematical formulae have been encoded as MathML and are displayed in this HTML version using MathJax in order to improve their display. Uncheck the box to turn MathJax off. This feature requires Javascript. Click on a formula to zoom.
Abstract
The impact of assimilating zenith total delay (ZTD) observations from the Moroccan ground-based Global Navigation Satellite System (GNSS) network into the high-resolution operational model AROME-Morocco (2.5 km) is assessed over one month. The objective is to investigate the impact on moisture field and rainy event forecasts in a three-dimensional variational (3D-Var) data assimilation framework with a 3-hour cycling. As a first step, a pre-processing of ZTD observations is performed for quality control and bias correction and it points out that all GNSS stations available in the network can be potentially assimilated. Then, two parallel experiments, with and without assimilation of GNSS ZTD, are performed during February–March 2018, for 48-hour lead times. Compared against other observation systems of humidity (radiosonde and surface network), a small and beneficial improvement is found in the atmospheric moisture short-range forecast, despite the limited number of GNSS stations over Morocco. The impact of assimilating GNSS ZTD data on precipitation forecasts is evaluated both subjectively and objectively. The objective precipitation scores against daily rain gauge observations show that the impact is mixed, positive for larger rainfall accumulations and neutral to negative for smaller rainfall accumulations. A specific evaluation for a case study of a rain event highlights an improvement in terms of intensity and location of precipitating areas when GNSS ZTD observations are assimilated.
1. Introduction
The description of water vapour in initial conditions of Numerical Weather Prediction (NWP) systems is a key parameter for the forecast of many physical processes in the atmosphere. Kuo et al. (Citation1996) showed that a poor description of the water vapour field is one of the major sources of error in short-range precipitation forecasts. Furthermore, Ducrocq et al. (Citation2002) highlighted the importance of the initial humidity field to improve the forecasts of heavy precipitation events. However, water vapour is highly variable in both time and space. The main conventional observing systems of this variable are synoptic meteorological stations and radiosondes. Synoptic stations provide only local surface measurements. Radiosondes, despite their capability of providing vertical profiles of wind, temperature and humidity, are routinely only available twice a day and the global network is rather sparse because of their expensive cost. Besides conventional observations, satellite-based microwave and infrared remote sensing can be used to measure the vertical and horizontal distributions of water vapor. Satellites provide global measurement coverage, but they have difficulty observe the lower troposphere, where water vapour is maximum. Polar orbiting satellites have a limited impact within mid-latitudes limited area models due to their low time revisit (twice a day). Moreover, the infrared radiometers are heavily influenced by clouds, so they are suitable for assimilation only under clear sky conditions.
Remote sensing of atmospheric water vapour with GNSS receivers is an innovative technique first described by Bevis et al. (Citation1992). The zenith total delay (ZTD) derived from GNSS measurements of radio signal delays is composed of two parts: the hydrostatic (dry) delay and the non-hydrostatic (wet) delay. This wet delay is related by a proportional relationship to the vertically Integrated Water Vapour (IWV) content. This technique has shown the ability to provide precise and continuous estimates of water vapour with high temporal frequency (1 hour to 15 minutes) in all sky conditions. The accuracy of IWV derived from ZTD measurements is of the order of 1–2 kg/m2 derived from comparison with other instruments (Gendt et al., Citation2004; Bock et al., Citation2005).
Many studies have shown the benefit of using GNSS observations in NWP either for model forecast validation or for improving their initial conditions (Guerova et al., Citation2016). Thanks to variational data assimilation schemes, the direct assimilation of ZTD observations is possible (Zou and Kuo, Citation1996; De Pondeca and Zou, Citation2001; Cucurull et al., Citation2004). For that, an observation operator which computes ZTD from the model prognostic variables is required. Results from previous studies on the assimilation of GNSS ZTD observations showed overall neutral to positive impacts. Positive impacts were reported for lower-tropospheric humidity, surface temperature, surface pressure, geopotential height and heavy precipitation. On the other hand, some negative impacts were noted for weak precipitation. Poli et al. (Citation2007) assimilated ZTD observations into the Météo-France global NWP model ARPEGE using a four-dimensional variational (4D-Var) assimilation system. These authors found a positive impact in helping constrain the synoptic circulation in 1 to 4 days and a positive impact on the prediction of short-term precipitation. Macpherson et al. (Citation2008) showed some positive impact on precipitation forecasts when assimilating NOAA ground-based GPS ‘Global positioning System’ observations over North America into the Canadian regional model. Further studies have examined the impact of the assimilation of GNSS observations into mesoscale convection-permitting models. Yan et al. (Citation2009) conducted a study of ZTD data assimilation into the Météo-France high-resolution model (AROME) using three-dimensional variational (3D-Var) assimilation. This study showed improvement to the forecast of a heavy precipitation episode over eastern France. More recently, Mahfouf et al. (Citation2015) performed a revised assessment of the impact of the assimilation of ZTD into AROME over 1-month and found improvement in the humidity and precipitation short-range forecasts. Similarly, Sánchez-Arriola et al. (Citation2016) and Lindskog et al. (Citation2017) have examined the impact of assimilating GNSS ZTD in the convective-scale HARMONIE-AROME system with a specific focus on a variational bias correction method. All the previous studies have been performed over temperate regions. The assessment of the impact of GNSS ZTD assimilation is still needed for other regions using regional models and having different climates.
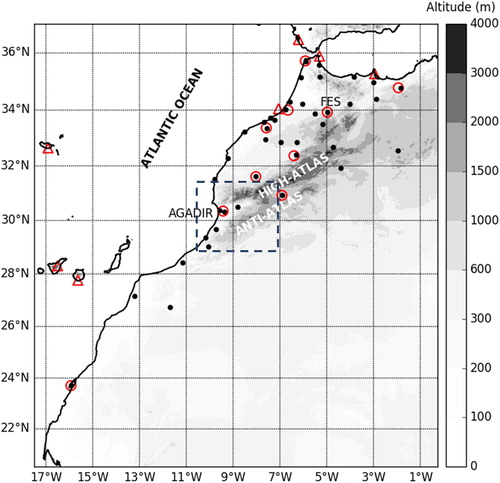
Morocco is a country in the subtropical zone of North West Africa. It is characterized by very different climates depending upon the sub-region. The Moroccan climate is influenced by the Atlantic Ocean to the West, the Mediterranean Sea to the North, the dry Saharan air to the South and is locally modulated by the orographic effects induced by the Atlas mountains (). These factors have a strong impact on the variability of moisture and precipitation (Knippertz et al., Citation2003). The water vapour observing system in Morocco includes conventional observations from synoptic stations and 3 radiosondes, in addition to microwave satellite observations (AMSU- B/MHS). However, in the case of limited area models, these data from polar orbiting satellites suffers from a reduced temporal coverage. Thereby, the above datasets cannot capture accurately the mesoscale variability of water vapour. In order to take advantage of the potential of GNSS data assimilation for improving NWP forecasts of water vapour, the National Meteorological Service in Morocco (‘Direction de la Météorologie Nationale’: DMN) has acquired a GNSS meteorological network for NWP applications (Hdidou et al., Citation2018). DMN operates the high-resolution convection-resolved AROME-Morocco with a 2.5 km horizontal resolution. The initial conditions are performed using a 3D-Var data assimilation system with a 3-hour Rapid Update Cycle (RUC). The main objective of this current research is to investigate, for the first time, the assimilation of this new Moroccan GNSS network on short-range mesoscale forecasts. The impact study undertaken in the present paper is expected to provide a new assessment of the impact of GNSS ZTD data over the North African region, which has a different climate and has received until now little attention in the literature.
Fig. 1. Location of the ground-based GNSS stations from Morocco network (circles) and IGS network (triangles), plotted over the AROME-Morocco model domain. The background is the model orography (grayscale at the right of the panel; m). The black dots indicate location of the meteorological surface stations. The geographical locations of the two GNSS stations referred in the text are indicated by names. Some additional geographical locations are indicated (sea and mountains). The dashed line delineates the zone of interest of the 1 March 2018 case study.
According to precipitation regime, Knippertz et al. (Citation2003) have distinguished three homogeneous regions in Morocco: The Atlantic region, the Mediterranean region and the South of the Atlas region. In this last region, moisture transports, from the Atlantic, along the southern flank of the Atlas mountains associated with cyclones West of Morocco and the Iberian Peninsula, are the decisive factors of precipitation. In the present study, the impact of GNSS ZTD data assimilation on the mesoscale prediction of a heavy precipitation event that occurred on the South of the Atlas region is also examinated.
The outline of this paper is as follows: The mesoscale NWP system is described in section 2. The 3D-Var assimilation system is presented in section 3 with an overview of the assimilated GNSS ZTD observations and their pre-processing. Section 4 contains the impact experiments setup with their results. Finally, section 5 draws the main conclusions and perspectives.
2. Description of the AROME-Morocco forecasting and data assimilation systems
The AROME (Applications of Research to Operations for Mesoscale) NWP model is a non-hydrostatic model used operationally at DMN in Morocco since 2016. This model was developed by Météo-France (Seity et al., Citation2011) and is being maintained and further refined in collaboration between the meteorological institutes belonging to the ALADIN-HIRLAM consortia. The ALADIN-HIRLAM consortia are a collaboration of 26 countries in Europe and northern Africa on short-range mesoscale NWP (Termonia et al., Citation2018). AROME uses the dynamical non hydrostatic equations of ALADIN (Bubnová et al., Citation1995). The AROME physical package is derived from the Méso-NH research model (Lafore et al., Citation1998; Lac et al., Citation2018). The deep convection is resolved explicitly by the model dynamics. Clouds are explicitly represented by prognostic equations for six water species (vapour, cloud water, rain water, ice crystals, snow and graupel) governed by a bulk mixed-phase microphysical scheme (Pinty and Jabouille, Citation1998). The representation of turbulence is based on a prognostic Turbulent Kinetic Energy (TKE) equation (Cuxart et al., Citation2000). The longwave radiation is computed with the Rapid Radiative Transfer Model (RRTM) (Mlawer et al., Citation1997) and the shortwave radiation is described with six spectral bands (Fouquart and Bonnel, Citation1980). The surface exchanges are represented by the externalised module SURFEX (Masson et al., Citation2013) where the natural land surfaces are parameterized by the ISBA scheme (Noilhan and Mahfouf, Citation1996), while the urban areas are handled by Town Energy Balance (TEB) scheme (Masson, Citation2000).
AROME-Morocco domain covers Morocco and a small part of Spain and Portugal (). It has a regular 2.5 km grid with Lambert projection. The center is 28.99°N, −8.75°E with 800 physical grid points in both East-West and North-South directions, and 90 vertical layers. Lateral boundary conditions are taken from hourly ALADIN forecasts with 7.5 km horizontal resolution.
The AROME data assimilation system (Seity et al., Citation2011) is based on the ALADIN three-dimensional variational assimilation system (3D-VAR) with an incremental formulation (Courtier et al., Citation1994) at the same resolution. The data assimilation system runs with a 3-hour cycle. The variables analysed are the two components of horizontal wind, temperature, specific humidity and surface pressure. The other prognostic variables (TKE, nonhydrostatic and microphysical fields) are cycled from the previous 3-hour AROME forecast. The observations assimilated into AROME-Morocco are surface stations (SYNOP), radiosondes (TEMP), ship and buoys reports (SHIP) and aircrafts reports (AIREP) for conventional observations. For remote sensing observations, the radiances from AMSU-A, AMSU-B/MHS are assimilated. The background error covariances for the AROME-Morocco domain were computed over a period of 10 days, using an ensemble based method with a six member ensemble of perturbed AROME 3D-Var (Brousseau et al., Citation2011). The AROME perturbed assimilations are based on explicit perturbations of observations, obtained from random draws of observation errors, and implicit perturbations of backgrounds, obtained from the perturbed previous data assimilation cycles.
3. Assimilation of GNSS ZTD data
3.1. GNSS observations
In this study, we use the ZTD observations from the Moroccan GNSS station network and from the International GNSS Service (IGS) network. The IGS raw data is freely available and can be downloaded from ftp://cddis.gsfc.nasa.gov/gps. All those ZTD datasets are processed in near-real-time mode at DMN using Bernese software (Dach et al., Citation2015). The temporal frequency of the GNSS observations is about 15 minutes. The accuracy of the Moroccan GNSS ZTD network was evaluated by Hdidou et al. (Citation2018). There are 17 GNSS stations within the AROME-Morocco domain () which represent 3.5% of the total observations assimilated into this model.
3.2. ZTD observation operator
The assimilation of GNSS ZTD is performed by the addition of a new term JoZTD to the cost function (Vedel and Huang, Citation2004):
(1)
(1)
where x
is the vector of analysis increments defined as:
x is the model state (that is the analysis xa at the end of the minimization), xb is the background state (first guess) obtained from a short-range forecast, y
is the ZTD observation increment (background departure) and R is the variance-covariance matrix of GNSS ZTD observations errors. Since observations errors are assumed to be uncorrelated, R is a diagonal matrix with ZTD error variances as elements. H is the tangent linear version of the observation operator which calculates ZTD from the model fields.
ZTD is the integral of the refractivity over a vertical column of the neutral atmosphere which depends on pressure, temperature and water vapour content. The AROME ZTD observation operator (Poli et al., Citation2007) is defined as:
(2)
(2)
where P is the total pressure, e the water vapour pressure,
the temperature and ztop is the top of the model.
and
are empirically determined constants; According to Smith and Weintraub (Citation1953):
= 77.6 K h Pa−1,
= 3.73 × 10⁵ K2 h Pa−1.
The observation operator calculates the model equivalent of ZTD by integrating Equationeq. 2(2)
(2) using pressure as a vertical coordinate, from the pressure at the GNSS station antenna PGNSS to the model top pressure Ptop (13 hPa). The integration is performed assuming that refractivity decays exponentially as a function of altitude between model levels.
In the current observation operator a contribution above the model top ΔZTDtop is added to the total ZTD according to Saastamoinen (Citation1972):
(3)
(3)
where
is the gas constant for dry air and
is the acceleration due to gravity, assumed constant and equal to the mean acceleration due to gravity at the surface
0 (9.8 m s−2). This is different from the approach where the delay above the model top is not calculated but accounted for in the bias correction (Mahfouf et al., Citation2015).
3.3. Observation pre-processing
The 3D-VAR assimilation system assumes that observations have a Gaussian distribution and unbiased errors. Estimates of observation errors are also required in 3D-Var scheme to determine the weight of the observations relative to the background in the analysis. These errors include both instrument and representativeness errors. In data assimilation, the observation statistics are often computed using the background departures, which are defined as the difference between ZTD observations and the model equivalent. The ZTD model equivalent values are calculated using the observation operator described by Equationeq. 2(2)
(2) for each GNSS station and time. This monitoring of background departures is done routinely to assess the quality of ZTD observations.
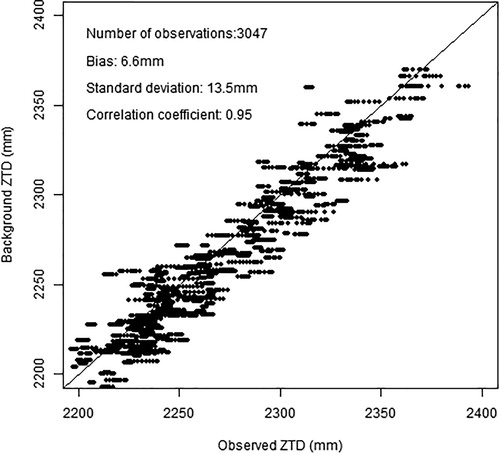
In this study, we computed time series of background departures over 1-month from 10 October to 13 November 2017. For this first monitoring, the 3D-Var temporal thinning has not been performed. Thus, for each assimilation cycle, the departures are computed between the background and all ZTD observations available in the 3-hour assimilation window. shows an example of a scatter plot of ZTD observations compared to model equivalent for the GNSS station at Fes. There is a good agreement between ZTD observations and model counterparts, the correlation coefficient being 0.95. The bias and standard deviation of background departures are respectively 6.6 mm and 13.5 mm.
Fig. 2. Scatter plot of AROME-Morocco model background ZTD against observed ZTD for the GNSS receiver site at Fes for 1-month.
To satisfy the unbiased observations errors hypothesis of the 3D-Var, a bias correction must be applied to ZTD observations at each station before assimilation. As a starting point, the mean of the background departures calculated previously over 1-month (ranging between 0.3 mm and 13 mm) provide a constant bias correction. Thereby, for each station the ZTD observation has to be corrected from this bias before assimilation. The sensitivity to the selected period has been examined by computing a running-mean of departures by varying the width of the averaging window. The results (not shown) showed that a minimum period of 15 days is required to have a relatively stable bias. However, the biases are computed over a 1-month period in order to capture more the systematic biases between model background and ZTD observations. The observation errors have been estimated here from the standard deviation of background departures and assuming a model background error of 6 mm following a methodology proposed for the AROME-France model (Mahfouf et al., Citation2015).
AROME-Morocco 3D-VAR uses a quality control by comparison to the background (background check). Observations are rejected if departures exceed a limit based on the observation error () and background error (
) with a threshold value of 5 times the combined standard deviation error (
) (Bennitt and Jupp, Citation2012). All Moroccan stations have been retained for assimilation according to this background check. Because of the high time resolution of ZTD observations, temporal thinning is performed for AROME-Morocco 3D-Var. Thereby, among the observations available in the 3-hour assimilation window, only the observation closest to the analysis time is selected for each station.
4. The assimilation experiments
4.1. Single observation experiment: Impact on analysis
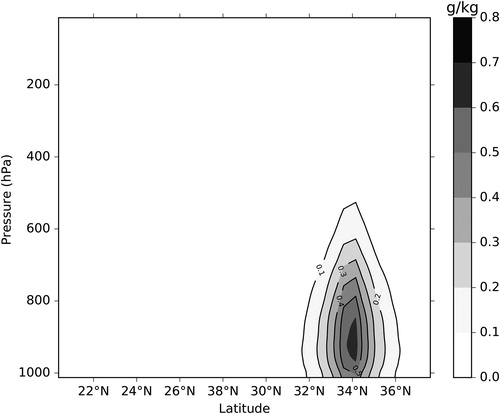
Since it is the first time that the GNSS data are assimilated into the AROME-Morocco model, we started with an experiment where a single observation of ZTD has been assimilated in order to examine precisely the impact of such observations on the resulting analysis. The single observation experiment is performed for Fes GNSS station located at 33.93°N and 4.97°W for the 26 February 2018 at 12 UTC. The value of observed ZTD is 2.226 m and the ZTD background departure is 0.017 m. After assimilation, the ZTD observation departure from the analysis is reduced to 0.001 m, which means that the assimilation system has brought the model state close to the GNSS ZTD observation. The impact of GNSS assimilation is more noticeable on the humidity field. shows the vertical cross section of the analysis increment for the specific humidity for this single observation experiment. The impact is largest in the low to mid-troposphere with a maximum around 900 hPa. The shape of the increments is influenced by the background error covariance matrix, which determines the spreading of information from the observation location among the surrounding model grid points. The horizontal extent of increments is about 150 km.
Fig. 3. Vertical cross section along a latitudinal line of analysis increments of specific humidity (g/kg), obtained by assimilating a single ZTD observation at Fes GNSS station for 12 UTC, 26 February 2018.
4.2. Cycle experiment
To evaluate the impact of the assimilation of ZTD observations in AROME-Morocco, two assimilation cycle experiments are run over 1-month from 20 February 2018 at 0000 UTC to 20 March 2018 at 2100 UTC using the 3D-VAR system. This period has experienced a succession of rainy events. The first experiment (CTRL) assimilates in AROME-Morocco all observations described in section 2. The second experiment (GNSS) is similar to CTRL but GNSS ZTD observations are added. For each assimilation cycle 3-hour forecasts are run to provide the background of the next analysis, then the AROME-Morocco model is run for 48 hours starting from the analyses at 0000 UTC.
4.2.1. Impact on background 3-hour forecasts
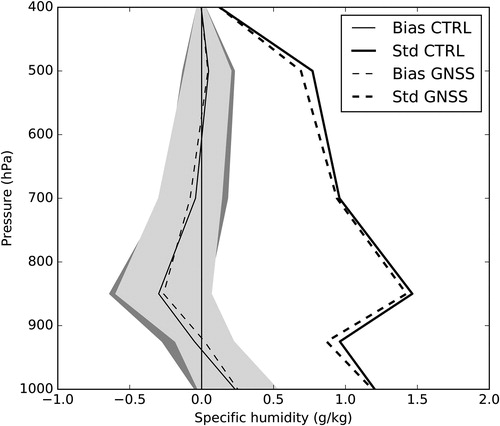
The impact of GNSS ZTD assimilation is evaluated for the short-range 3-hour forecasts against radiosonde observations for the period of study at standard pressure levels between 1000 hPa and 400 hPa. From this evaluation the impact of GNSS assimilation on the vertical profile of humidity can be assessed. shows mean and standard deviation of specific humidity (q) departures (observation-background) from radiosonde observations over the period of interest. The assimilation of GNSS observations has an overall positive impact on specific humidity standard deviation error by reducing it between 1000 hPa and 500 hPa levels. These results are consistent with those from the single observation experiment where the impact was the largest in the low to mid-troposphere. The impact on the bias error is not consistent, with minor degradation for levels below 950 hPa level as well as above 700 hPa, and minor improvement between these two pressure levels. The differences between CTRL and GNSS biases are not significant above the 95%. Bennitt and Jupp (Citation2012) observed also an increase in the humidity when assimilating ZTD observations into the Met Office NAE ‘North Atlantic and European’ model using 3D-Var. These authors related this shift in humidity bias when assimilating ZTD, even when bias corrected, to the fact that the assimilation of new observations changes the relative weights given by the analysis process to background and to the other observations.
Fig. 4. Mean and Standard deviation errors of background departures for specific humidity from radiosonde observations (in g/kg) computed from 20 February to 20 March 2018 for CTRL and GNSS experiments. The shaded areas represent the 95% confidence intervals.
4.2.2. Impact on 0–48 hour forecasts
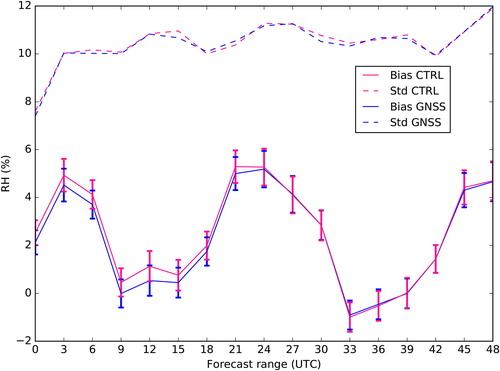
The 0–48 hour forecasts at 3-hour intervals of relative humidity at 2 m (RH2m) are verified against observations from the surface stations (shown in ). displays the statistics of RH2m forecast minus observations (F-O) calculated over the period of study in terms of bias and standard deviation. The RH2m bias shows a strong diurnal cycle with very low values and close to zero during daytime and positive values reaching up to 5% during night time. The assimilation of GNSS ZTD has a positive impact on the bias up to 24-hour forecast range. After 24-hour forecast range, the bias is similar for the two experiments. These differences in bias are probably not statistically significant above the 95% level. The standard deviation displays a neutral impact of the assimilation of GNSS.
Fig. 5. Bias and standard deviation forecast errors of 2 m relative humidity (%) according to forecast range (hours) for both CTRL and GNSS experiments. The scores are calculated against surface observations shown in for the period from 20 February to 20 March 2018. The error bars represent the 95% confidence intervals.
Another objective verification of the forecast skill is given by Quantitative Precipitation Forecast (QPE) scores derived from contingency tables. These scores are computed over the rainy period for 24-hour forecast accumulations (from 06 UTC on day 1 to 06 UTC on day 2) and verified against rain gauge observations issued from the meteorological surface stations shown in . displays the Frequency Bias Index (FBIAS), the Probability of Detection (POD), the False Alarm Ratio (FAR) and the Equitable Threat Score (ETS) for the following thresholds: 0.1, 1, 2, 8, 15, 20 and 25 mm. The definition of these scores is available at https://www.wmo.int/pages/prog/arep/wwrp/new/jwgfvr.html.
Fig. 6. Quantitative scores against observations (FBIAS, POD, FAR and ETS) for daily precipitation AROME-Morocco forecasts for CTRL (solid line) and GNSS (dashed line) experiments from 20 February to 20 March 2018.
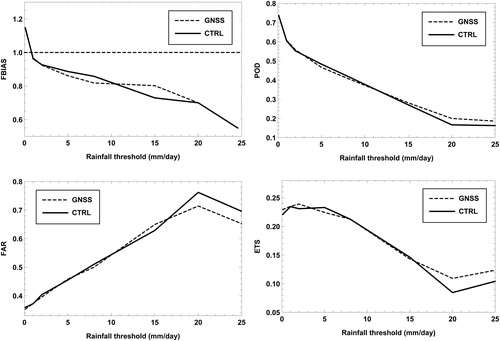
The FBIAS gives information on the correctness of the precipitation forecast values; a perfect value is 1; a FBIAS greater (smaller) than 1 indicates an overestimation (underestimation) in the number of forecast events. The ETS measures the fraction of observed events reproduced correctly, taking into account random hit chance; the score 1 is assigned to a perfect forecast. The POD evaluates the probability that an observed event was forecast. The FAR evaluates the occurrence of forecast events that were actually non-observed. Perfect values for POD and FAR are 1 and 0 respectively.
Both experiments CTRL and GNSS present a negative bias (underestimation) for precipitation amounts above 1 mm. This bias is reduced by GNSS experiment for precipitations amounts between 10 mm and 20 mm, whereas, CTRL experiment is less biased for precipitation between 2 mm and 10 mm. When examining the POD, we note that GNSS experiment provides an improvement for precipitation thresholds more than 15 mm, below this threshold, both experiments GNSS and CTRL are nearly identical. The FAR displays that GNSS experiment reduces the false detections for precipitation amounts larger than 20 mm. For thresholds below 20 mm, the two experiments produce very similar values except 15 mm for which GNSS slightly degrades the FAR. Finally, the ETS highlights an improvement for GNSS experiment for the highest thresholds (>15 mm). Elsewhere, the impact of GNSS assimilation is rather neutral with a slight improvement for the lowest thresholds (below 2 mm) and a slight degradation for 5 mm.
This neutral to negative impact for small-threshold precipitation accumulations was also found by former GNSS ZTD impact studies (Vedel and Huang, Citation2004; Macpherson et al., Citation2008).
5. Case study: 1 March 2018
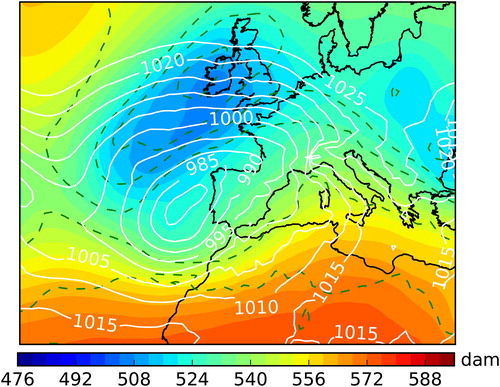
On 1 March 2018, Morocco was under the influence of an upper cold low pressure located South-West of the British Isles (). The surface was also characterized by a surface low pressure centered over the near Atlantic of Portugal. This configuration generates a rapid southwesterly flow transporting moist air mass from the Atlantic Ocean to the Centre and Northern Atlantic coastal regions of Morocco. This flow has undergone a forcing along the Anti-Atlas mountains (shown in ) leading to the formation of convective clouds. Thus, orographic precipitation formed over the Souss-Massa region (domain of interest displayed in ). The daily accumulated rainfall reached 91 mm in Amsekroud located in the East of Agadir city. This amount is above the 90th percentile climatological value of this region. Therefore, this precipitation could be considered as heavy according also to the knowledge of the local climate.
Fig. 7. European Centre for Medium-Range Weather Forecasts (ECMWF) analysis at 00:00 UTC on 1 March 2018: temperature (dashed lines) and geopotential heights (colors) at 500 hPa with mean seal level pressure (solid lines).
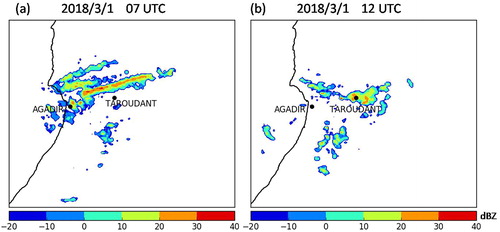
To show the spatial coverage of this studied rainy event, the reflectivity from the radar of Agadir city is shown in . At 06 UTC, the radar detects the presence of reflectivity cells on the northeastern of Agadir. Then the rain organised in the form of 3 bands, with a large and intense one located on the North of Taroudant. The maximum intensity is reached around 07:00–08:00 UTC. The cells start dissipating after 12:00 UTC.
Fig. 8. Maximum of reflectivity from the Agadir radar in dBZ on 1 March 2018 at 07 UTC (a), 12 UTC (b).
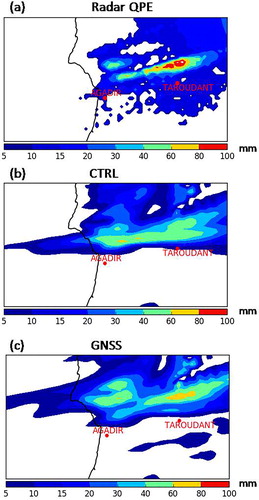
In order to assess the impact of the assimilation of GNSS ZTD on the forecast of the 1 March 2018 rainy event, the 24-hour accumulated precipitation of both experiments CTRL and GNSS are compared over Souss-Massa region. The comparison was performed against quantitative precipitation estimation (QPE) from radar derived amounts adjusted by rain gauges (Sahlaoui and Mordane, Citation2019). The latter shows a large band of intense precipitation on the North of Taroudant, reaching 100 mm and a narrow band above the large band on the North of Agadir (). Even if the CTRL experiment simulates the large band, the intensity is underestimated, and does not have the correct orientation (). The assimilation of GNSS ZTD observations helps to better locate this large band (). Furthermore, the precipitation amount is increased with maximum values reaching 80 mm. The narrow band of precipitation is present in the GNSS experiment, whereas, it is displaced to the South by CTRL experiment with underestimated amounts. The GNSS experiment simulates a third cell above the narrow band that is not captured by the radar QPE. Since the radar coverage is limited to the North by the presence of High-Atlas mountains it is therefore not possible to know if such cell is realistic.
Fig. 9. Twenty-four hours accumulated precipitation in mm from 1 March 2018 06 UTC to 2 March 2018 06 UTC, over Agadir radar coverage area for (a) radar QPE, (b) CTRL experiment and (c) GNSS experiment.
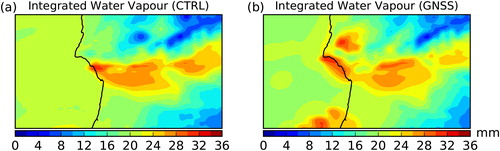
In order to investigate the reason of the positive impact of GNSS ZTD assimilation on the forecast of the 1 March 2018 heavy rainfall event, the modification of atmospheric humidity between CTRL and GNSS experiments has been examined. displays the Integrated Water Vapour (IWV) for the AROME-Morocco forecast valid at 08 UTC, 1 March 2018 when the heavy rainfall system was the most active. IWV is closely related to the ZTD as well as, it quantifies the tropospheric moisture. shows that the strong IWV cell located along the Atlantic coast North of Agadir was spread further in GNSS experiment with respect to CTRL. Furthermore, a cell of high values of IWV is present in GNSS experiment above this region.
Fig. 10. AROME-Morocco 8-hour forecast range valid at 08 UTC, 1 March 2018 for: integrated water vapour (in mm) from (a) CTRL experiment (b) GNSS experiment.
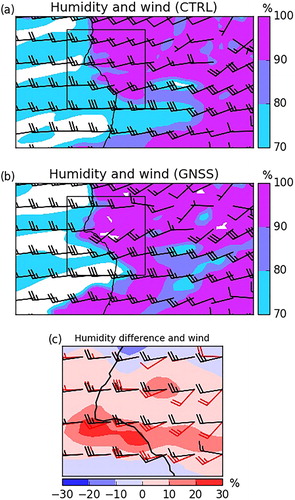
The 850 hPa relative humidity with wind field for CTRL and GNSS experiments, as well as differences between these parameters for the two experiments are displayed for 08 UTC, 1 March 2018 in . This figure shows that the 850 hPa relative humidity is increased up to 30% over the Western part of the domain over the Atlantic coast. In this region, the Westerly flow in CTRL experiment has been strengthened and changed direction to South-Westerly in GNSS experiment. This increase in the wind speed allows more inland advection of moist air from the Atlantic Ocean in GNSS experiment. Moreover, the South-Westerly flow in GNSS experiment reaches mountainous regions (), where it can acquire an additional vertical velocity. The increase in tropospheric moisture associated with the change in dynamics could explain the precipitation increase in GNSS run compared to CTRL run. This is consistent with the simulation of the narrow band of precipitation by GNSS experiment, in addition to the enhancement of the simulation of the large band of heavy rainfall amounts.
Fig. 11. AROME-Morocco 8-hour forecast range valid at 08 UTC, 1 March 2018 for: 850 hPa relative humidity (in %) and wind vector from (a) CTRL experiment (b) GNSS experiment. Panel (c) shows differences in the 850 hPa relative humidity valid at 08 UTC, 1 March 2018 between CTRL and GNSS (GNSS-CTRL), overlaid with the wind vectors of CTRL (black vectors) and GNSS (red vectors) with a zoom on the area represented by a square in panels (a) and (b).
6. Conclusions
In this study, the impact of GNSS ZTD observations within the 3D-Var data assimilation system of the mesoscale model AROME-Morocco (2.5 km of horizontal resolution) has been evaluated. The period of study covered 1-month from 20 February to 20 March 2018. The GNSS ZTD data have been provided by the Moroccan GNSS network together with IGS observations located over the domain AROME-Morocco domain (17 stations). The other observations assimilated into AROME-Morocco are SYNOP, TEMP, SHIP, BUOY, AIREP and AMSU data. First a single observation assimilation experiment has shown that the assimilation of GNSS ZTD data modifies the moisture field in the low to mid-troposphere with a maximum correction around 900 hPa. The scores computed for the 3-hour forecasts against radiosonde measurements over the period of interest reveal a reduction in terms of standard deviation errors for specific humidity in the low and mid-troposphere when GNSS ZTD are assimilated. A reduction in bias errors over the 0–24 hour forecast range is also noticed on 2 m relative humidity as verified against surface observations.
Objective verification of precipitation accumulation forecasts with rain gauge data over 1-month period gives mixed results. Improvements are found for high precipitation amounts when the GNSS ZTD observations are assimilated, but, the impact is rather neutral to negative for small threshold accumulations. The impact of the GNSS ZTD assimilation on the 1 March 2018 rainy event has been assessed. An improvement in both location and intensity of the rain cells has been noticed when assimilating GNSS ZTD. This improvement has been explained by an increase in IWV and more advection of moist air in low levels.
This first assessment of the assimilation of GNSS ZTD observations over Morocco has shown an overall positive impact despite the limited number of GNSS stations from the Moroccan network. These results are encouraging and consistent with previously published impact studies on GNSS ZTD observations. They show the interest in extending the network of GNSS stations over Morocco. It is suggested that more experiments should be conducted to investigate the impact of assimilating GNSS observations for different weather types and for other seasons, in order to confirm the soundness of our conclusions. Regarding the bias correction, the static scheme used in this study could be replaced by an adaptive scheme, which automatically calculates the bias as a function of specific predictors (Sánchez-Arriola et al., Citation2016; Lindskog et al., Citation2017). Another area currently under study concerns an improved exploitation of other GNSS observations. Indeed, besides ZTD, slant delays and horizontal gradients can provide additional information on the three dimensional water vapour field.
Acknowledgements
The authors thank Khalid Elrhaz for the meteorological analysis of the case study. We also thank Dr. Driss Bari for useful comments and suggestions which improve the manuscript and Zahra Sahlaoui for the preparation of radar QPE.
References
- Bennitt, G. V. and Jupp, A. 2012. Operational assimilation of GPS zenith total delay observations into the UK Met Office numerical weather prediction models. Mon. Wea. Rev. 140, 2706–2719. doi:10.1175/MWR-D-11-00156.1
- Bevis, M., Businger, S., Herring, T. A., Rocken, C., Anthes, R. A. and co-authors. 1992. GPS meteorology: remote sensing of atmospheric water vapor using the global positioning system. J. Geophys. Res. 97, 15787–15801. doi:10.1029/92JD01517
- Bock, O., Keil, C., Richard, E., Flamant, C. and Bouin, M. N. 2005. Validation of precipitable water from ECMWF model analyses with GPS and radiosonde data during the MAP SOP. Q. J. R. Meteorol. Soc. 131, 3013–3016. doi:10.1256/qj.05.27
- Brousseau, P., Berre, L., Bouttier, F. and Desroziers, G. 2011. Background-error covariances for a convective-scale data assimilation system: AROME-France 3D-Var. Q. J. R. Meteorol. Soc. 137, 409–422. doi:10.1002/qj.750
- Bubnová, R., Hello, G., Bénard, P. and Geleyn, J.-F. 1995. Integration of the fully elastic equations cast in the hydrostatic pressure terrain-following in the framework of the ARPEGE/ALADIN NWP system. Mon. Wea. Rev. 123, 515–535. doi:10.1175/1520-0493(1995)123<0515:IOTFEE>2.0.CO;2
- Courtier, P., Thépaut, J.-N. and Hollingsworth, A. 1994. A strategy for operational implementation of 4D-VAR using an incremental approach. Q. J. R. Meteorol. Soc. 120, 1367–1387. doi:10.1002/qj.49712051912
- Cucurull, L., Vandenberghe, F., Barker, D., Vilaclara, E. and Rius, A. 2004. Three-dimensional variational data assimilation of ground-based GPS ZTD and meteorological observations during the 14 December 2001 storm event over the Western Mediterranean area. Mon. Wea. Rev. 132, 749–763. > 2.0.CO;2. doi:10.1175/1520-0493(2004)132<0749:TVDAOG>2.0.CO;2
- Cuxart, J., Bougeault, P. and Redelsperger, J.-L. 2000. A turbulence scheme allowing for mesoscale and large-eddy simulations. Q. J. R. Meteorol. Soc. 126, 1–30. doi:10.1002/qj.49712656202
- Dach, R., Lutz, S., Walser, P. and Fridez, P. 2015. Bernese GNSS software version 5.2. User manual. Astronomical Institute, University of Bern, Switzerland, Bern Open Publishing.
- De Pondeca, M. and Zou, X. 2001. A case study of the variational assimilation of GPS Zenith Delay observations into a mesoscale model. J. Appl. Meteor. 40, 1559–1576. doi:10.1175/1520-0450(2001)040<1559:ACSOTV>2.0.CO;2
- Ducrocq, V., Ricard, D., Lafore, J.-P. and Orain, F. 2002. Storm-scale numerical rainfall prediction for five precipitating events over France: on the importance of the initial humidity field. Wea. Forecasting 17, 1236–1256. doi:10.1175/1520-0434(2002)017<1236:SSNRPF>2.0.CO;2
- Fouquart, Y. and Bonnel, B. 1980. Computation of solar heating of the earth’s atmosphere: a new parameterization. Beitr. Phys. Atmos. 53, 35–62.
- Gendt, G., Dick, G., Reigber, C., Tomassini, M., Liu, Y. and co-authors. 2004. Near real time GPS water vapor monitoring for numerical weather prediction in Germany. J. Meteorol. Soc. Jpn. 82, 370–391.
- Guerova, G., Jones, J., Douša, J., Dick, G., de Haan, S. and co-authors. 2016. Review of the state of the art and future prospects of the ground-based GNSS meteorology in Europe. Atmos. Meas. Tech. 9, 5385–5406. doi:10.5194/amt-9-5385-2016
- Hdidou, F. Z., Mordane, S. and Sbii, S. 2018. Global positioning systems meteorology over Morocco: accuracy assessment and comparison of zenith tropospheric delay from global positioning systems and radiosondes. Met. Apps. 25, 606–613. doi:10.1002/met.1725
- Knippertz, P., Christoph, M. and Speth, P. 2003. Long-term precipitation variability in Morocco and the link to the large-scale circulation in recent and future climates. Meteorol. Atmos. Phys. 83, 67–88. doi:10.1007/s00703-002-0561-y
- Kuo, Y.-H., Zou, X. and Guo, Y.-R. 1996. Variational assimilation of precipitable water using a nonhydrostatic mesoscale adjoint model. Part I: Moisture retrieval and sensitivity experiments. Mon. Wea. Rev. 124, 122–147. doi:10.1175/1520-0493(1996)124<0122:VAOPWU>2.0.CO;2
- Lac, C., Chaboureau, J.-P., Masson, V., Pinty, J.-P., Tulet, P. and co-authors. 2018. Overview of the Meso-NH model version 5.4 and its applications. Geosci. Model Dev. 11, 1929–1969. doi:10.5194/gmd-11-1929-2018
- Lafore, J. P., Stein, J., Asencio, N., Bougeault, P., Ducrocq, V. and co-authors. 1998. The meso-NH atmospheric simulation system. Part I: adiabatic formulation and control simulations. Ann. Geophys. 16, 90–109. doi:10.1007/s00585-997-0090-6
- Lindskog, M., Ridal, M., Thorsteinsson, S. and Ning, T. 2017. Data assimilation of GNSS zenith total delays from a Nordic processing centre. Atmos. Chem. Phys. 17, 13983–13998. doi:10.5194/acp-17-13983-2017
- Macpherson, S. R., Deblonde, G., Aparicio, J. M. and Casati, B. 2008. Impact of NOAA ground-based GPS observations on the Canadian regional analysis and forecast system. Mon. Wea. Rev. 136, 2727–2746. doi:10.1175/2007MWR2263.1
- Mahfouf, J. F., Ahmed, F., Moll, P. and Teferle, N. F. 2015. Assimilation of zenith total delays in the AROME France convective scale model: a recent assessment. Tellus A 67, 26106. doi:10.3402/tellusa.v67.26106
- Masson, V. 2000. A physically-based scheme for the urban energy budget in atmospheric models. Bound. Layer Meteorol. 94, 357–397. doi:10.1023/A:1002463829265
- Masson, V., Le Moigne, P., Martin, E., Faroux, S., Alias, A. and co-authors. 2013. The SURFEXv7.2 land and ocean surface platform for coupled or offline simulations of earth surface variables and fluxes. Geosci. Model Dev. 6, 929–960. doi:10.5194/gmd-6-929-2013
- Mlawer, E. J., Taubman, S. J., Brown, P. D., Iacono, M. J. and Clough, S. A. 1997. Radiative transfer for inhomogeneous atmospheres: RRTM, a validated correlated-k model for the longwave. J. Geophys. Res. 102, 16663–16682. doi:10.1029/97JD00237
- Noilhan, J. and Mahfouf, J.-F. 1996. The ISBA land surface parameterization scheme. Glob. Planet. Change 13, 145–159. doi:10.1016/0921-8181(95)00043-7
- Pinty, J.-P. and Jabouille, P. 1998. A mixed-phased cloud parameterization for use in a mesoscale non-hydrostatic model: Simulations of a squall line and of orographic precipitation. Preprints, In: Conference on Clouds Physics, Everett, WA, Amer. Meteor. Soc., 217–220.
- Poli, P., Moll, P., Rabier, F., Desroziers, G., Chapnik, B. and co-authors. 2007. Forecast impact studies of zenith total delay from European near-real-time GPS stations in Meteo-France 4D-Var. J. Geophys. Res. 112, D06114.
- Saastamoinen, J. 1972. Contributions to the theory of atmospheric refraction. Bull. Geodesique. 105, 279–298. doi:10.1007/BF02521844
- Sahlaoui, Z. and Mordane, S. 2019. Radar rainfall estimation in Morocco: quality control and gauge adjustment. Hydrology 6, 41. doi:10.3390/hydrology6020041
- Sánchez-Arriola, J., Lindskog, M., Thorsteinsson, S. and Bojarova, J. 2016. Variational bias correction of GNSS ZTD in the HARMONIE modeling system. J. Appl. Meteor. Climatol. 55, 1259–1276. doi:10.1175/JAMC-D-15-0137.1
- Seity, Y., Brousseau, P., Malardel, S., Hello, G., Bénard, P. and co-authors. 2011. The AROME-France convective-scale operational model. Mon. Wea. Rev. 139, 976–991. doi:10.1175/2010MWR3425.1
- Smith, E. K. and Weintraub, S. 1953. The constants in the equation for the atmospheric refractive index at radio frequencies. Proc. IRE 41, 1035–1037. doi:10.1109/JRPROC.1953.274297
- Termonia, P., Fischer, C., Bazile, E., Bouyssel, F., Brožková, R. and co-authors. 2018. The ALADIN system and its canonical model configurations AROME CY41T1 and ALARO CY40T1. Geosci. Model Dev. 11, 257–281. doi:10.5194/gmd-11-257-2018
- Vedel, H. and Huang, X. 2004. Impact of ground based GPS data on numerical weather prediction. JMSJ. 82, 459–472. doi:10.2151/jmsj.2004.459
- Yan, X., Ducrocq, V., Jaubert, G., Brousseau, P. and Poli, P. and co-authors. 2009. The benefit of GPS zenith delay assimilation to high-resolution quantitative precipitation forecasts: a case-study from COPS IOP9. Q. J. R. Meteorol. Soc. 135, 1788–1800. doi:10.1002/qj.508
- Zou, X. and Kuo, Y. H. 1996. Rainfall assimilation through an optimal control of initial and boundary conditions in a limited-area mesoscale model. Mon. Wea. Rev. 124, 2859–2882. doi:10.1175/1520-0493(1996)124<2859:RATAOC>2.0.CO;2