
 ?Mathematical formulae have been encoded as MathML and are displayed in this HTML version using MathJax in order to improve their display. Uncheck the box to turn MathJax off. This feature requires Javascript. Click on a formula to zoom.
Abstract
Here we provide statistically significant observational evidence that a feedback control system moderating atmospheric temperature is presently operating coherently at global scale. Further, this control system is of a sophisticated type, involving the corrective feedback not only of a linear error term but also its derivative and its integral. This makes it of the same type as the most widely used control system developed by humans, the proportional-integral-derivative (PID) control system.
1. Introduction
In Leggett and Ball (Citation2015) we showed that the three major climate time series – those for atmospheric pressure (using the example of the Southern Oscillation Index (SOI)), global surface temperature, and the level of atmospheric CO2 – showed a high level of statistical significance in correlation to each other when expressed as the level of SOI, the first-difference of temperature and the second difference of CO2.
These series can be demonstrated to relate to each other in the same way as the three terms in the most widely used industrial control system – the PID (proportional–integral–derivative) control system (Åström and Murray, Citation2008).
We demonstrate this as follows. Figure 7 of Leggett and Ball (Citation2015) depicted the three series – temperature, SOI and CO2 -in first-difference, level, and second-difference form respectively. The equivalent of these terms in the terminology of calculus is derivative, level, and second derivative. Raising each of these terms by one level of integration, we obtain level, integral, and derivative. Expressed in control system terms, these terms become Proportional, Integral, and Derivative (PID).
Based on these findings, we develop a quantitative hypothesis. The hypothesis is that the global temperature time series can be formally characterised as one influenced by a PID control system.
In this paper, we firstly describe the main features of our hypothesis. We then show the results of our tests of its validity.
A control system of PID form influencing global surface temperature has previously been proposed theoretically. Nisbet et al. (Citation2012) wrote, concerning photosynthesis:
, modelled on industrial PID (proportional–integral–derivative) controllers, illustrates the way natural selection, acting on rubisco specificity, may have managed the surface temperature, at least in the past ∼2.3 Ga since the air became oxygen-rich. The ‘optimum’ temperature is the temperature at which the contemporaneous (at that ‘present’) global biosphere has maximum productivity. If an external perturbation occurs, such as a volcanic eruption or solar warming, then there will be a proportional response as photosynthesis and respiration increase/decrease or decrease/increase, taking up or releasing CO2. Methane too will change, especially as temperature change affects water precipitation in rain and snow.
This paper, then, seeks evidence for the existence and operation of a control system of PID type affecting global-level atmospheric surface temperature. In describing our hypothesis, we first seek to conceptualise the formal control system terms from the perspective of a putative control system for global surface temperature.
Once this is achieved, the control system is characterised using observed time series, and subsequently tested both for the full PID type of control system and also, for comparison, for simpler versions using subsets of the P, I and D terms.
The remainder of this section reviews control systems in general, explains the concept of a global level atmospheric temperature control system, and then considers how to test hypotheses relating to such a global level control system.
Control systems are in widespread everyday use, from the cruise control in a motor vehicle to the thermostat used for building heating/air-conditioning systems, among many other applications. In a control system a controller is used to automatically adjust a controller output so as to hold the trend over time of the variable of interest (termed the process variable) at its setpoint (Åström and Murray, Citation2008). The setpoint is the value of the preferred level for the process variable time series. A factor driving the process variable away from its setpoint is termed a disturbance. The error is defined as the difference between the level of the setpoint and the level of the disturbance.
To describe the building thermostat in these terms, the thermostat is the controller, the actual room temperature is the process variable, the desired room temperature is the setpoint, the activation signal to the air conditioner or heater is the controller output, and random heat sources (such as radiant heat from sunshine and warm bodies, or radiant cooling through windows) constitute the disturbances to the process (VanDoren, Citation1998).
The most widely used general-purpose controller uses a control-loop feedback mechanism. In this, it has been found that feeding back the derivative and the integral of the error term as well as the level of the error term gives more accurate control than simply feeding back the error term. These two extra terms reduce the problems of overshoot and undershoot of the variable being controlled. Based on the nature of the three feedback terms used, this control system is called a proportional-integral-derivative (PID) controller (Araki, Citation2002; Åström and Murray, Citation2008).
This information can be translated to the question of a control system for the atmospheric temperature as follows.
A way to determine whether or not an air conditioning system was present in a room without observing any equipment, would be to observe the process variable time series (the temperature time series). This should show signs of the disturbance (an increasing outside temperature) starting to make the room temperature rise and then the various possible elements (P and/or I, and/or D) of the control system acting such that the room temperature did not follow the disturbance but stayed closer to the setpoint. The signature of the effect of these elements should be seen in the time series record of the temperature of the room.
Hence the observer could determine not only whether there was a temperature control system present, but also which type it was likely to be – full PID or a simpler model made up of a subset of P, I or D terms. In time series analysis terms, the time series model selection process can show which of the combinations of P, I and D terms fits best with the temperature time series observed (or that there are no fits).
If there is an air conditioning system influencing the room temperature, this approach can provide strong evidence for its existence, and its type, even though the air conditioning system itself has not been seen.
This approach is in line with Machamer et al. (Citation2000) who make the case that ‘mechanisms are entities and activities’, that is, not just physical entities. Given the activity aspect, one does not need to discover an entity to make the point that there is evidence of a mechanism operating. Further, there is a difference between knowing that there is a mechanism operating and knowing how that mechanism works. Indeed with regard to the question of a control system, we can detect control in system behaviour even if we do not have insight into the entities or the activities by which that control is achieved.
If there are features of the process variable that change in ways that can best be explained by the operation of a control mechanism, then this would provide sufficient evidence for the existence of a control system. In other words, we would be seeking evidence for the existence of a mechanism based on system behaviour as a whole.
With this background, and using statistical analysis of time series of global surface temperature observations, the hypothesis explored in this paper is to see if the global atmospheric surface temperature time series can be formally characterised as one influenced by a PID control system. This is carried out, as in the example above, by using time series analysis and its model selection process to determine which, if any, of the combinations of P, I and D control system terms fit best with the observed time series for global atmospheric surface temperature.
2. Methods
Statistical methods used are standard (Greene, Citation2012) and generally as used in Leggett and Ball (Citation2015). Categories of methods used are: normalisation; differentiation (approximated by differencing); integration (approximated by the cumulative sum); and time-series analysis. Within time-series analysis, methods used are: Z-scoring; smoothing; leading or lagging of data series relative to one another to achieve best fit; testing for the order of integration of each series (a prerequisite for using data series in time-series analysis); dynamic regression modelling to include autocorrelation in models; and ridge regression to address collinearity. These methods will now be described in turn.
2.1. Z-scoring of series
To make it easier to visually assess the relationship between the variables, the data were normalised using statistical Z scores or standardised deviation scores (expressed as ‘relative level’ in the figures). In a Z-scored data series, each data point is part of an overall data series that sums to a zero mean and variance of 1, enabling comparison of data having different native units. Hence, when several Z-scored time series are depicted in a graph, all the time series will closely superimpose, enabling visual inspection to clearly discern the degree of similarity or dissimilarity between them. Individual figure legends contain details on the series lengths used as base periods for the Z-scoring.
A regression using Z-scored variables provides standardised regression coefficients. These coefficients report how much change a one-standard-deviation change in the independent variable produces in the dependent variable. Although comparisons between these coefficients must be interpreted with care, a standardised coefficient for independent variable a, for example, of 2 indicates that independent variable a is twice as influential upon the dependent variable as another independent variable that has a standardised coefficient of 1 (Allen, Citation1997).
In the time-series analyses, global atmospheric surface temperature is the dependent variable. We tested the relationship between this variable and independent variables derived from (1) the level of atmospheric CO2; (2) its change; and (3) its cumulative sum. We express the change in CO2 as its first finite difference (we label this ‘first difference’ in the text). Variability is explored using intra-annual (monthly) data. The period covered in the figures is shorter than that used in the data preparation because of the loss of some data points due to calculations of differences and of moving averages.
2.2. Smoothing
Smoothing was used on series incorporating first-difference CO2 to the degree needed to reveal significant relationships if any were present. Smoothing is carried out initially by means of a 13-month moving average – this also minimises any remaining seasonal effects. In the following analyses, as for Leggett and Ball (Citation2015), it is found that the d_CO2 (D_error) term fits the regression best when smoothed by a 13-month moving average.
2.3. Leading or lagging
Variables are led or lagged relative to one another to achieve best fit. These leads or lags were determined by means of time-lagged correlations (correlograms). The correlograms were calculated by shifting the series back and forth relative to each other, one month at a time.
2.4. Labelling data series
With this background, the convention used in this paper for unambiguously labelling data series and their treatment after smoothing or leading or lagging is depicted in the following example:
The atmospheric CO2 series is transformed into its first difference and smoothed with a 13-month moving average. The resultant series is then Z-scored using the period November 1958 to December 1976 as a base. The resulting series is expressed as 13mma_d_CO2_Z5876. (As in Leggett and Ball (Citation2015) we found that this smoothed series fitted temperature best with a one month lead.)
Note that to assist readability in text involving repeated references, atmospheric CO2 is sometimes referred to simply as CO2 and global surface temperature as temperature.
2.5. Time series analysis
Time series models differ from ordinary regression models in that the results are in a sequence. Hence, the dependent variable is influenced not only by the independent variables, but also by prior values of the dependent variable itself. This is termed autocorrelation between measured values. This serial nature of the measurements must be addressed by careful examination of the lag structure of the model. This type of ordinary least squares regression is termed ‘time series analysis’ (Greene, Citation2012).
A further issue in time series analysis concerns what is termed the ‘order of integration’ of each of the series used. Greene (Citation2012) states: ‘The series yt is said to be integrated of order one, denoted I(1), because taking a first difference produces a stationary process. A non-stationary series is integrated of order d, denoted I(d), if it becomes stationary after being first-differenced d times. An I(1) series in its raw (undifferenced) form will typically be constantly growing, or wandering about with no tendency to revert to a fixed mean’.
The usual tests for stationarity (for example, the ADF test) can allow for the presence of a linear deterministic trend in the time-series in question, but they cannot allow for the possibility of a polynomial trend. It will be shown that this possibility needs to be tested for in this study.
There is evidence that if a unit root test that allows for only a linear trend is applied mistakenly to a series with a polynomial trend, then the test may have extremely low power. For example, see the results of Harvey et al. (Citation2008) in the context of the de-trended ADF-type tests of Elliott et al. (Citation1996).
This problem may be resolved by using the Lagrange multiplier (LM) unit root test(s) proposed by Schmidt and Phillips (Citation1992). These tests make explicit allowance for the possibility of a polynomial deterministic trend of order up to 4 in the series under test. As with the ADF test, the null hypothesis is that the series has a unit root, and the alternative hypothesis is that it is stationary. A value for the LM test statistic that is more negative than the tabulated critical value leads to a rejection of the null hypothesis, and suggests that the series is stationary.
The Schmidt-Phillips test is available in the urca package in the R statistical software (R Development Core Team, Citation2009) and is described in the documentation by Pfaff et al. (Citation2016). Specifically, the ur.sp-class allows us to apply the Schmidt-Phillips tests. Although there are two such tests, the so-called τ test and the ρ test, the results of only the former test are reported. (The results of the ρ test in our models led to exactly the same conclusions.) Testing is reported at the 1% significance level, but the results are not sensitive to this choice.
Next, a model must be established in which any autocorrelation in the short-run relationship, if present, is fully accounted for by use of an optimal lag structure. In this study, this is done within the modelling process by reference to the adjusted coefficient of determination, R2, and to the Akaike Information Criterion.
The adjusted R2 is used because there is a problem that the unadjusted R2 cannot fall when, in multiple regression, independent variables are added to a model so there is a built-in tendency to add more independent variables to the model (Greene, Citation2012). To address this issue, the adjusted R2 is a fit measure that penalises the loss of degrees of freedom that result from adding variables to the model. There is, however, some question about whether the penalty is sufficiently large to ensure that the criterion will necessarily lead the analyst to the correct model as the sample size increases (Greene, Citation2012). Several alternative fit measures termed ‘information criteria’ have been developed. Several criteria are available for selection within the Eviews ARDL method. We use the ARDL default criterion, the Akaike Information Criterion.
Pesaran et al. (Citation2001) point out that ARDL modelling is ‘also based on the assumption that the disturbances … are serially uncorrelated. It is therefore important that the lag order p of the underlying VAR is selected appropriately. There is a delicate balance between choosing p sufficiently large to mitigate the residual serial correlation problem and, at the same time, sufficiently small so that the conditional ECM is not unduly over-parameterized, particularly (when) limited time series data … are available’.
To avoid over-parameterisation, we seek the model with the fewest lags that produces a model with no autocorrelation (out to 36 lags).
The specific information sought from each well-specified ARDL model is the effect on the dependent variable of each of the potential driving variables, the relative percentage of the total driving task that each achieves, and the degree of statistical significance of each.
The ARDL econometric model used here was that implemented in the Eviews 9.5 package (IHIS Eviews, 2017). The time series statistical software package Gnu Regression, Econometrics and Time-series Library (GRETL, Citation2018) was also used.
2.6. Collinearity
Intrinsic to its design, a control system which involves some or all of proportional, integral and derivative feedback terms creates a problem for its analysis by means of ordinary least squares (OLS) econometric time-series methods. The problem is that one independent variable, the proportional (linear) error (P error) variable (albeit displaying by design the opposite sign) will be exactly collinear with another variable – the Disturbance variable.
On collinearity (interdependency), Farrar and Glauber (1964) write:
The single equation, least squares regression model is not well equipped to cope with interdependent explanatory variables. In its original and most simple form the problem is not even conceived. Values of X are presumed to be the pre-selected controlled elements of a classical, laboratory experiment. Least squares models are not limited, however, to simple, fixed variate – or fully controlled – experimental situations. (Other situations) may provide the data on which perfectly legitimate regression analyses are based.
Hastie et al. (Citation2009, p. 51) write:
The Gauss–Markov Theorem: One of the most famous results in statistics asserts that the least squares estimates of the parameters β have the smallest variance among all linear unbiased estimates. We … make clear that the restriction to unbiased estimates is not necessarily a wise one.
On a problem arising from OLS based on the Gauss–Markov theorem, Greene (Citation2012, p. 129) writes:
…the Gauss–Markov theorem states that among all linear unbiased estimators, the least squares estimator has the smallest variance. Although this result is useful, it does not assure us that the least squares estimator has a small variance in any absolute sense. Consider, for example, a model that contains two explanatory variables and a constant. … If the two variables are perfectly correlated, then the variance is infinite.
The problem is that variance being infinite means that standard OLS packages will not run.
Looking to solutions for this problem, Hastie et al. (Citation2009, p. 51) write:
The Gauss-Markov theorem implies that the least squares estimator has the smallest mean squared error of all linear estimators with no bias. However, there may well exist a biased estimator with smaller mean squared error. Such an estimator would trade a little bias for a larger reduction in variance.
…most models are distortions of the truth, and hence are biased; picking the right model amounts to creating the right balance between bias and variance.
Biased estimates are commonly used. Any method that shrinks or sets to zero some of the least squares coefficients may result in a biased estimate. (These include) variable subset selection and ridge regression…
On variable subset selection, Greene (Citation2012, p. 131) writes: ‘The obvious practical remedy (and surely the most frequently used) is to drop variables suspected of causing the problem from the regression…’ This is one method that is used in what follows.
Ridge regression takes another approach to reducing a variance that would otherwise be infinite, by introducing bias in a controlled way into the regression. This enables the variables in question to stop displaying infinite variance, and so the assessment of the performance of a model including the full set of independent variables is possible.
Ridge regression (Hoerl, Citation1962; Birkes and Dodge, Citation1993) is one member of a family of methods that achieve this by imposing a penalty on (‘shrinking’) the size of relevant least squares coefficients. In this study, the GRETL ridge regression function is used (Schreiber, Citation2017). This method requires an optimal shrinkage parameter (ridge constant or lambda) to be determined. This is done by use of a ridge trace process (Hoerl and Kennard, Citation1970) in which estimated coefficients are compared against a range of shrinkage parameters in order to seek the most favourable trade-off of bias against precision of the estimates (inverse variance).
2.7. Data
For global surface temperature, we used the Hadley Centre–Climate Research Unit combined Landsat and SST surface temperature series (HadCRUT) version 4.6.0.0 (Morice et al., Citation2012). In the tables, figures and text in the paper, this series is termed ‘global surface temperature’. For atmospheric CO2 data from 1958 to the present, the US Department of Commerce National Oceanic and Atmospheric Administration Earth System Research Laboratory Global Monitoring Division Mauna Loa, Hawaii, annual CO2 series is used (Keeling et al., Citation2009). In the paper, this series is termed ‘atmospheric CO2’.
In the analyses, monthly data is used. The period covered in the figures is sometimes shorter than that used in the data preparation because of the loss of some data points due to calculations of differences and of moving averages.
We note that to assist readability in text involving repeated references, atmospheric CO2 is sometimes referred to simply as ‘CO2‘ and global surface temperature as ‘temperature’. The period covered by the time series used in each table or figure is given in the title of the table or figure.
In the tables of results, statistical significance at the 10%, 5% and 1% levels is indicated by the symbols *, ** and ***, respectively.
3. Results
In , relevant terms from climate science (IPCC, Citation2013) are matched to terms for control systems (Åström and Murray, Citation2008). In this study, the control system process variable is specified as global surface temperature. Next, given it is accepted that the main driver of temperature is atmospheric CO2 (IPCC, Citation2013), if levels of the driver of temperature change markedly, this can, if nothing intervenes, cause perturbation of temperature. So in what follows, we will use the time series for the level of CO2 to represent the control system term disturbance.
Table 1. Terms from climate science matched to control system terms.
After Åström and Murray (Citation2008), and as shown in , the error term determined by the control system is equal to the setpoint minus the disturbance.
As stated above, feedback control systems derive an error term or terms which are fed back as reactions to disturbances to the system, with the aim of keeping the system at its previously determined setpoint (Åström and Murray, Citation2008).
We therefore express this relationship in terms of an equation as:
(1)
(1)
With regard to controller terminology, this is equivalent to:
(2)
(2)
For simplicity in what follows we will use the expression in EquationEq. 1(1)
(1) . For a temperature control system, then, EquationEq. 1
(1)
(1) becomes:
(3)
(3)
If the temperature control system does not reach its setpoint temperature, this can be expressed as:
(4)
(4)
Specifically regarding EquationEqs. 3(3)
(3) and Equation4
(4)
(4) , in this study we might seek to correlate the sought outcome (dependent) variable, setpoint, with the disturbance variable and the three P, I and D error variables. However as the P_error time series by definition is the precise opposite mathematically of the Disturbance time series, this would result in the setpoint being equal to the Disturbance plus P_error, leaving no role for I_error and D_error.
However it can be argued that the complexity of having I and D controller outputs in ‘real world’ control systems, such as industrial control systems, is entirely because real world control is not as simple as setpoint being equal to Disturbance minus P_controller_output.
What we therefore use as the outcome variable is not the setpoint temperature, but the real world result of the attempt of the system to seek and attain the setpoint temperature – this is the observed global surface temperature. Further, if a PID system is operating, signatures of the effect of each of its P, I and D controller output variables on the disturbance variable – in seeking to achieve the setpoint outcome – should be discernable in the observed temperature series.
Because in this instance the setpoint equals zero due to Z-scoring, the error term simply becomes zero minus disturbance, which is equal to ‘minus disturbance’.
The I and D error terms are derived from the P error term as the cumulative sum of the disturbance series and the first difference of the disturbance series respectively.
The black curve in shows the disturbance to temperature, that is, the level of atmospheric CO2. We do not know the actual setpoint of the putative control system. However, the level of CO2 (disturbance) curve is steadily rising (that is, the level of disturbance is increasing). Hence, any point towards the start of the data series must be closer to the level of the temperature setpoint. We therefore choose a value for the setpoint (i) earlier in the time period, and (ii) as the average of a period over which the temperature was roughly level. This is taken to be the period from the start of data in November 1958 to December 1976. All curves in the figure are therefore Z-scored using this period as the base period. This enables us to see any points of departure thereafter. If there is no change in relationships between the curves, their trajectories will remain common after 1976, just as they were before. The setpoint is shown as the purple line. The observed temperature is also plotted (red curve).
Fig. 1. Monthly data, Z-score base period November1958-December 1976 (period to left of vertical black line). Putative control system model for global surface temperature, selected elements: Disturbance (level of atmospheric CO2) (black curve); control system setpoint for temperature (purple line); observed temperature (red curve).
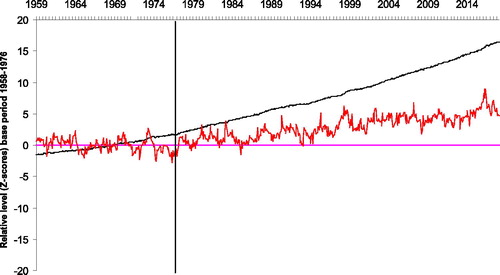
From it can be seen that in the period from 1976 onward, the disturbance curve has risen above the setpoint value selected. The observed temperature has also risen above the setpoint since 1976, but has stayed nearer to the setpoint than might be predicted from the disturbance.
adds the P, I and D error terms to the above curves.
Fig. 2. Monthly data, Z-score base period November 1958 - December 1976 (period to left of vertical black line). Putative control system model for global surface temperature, full set of elements: Disturbance (level of atmospheric CO2) (black curve); control system setpoint for temperature (purple line); observed temperature (red curve); level of control system error (P_error) (green curve); integral (cumulative sum) of control system error (I_error) (orange curve); derivative (first difference) of control system curve (D_error) (brown curve).
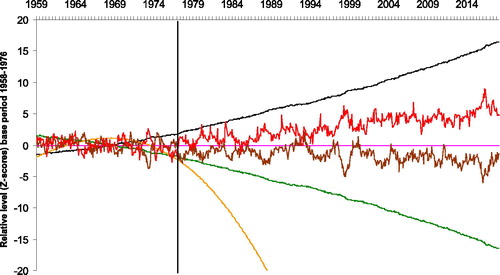
As expected, shows that each error term, if applied, would tend to lower the temperature below that implied from the trend of the disturbance.
We now turn to the time series analysis of the relationship of global surface temperature to this putative control system and its proportional, integral and derivative feedback components.
First we assess the order of integration of the series used.
For each series, displays the results of tests for stationarity, allowing for both drift and trend.
Table 2. Results of ADF tests for stationarity, allowing for both drift and trend.
shows that all series are stationary.
As all series are stationary, OLS can be used for regression analysis, with ARIMA dynamic regression analysis used for any autocorrelation detected.
Both ridge regression and ARDL dynamic regression results are provided. provide ridge regression and ARDL results for the relationship of the putative PID control system with temperature.
Table 3. Putative PID control system: ridge regression results.
Table 4. Eviews ARDL estimation output for period November 1958 to February 2018 for temperature as a function of putative control system P_error, I_error and D_error: short-run model dynamic relationship.
Table 5. Eviews ARDL estimation output for period November 1958 to February 2018 for temperature as a function of putative control system P_error, I_error and D_error: short-run model independent variables.
All three P, I and D terms display coefficients of the same order of magnitude in the ridge regression.
To gain information on statistical significance, we now turn to enabling standard OLS by means of the variable subset selection method. The collinear variable deleted to produce the subset is Disturbance. Dynamic OLS regression is then conducted using the ARDL package.
Although the significance of the I–error term is only at the 0.1 level, all three P, I and D terms are significant in the model.
It is still possible, however, that other control system models using only one of P, I, or D, or PI or PD terms might display even better fits. The same assessment process as above was carried out for these models and the results are shown in and .
Fig. 3. Fit with observed temperature of global surface temperature predicted from dynamic regression models involving various combinations of control system error terms. The PID model shows the best fit (highest Coefficient of Determination (R-squared) and lowest Akaike Information Criterion).
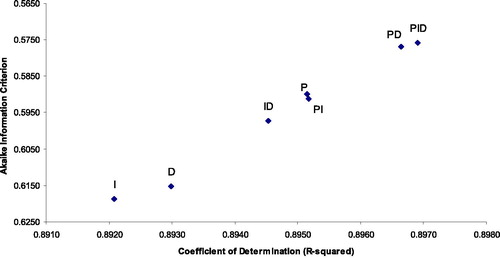
Table 6. Fit with observed temperature of global surface temperature predicted from dynamic regression models involving various combinations of control system error terms.
and show that, against the other models, a model involving all three P, I, and D control outputs displays the highest R-squared value, and the best (lowest) Akaike Information Criterion value. This is evidence that the control system is a full PID control system, rather than one using fewer control outputs.
To see the effect of the control system over time, we now return to the series that was Z-scored over the earlier part of the model (1958 to 1976) as in and .
These results are depicted in .
Fig. 4. Monthly data, Z-score base period November 1958 - December 1976 (period to left of vertical black line). Predicted temperature from dynamic regression model of a control system for global surface temperature using P, I and D error terms (green curve); Disturbance to temperature (level of atmospheric CO2) (black curve); observed temperature (red curve).
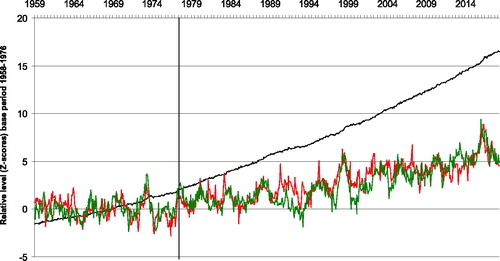
The figure shows that there is a close match between the temperature expected from the control system model (green curve) and the observed temperature (red curve). This is the case especially when compared to an alternative falsifying null hypothesis of ‘no control system’, which would lead to an expectation that the disturbance driver (black curve) would be closely followed.
, then, provides support for the hypothesis of a control system, and no support for a falsifying prediction of the absence of a control system.
4. Discussion
As background to this discussion, we have made the case that, because we are investigating a putative control system, we cannot know (i) its purpose, and therefore (ii) its setpoint.
We did, however, have a putative dimension to be controlled (global surface temperature) and a disturbance (CO2 levels trending higher than their previous longer-term average).
Given that we did not know the setpoint, we proposed that the variable to use for the outcome of the putative control system was best couched in terms of the real world result of the attempt of the putative system to meet the setpoint temperature – the observed global surface temperature. If there is a control system operating, the resulting global surface temperature should show signs of the operation of some or all of the control system P, I, and D feedbacks.
Similarly, we proposed that it is reasonable to consider that the temperature observed early in the time series when the disturbance was of lower magnitude to be nearer to the setpoint. As a result we used that observed temperature to represent the setpoint.
We consider the results from the investigation, including these concepts and using observed data at global scale, to show precisely those signs of the operation of the P, I, and D dimensions, revealed as highly statistically significant relationships of PID form. We believe that this result is both comprehensive and suggestive (and perhaps even diagnostic) of the existence of a control system presently operating at global scale on global surface temperature.
The question arises as to a candidate for this planet-scale control system mechanism.
We do not intend to attempt to rule out any candidate, but simply to note some of the factors which may pertain to further research in order to narrow down such candidates.
Our initial point of reference is that all control systems use negative feedback (Åström and Murray, Citation2008). While not all negative feedback implies the existence of a control system, we nonetheless start with a wide initial scan by listing the accepted types of negative feedback operating on global surface temperature (Beerling and Berner, Citation2005; IPCC, Citation2013). We then narrow the candidates down based on the match to the displayed attributes of our control system.
To start with, one can distinguish two temporal domains in the global carbon cycle (IPCC, Citation2013). The first is the fast domain. This displays large exchange fluxes of temperature and carbon in the atmosphere, the ocean, surface ocean sediments and on land in vegetation, soils and freshwaters. Change times range from seconds to a few years for the atmosphere, to decades to millennia for the major carbon reservoirs of the land vegetation and soil and the various domains in the ocean.
A second, slow domain consists of the extensive carbon stores in rocks and sediments which exchange carbon with the fast domain through volcanic emissions of CO2, chemical weathering, erosion and sediment formation on the sea floor. Turnover times of the (mainly geological) reservoirs of the slow domain are typically 10,000 years or longer.
The degree of match of negative feedback candidates to our control system is primarily based on the estimated capacity of each candidate to match the large interannually changing temporal dynamics of our model.
In the assessment, the negative feedbacks are also classified as abiotic or biotic.
Sources of negative feedback that lead to a reduction in global atmospheric surface temperature, listed in order of capacity to generate large interannually changing temporal dynamics, are as follows (Beerling and Berner, Citation2005; IPCC, Citation2013):
Abiotic rock weathering. This is the removal of CO2 by the weathering of silicate and carbonate minerals (Berner et al., Citation1983; Archer et al., Citation2009; IPCC, Citation2013). This occurs on time scales from thousands to tens of thousands of years.
Biotic (plant-accelerated) rock weathering. Accelerated breakdown (by factors of 2 to 10) of nutrient-containing silicate minerals (Lenton et al., Citation2012).
Ocean (via CO2 uptake from atmosphere and as sink of heat from atmosphere) (IPCC, Citation2013).
Increased emission of energy from Earth into space through long wave radiation as surface temperature increases (sometimes also referred to as blackbody radiation feedback) (IPCC, Citation2013).
Clouds: via (i) abiotic evaporation from the ocean and (ii) evapotranspiration (which is dominated by plants) from land (IPCC, Citation2013).
Land biosphere (displays a range of means of reducing temperature either by reducing atmospheric CO2 through CO2 uptake or by reducing temperature directly). According to Prentice et al. (Citation2015), terrestrial CO2 uptake is a biological process involving the chemical transformation of CO2 into organic compounds by means of photosynthesis. Increasing CO2 concentration enhances primary production (an effect known as CO2 fertilisation). The build-up of decomposing soil organic matter also keeps CO2 from the atmosphere. Plants also use water more efficiently at higher CO2 concentrations, because their stomata tend to close, resulting in reduced water loss per unit leaf area and further photosynthesis enhancement.
Other, smaller, negative feedbacks involving the biosphere are: increasing emissions of biogenic volatile organic compounds (BVOCs) from plants (these would tend to increase the production of secondary organic aerosols (SOA), which have a net cooling effect); changes in marine dimethyl sulfide (DMS) emissions (DMS is a precursor of cloud condensation nuclei, with a net cooling effect that could act as a negative feedback in the climate system) (Prentice et al., Citation2015). Increased evapotranspiration from plants can also theoretically increase low elevation cloudiness, which increases planetary albedo and thus reduces atmospheric temperature (Ban-Weiss et al., Citation2011).
We now consider the capacity of these negative feedbacks to match the temporal dynamics of our model. In considering these dynamics, we stress that these do not include seasonal effects: these have been filtered out in the preparation of the data (see Methods).
Because both biotic and abiotic rock weathering are slow domain, they would lack temporal dynamics rapid enough to correlate with our findings. Rock weathering would therefore seem to complement our findings, rather than be alternative explanations for them.
The remaining abiotic negative feedbacks are: heat and CO2 sink attributes of the ocean; increased emission of energy from Earth into space through long wave radiation; and cooling from increased cloud cover. Cloud cooling, in its abiotic form, can come about in direct response to temperature through an increase in surface temperature which increases evaporation, leading to an increase cloud cover, hence reflecting sunlight back to space, and thereby lessening the effect of global warming. The feedbacks of increased long wave radiation, ocean effects, and cloud cooling in its abiotic form are all fast domain – at the same temporal scale as our results. The six biotic negative feedback sources are also fast domain, and hence at the same temporal scale as our results.
That said, all of these negative feedbacks come about in direct response to temperature. Such negative feedbacks, while not being the P term of a control system, would resemble one. This situation, however, would leave unexplained patterns which look like the I and D terms of a control system such as that for which we present evidence.
So it would seem that our I and D findings suggest that a PID control system could exist even given the fast domain negative feedbacks listed above, and that such a PID control system could exist alongside these negative feedbacks.
We now turn from negative feedback processes to control systems. While little has been written on the subject, a global-level control system that was abiotic could exist.
With regard to potential biotic control systems, we note at the outset that the six biotic negative feedback sources could be part of separate control systems, or a single, joint system.
The most prominent global-level control system that has been proposed is that embodied in the Gaia hypothesis (Lovelock and Margulis, Citation1974). The Gaia hypothesis proposes that there is a control system operating at global level that regulates climate and chemistry at a habitable state for the biota. Lovelock and Margulis (Citation1974) wrote: ‘The notion of the biosphere as an active adaptive control system able to maintain the Earth in homeostasis we are calling the ‘Gaia’ hypothesis…’
A more recent version of the hypothesis cited favourably by Wilkinson (Citation2015) is from Lovelock (Citation2003): ‘…organisms and their material environment evolve as a single coupled system, from which emerges the sustained self-regulation of climate and chemistry at a habitable state for whatever is the current biota’. In both instances, Gaia is described as a control system operating at global level and regulating climate among other factors at a habitable state for the biota.
As mentioned above, Machamer et al. (Citation2000) make the case that ‘mechanisms are entities and activities’, While we provide evidence for the activities of a control system we provide no evidence as to the nature of the entity, in the Gaia case, that the entity is the biosphere.
That said, how do our results compare with the above description of the activities aspect of Gaia? The current level of atmospheric CO2 is consistently seen as a threat to the biosphere (Díaz et al. Citation2019). Our results are evidence that an atmospheric temperature lower than that predicted using the current level of CO2 has been achieved by our control system. That said, shows that the current temperature is above the putative setpoint. This would seem to indicate that the ‘controller’ is not working perfectly, and is a reflection of the intense disturbance being applied by the unprecedented rise in anthropogenic emissions (IPCC, Citation2013). In practice, on very hot days air conditioning systems may ‘struggle’ to maintain the set temperature. However this does not mean that the air conditioning system does not exist.
The evidence that we provide for a control system presently operating on global surface temperature, then, could be considered to be consistent with the definition of the control system activities aspect of Gaia above, modified as: ‘regulating climate among other factors at a more habitable state for the biota than it would have been in its absence’.
The provision of evidence for or against the biosphere being the source of the control system is beyond the scope of this study. Suffice it to say here that the control system for which we provide evidence carries out exactly the task that Gaia is hypothesised to carry out. Further research is required on this question.
In terms of such research, the processing of information required for a control system displaying marked proportional, integral and derivative dynamics at monthly level is quite within the capability of plants. Spitzer and Sejnowski (Citation1997) argue that rather than occurring rarely, differentiation and other computational processes are present and potentially ubiquitous in living systems, including even at the single-celled level where a variety of biological processes – concatenations of chemical amplifiers and switches – can perform computations such as exponentiation, differentiation, and integration.
We now turn to the point that there are now available two separate sets of results (from a previous study and this study) indicating complex and coherent mechanisms involving integrals and derivatives acting on temperature at planetary level. These results are (i) as mentioned in the Introduction the level of SOI, the first-difference of temperature and the second difference of CO2 all being highly statistically significantly correlated with each other (Leggett and Ball, Citation2015); and (ii) the evidence presented in this paper for a control system at planetary level.
With this background, it is a plausible topic for further research that the individual capacities of plants scaled up coherently to global level could be producing the two separate coherent CO2-related results that we report.
Evidence exists of complex adaptive behaviour at whole-of-plant-community level being mediated via inter-plant communication. This is done through mycorrhizal networks (for review, see Gorzelak et al., Citation2015). They write:
The hierarchical integration of this phenomenon with other biological networks at broader scales in forest ecosystems, and the consequences we have observed when it is interrupted, indicate that underground ‘tree talk’ is a foundational process in the complex adaptive nature of forest ecosystems.
Hence it is possible that the individual capacities of plants could be aggregated coherently to global level.
Within this research area, one question could be whether the integral and derivative effect is some sort of echo of the control system (that is, a separate manifestation of the same thing). Each effect would appear to be created either by one large entity, or the bringing together of the actions of multiple entities in a way which is itself coherent. That could be either from an overall organiser or by the phenomenon of self-organisation (Heylighen, Citation1999).
Author contribution statement
LMWL conceived the control system idea. LMWL and DB developed the theory and performed the computations. Both authors collaborated on interpreting the results and contributed to the final manuscript.
Acknowledgements
The authors would like to acknowledge with appreciation the support and advice of J. Gordon and C. Dawson. We thank two anonymous reviewers whose comments have greatly improved this paper.
Disclosure statement
No potential conflict of interest was reported by the authors.
References
- Allen, M. P. 1997. Understanding Regression Analysis. Plenum, New York.
- Araki, M. 2002. PID control. In: Control systems, robotics and automation (ed. H. Unbehauen) Vol. 2, pp. 1–23. UNESCO EOLSS Publishers, Paris, France.
- Archer, D., Eby, M., Brovkin, V., Ridgwell, A., Cao, L. and co-authors. 2009. Atmospheric lifetime of fossil fuel carbon dioxide. Annu. Rev. Earth Planet. Sci. 37, 117–134. doi:10.1146/annurev.earth.031208.100206
- Åström, K. J. and Murray, R. M. 2008. Feedback Systems: An Introduction for Scientists and Engineers. Princeton University Press, Princeton.
- Ban-Weiss, G. A., Bala, G., Cao, L., Pongratz, J. and Caldeira, K. 2011. Climate forcing and response to idealized changes in surface latent and sensible heat. Environ. Res. Lett. 6, 034032–034038. doi:10.1088/1748-9326/6/3/034032
- Beerling, D. J. and Berner, R. A. 2005. Feedbacks and the coevolution of plants and atmospheric CO2. Proc. Natl. Acad. Sci. USA. 102, 1302–1305. doi:10.1073/pnas.0408724102
- Berner, R. A., Lasaga, A. C. and Garrels, R. M. 1983. The carbonate-silicate geochemical cycle and its effect on atmospheric carbon dioxide over the past 100 million years. Am. J Sci. 283, 641–683. doi:10.2475/ajs.283.7.641
- Birkes, D. and Dodge, Y. 1993. Alternative Methods of Regression. Wiley, New York.
- Díaz, S., Settele, J. and Brondízio, E. 2019. Summary for policymakers of the global assessment report on biodiversity and ecosystem services of the intergovernmental science-policy platform on biodiversity and ecosystem services. Report for the Intergovernmental Science-Policy Platform on Biodiversity and Ecosystem Services (Ipbes)-7 Plenary, 6 May 2019, The Intergovernmental Science-Policy Platform on Biodiversity and Ecosystem Services (IPBES), Bonn, Germany.
- Elliott, G., Rothenberg, T. J. and Stock, J. H. 1996. Efficient tests for an autoregressive unit root. Econometrica 64, 813–836. doi:10.2307/2171846
- Farrar, D. E. and Glauber, R. R. 1967. Multicollinearity in regression analysis: the problem revisited. Rev. Econ. Statist. 49, 92–107. doi:10.2307/1937887
- Greene, W. H. 2012. Econometric Analysis. Prentice Hall, Boston.
- Gorzelak, M. A., Asay, A. K., Pickles, B. J. and Simard, S. W. 2015. Inter-plant communication through mycorrhizal networks mediates complex adaptive behaviour in plant communities. AoB Plants 7, plv050. doi:10.1093/aobpla/plv050
- GRETL. 2018. GNU Regression, Econometrics and Time-Series Library. Online at: https://sourceforge.net/projects/gretl/ (last accessed 20 August 2018).
- Harvey, D. I., Leybourne, S. J. and Taylor, A. M. R. 2008. Testing for unit roots and the impact of quadratic trends with an application to relative primary commodity prices. Discussion Paper No. 08/04, Granger Centre for Time Series Econometrics, University of Nottingham.
- Hastie, T., Tibshirani, R. and Friedman, J. 2009. The Elements of Statistical Learning: Data Mining, Inference, and Prediction. Springer, New York.
- Hoerl, A. E. 1962. Application of ridge analysis to regression problems. Chem. Eng. Prog. 58, 4–59.
- Heylighen, F. 1999. The science of self-organization and adaptivity. In: Knowledge Management, Organizational Intelligence and Learning, and Complexity in the Encyclopaedia of Life Support Systems (ed. L. D. Kile). EOLSS Publishers, Oxford.
- Hoerl, A. E. and Kennard, R. W. 1970. Ridge regression: applications to nonorthogonal problems. Technometrics 12, 69–82. doi:10.1080/00401706.1970.10488635
- IHS EViews. 2017. EViews 9.5, IHS Global Inc., Irvine, CA. Online at: http://www.eviews.com/download/download.shtml (last accessed 20 August 2018).
- IPCC. 2013. Climate Change 2013: The Physical Science Basis. Contribution of Working Group I to the Fifth Assessment Report of the Intergovernmental Panel on Climate Change. Cambridge University Press, Cambridge.
- Keeling, R. F., Piper, S. C., Bollenbacher, A. F. and Walker, S. J. 2009. Atmospheric CO2 values (ppmv) derived from in situ air samples collected at Mauna Loa, Hawaii, USA. Online at: http://cdiac.ornl.gov/ftp/trends/CO2/maunaloa.CO2 (last accessed 10 August 2018).
- Leggett, L. M. W. and Ball, D. A. 2015. Granger causality from changes in level of atmospheric CO2 to global surface temperature and the El Niño–Southern Oscillation, and a candidate mechanism in global photosynthesis. Atmos. Chem. Phys. 15, 11571–11592. doi:10.5194/acp-15-11571-2015
- Lenton, T. M., Crouch, M., Johnson, M., Pires, N. and Dolan, L. 2012. First plants cooled the Ordovician. Nature Geosci. 5, 86–89. doi:10.1038/ngeo1390
- Lovelock, J. E. and Margulis, L. 1974. Atmospheric homeostasis by and for the biosphere: the Gaia hypothesis. Tellus Series A 26, 2–10.
- Lovelock, J. 2003. Gaia: the living Earth. Nature 426, 769–770. doi:10.1038/426769a
- Machamer, P., Darden, L. and Craver, C. 2000. Thinking about mechanisms. Philos. Sci. 67, 1–25. doi:10.1086/392759
- Morice, C. P., Kennedy, J. J., Rayner, N. A. and Jones, P. D. 2012. Quantifying uncertainties in global and regional temperature change using an ensemble of observational estimates: the HadCRUT4 data set. J. Geophys. Res. Atmos. 117. HadCRUT4 data used online at: http://www.metoffice.gov.uk/hadobs/hadcrut4/data/current/time_series/HadCRUT.4.4.0.0.monthly_ns_avg.txt (last accessed 12 August 2018).
- Nisbet, E. G., Fowler, C. M. R. and Nisbet, R. E. R. 2012. The regulation of the air: a hypothesis. Solid Earth 3, 87–96. doi:10.5194/se-3-87-2012
- Pesaran, M. H., Shin, Y. and Smith, R. J. 2001. Bounds testing approaches to the analysis of level relationships. J. Appl. Econ. 16, 289–326. doi:10.1002/jae.616
- Pfaff, B., Zivot, E. and Stigler, M. 2016. Package urca. Unit root and cointegration tests for time series data. https://cran.r-project.org/web/packages/urca/urca.pdf (accessed September 2018).
- Prentice, I. C., Williams, S. and Friedlingstein, P. 2015. Biosphere feedbacks and climate change. Grantham Institute Briefing paper No 12. London, England: Imperial College London.
- R Development Core Team. 2009. R: A Language and Environment for Statistical Computing. R Foundation for Statistical Computing, Vienna, Austria. Downloaded from https://mirror.its.sfu.ca/mirror/CRAN/ (accessed September 2018).
- Schreiber, S. 2017. Notes on Gretl Ridge regression function. ricardo.ecn.wfu.edu/gretl/cgi-bin/current_fnfiles/ridge.gfn (accessed July 2018).
- Schmidt, P. and Phillips, P. C. B. 1992. LM test for a unit root in the presence of deterministic trends. Oxford Bulletin of Economics and Statistics 54, 257–287. doi:10.1111/j.1468-0084.1992.tb00002.x
- Spitzer, N. C. and Sejnowski, T. J. 1997. Biological information processing: bits of progress. Science 277, 1060–1061. doi:10.1126/science.277.5329.1060
- VanDoren, V. J. 1998. Basics of proportional-integral-derivative control. Control Eng. 45, 135–145.
- Wilkinson, D. M. 2015. On Gaia: a critical investigation of the relationship between life and Earth. Int. J. Environ. Stud. 72, 724–730. doi:10.1080/00207233.2015.1022405