
 ?Mathematical formulae have been encoded as MathML and are displayed in this HTML version using MathJax in order to improve their display. Uncheck the box to turn MathJax off. This feature requires Javascript. Click on a formula to zoom.
Abstract
Drought is controlled and enhanced by changes in the local and global climate factors. The changes in the global factors mainly occur on the vast oceanic surfaces, while the changes in the local factors occur in the area of drought influence. In order to skilfully forecast and monitor drought occurrences, it is crucial that the specific causal factors be identified and their links studied. Based on this concept, this study tried to establish a relationship between the drought occurrences in Tigray region and the climate factors at the local and global scale. Monthly gridded Climatic Research Unit (CRU) Time-series (TS) data version 4.01 was used to calculate the Standardized Precipitation and Evapotranspiration Index (SPEI). As potential global causal factors, SOI (Southern Oscillation Index), Sea Surface Temperature Anomalies (SSTAs) of the tropical oceanic surfaces, the Red Sea and Nino 3.4 regions were obtained from various sources. Vegetation cover and albedo data were also considered as local drought causal factors. The analyses results show that the zero-time-lag SSTA in the tropical Indian Ocean was identified as statistically significant (p < 0.01) drought influencing factor accounting for 5.8% and 8% of the variations in SPEI, at 1-month and 6-month time scales respectively. At 12-month time scale, however, the SSTAs in the tropical Indian Ocean, tropical Atlantic Ocean, tropical Pacific Ocean, the Red Sea and Nino 3.4 regions were designated as drought influencing factors. Differently, at 24-month time scale, SOI was also identified as drought influencing factor in addition to the SSTAs in the tropical Indian Ocean, tropical Pacific Ocean and the Red Sea region. In general, the findings revealed the variability in the number and type of causal factors based on time scale and time-lag. Nevertheless, the ability of the identified factors to explain the variation in SPEI remained small at all timescales investigated. This, therefore, indicates the need for further investigation on other drought causal factors in the study area.
1. Introduction
More than 50 climate variables also known as ‘essential climate variables’ were identified by the Global Climate Observing System (GCOS) program with the intention of aiding systematic observation on a limited number of critical climate elements (Bojinski et al., Citation2014). From among the listed climate variables by GCOS, sea surface temperature change and the pressure difference based Southern Oscillation Index (SOI) are the most commonly studied prominent sources of climate variations at the global scale (Nobre and Srukla, Citation1996; Soden et al., Citation1999; Trenberth and Caron, Citation2000; Yan et al., Citation2011). Sea surface temperature (SST), as one of the important oceanic essential climate variables, can be used to understand the interaction between the ocean and atmospheric phenomenon (Bojinski et al., Citation2014; WMO and GCOS, Citation2015; Reynolds et al., Citation2007). Various studies (Atlas et al., Citation1993; Nobre and Srukla, Citation1996; Rajagopalan et al., Citation2000; Lu and Delworth, Citation2005; Feng et al., Citation2008) has indicated that SST changes also affect drought occurrences at different parts of the world. In addition to the conventional SST data, however, several SST based indices have been used to monitor the oceanic surfaces, thus drought conditions worldwide. These indices are based on SST anomalies averaged across a given region relative to a 30-year base period. The most common indices are the Niño 3.4 index (Bunge and Clarke, Citation2009; Michelle et al., Citation2015) and the Oceanic Niño Index (ONI) (Trenberth, Citation2019). The Niño 3.4 anomalies represent the average equatorial SSTs across the Pacific Ocean from about the dateline to the South American coast, also called the Nino 3.4 region. This was first identified by Barnston et al. (Citation1997). The region covers a geographical area lying between 5° North to 5° South latitude and 170° West to 120° West longitude. According to Trenberth (Citation2019), the operational definition used by National Oceanic and Atmospheric Administration (NOAA) uses a 5-month running mean to estimate the Niño 3.4 index, and El Niño or La Niña events are defined when the Niño 3.4 SST exceeds on average 0.4 °C for a period of six months or more. Differently, The ONI uses a 3-month running mean, within the Nino 3.4 region, and El Niño or La Niña events are defined when the SST anomalies exceed on average 0.5 °C for at least five consecutive months.
The Southern Oscillation Index (SOI), on the other hand, is a measure of the large-scale air pressure variabilities between the western and eastern tropical Pacific during El Niño and La Niña episodes (Konnen et al., Citation1998; Climate Prediction Center, Citation2005; Yan et al., Citation2011). SOI is described by Trenberth (Citation2019) as a standardized index calculated using the observed sea level pressure differences between Tahiti and Darwin. Prolonged periods of negative or positive SOI values match with abnormally warm or cold ocean waters across the eastern tropical Pacific Ocean indicating El Niño/La Niña episodes (Climate Prediction Center, Citation2005). Moreover, links between El Niño or La Niña Southern Oscillation (ENSO) events and drought have been established by different studies. For instance, Janicot et al. (Citation1996) observed a strong association between drought and ENSO events in the Sahel region after the year 1970. Another study, Nury and Hasan (Citation2016), examined the link between ENSO and drought occurrences in Bangladesh and established a significant relationship.
In addition to the global climate factors, local factors such as albedo and vegetation cover are also known to affect climate. According to Coakley (Citation2003), Dobos (Citation2011) albedo refers to the whiteness of a surface defined by the fraction of the incoming radiation reflected from the surface. Due to its importance as a climate control factor, it is recommended by Henderson-Sellers and Hughes (Citation1982) that the local, zonal and global albedo variability be given emphasis and closely monitored as a source of climatological data. Various studies have also indicated the importance of surface albedo as an energy balance indicator, thus climate control factor (Henderson-Sellers and Hughes, Citation1982; Audu et al., Citation2014; Gul et al., Citation2018; Kravitz et al., Citation2018). According to Courel et al. (Citation1984), Evans et al. (Citation2017) drought could enhance surface albedo by increasing moisture loss leading to the eventual degradation of vegetation cover. On the other hand, albedo could enhance drought by increasing evapotranspiration and reducing precipitation by decreasing the net convective cloud (Charney et al., Citation1977). A study by Zhang and Liang (Citation2018) has indicated that land cover transitions in China have resulted in increased evapotranspiration and albedo, hence, were able to describe the land surface temperature changes significantly. In addition to albedo, De Ridder (Citation1998), Deo et al. (Citation2009) have indicated the significant role of vegetation in reducing drought by creating positive feedback and enhancing precipitation cycling. Therefore, vegetation cover has also been used as a means to monitor drought in different parts of the world (Liu and Kogan, Citation1996; Peters et al., Citation2002). Based on these facts, thus, this study was initiated with the aim to examine the trend of selected global and local climate factors and their link to the drought occurrences in Tigray region. By identifying the statistically significant drought influencing factors, this study further examined the drought prediction skills at varying time scale.
2. Materials and methods
2.1. Study area
This study was conducted in one of Ethiopia’s most drought-affected regions, the Tigray region (). Geographically it is located between 12°15’N and 14°57’N latitude and 36°27’E and 39°59’E longitude covering a total area of 53,683 square kilometres (Gebrehiwot et al., Citation2011). The altitude of the study area varies between 500 m and 3800 m above sea level (Tesfay, Citation2006; Abraha, Citation2013).
Fig. 1. Map of the study area.
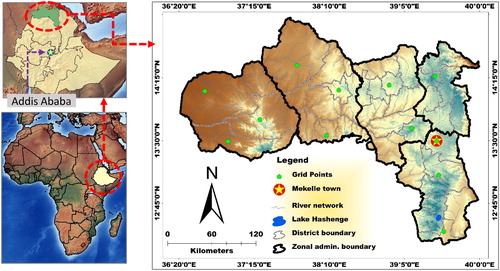
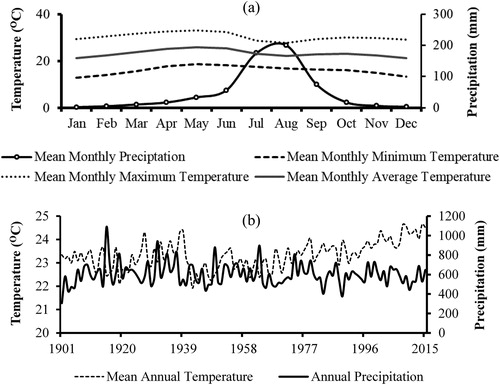
Climatologically, the study area is categorized under sub-tropical climate with highly uneven distribution of seasonal rainfall and recurrent droughts. As indicated in , the area receives its maximum rainfall during the summer season that starts in June and lasts until August (Abraha, Citation2013). According to Gebrehiwot et al. (Citation2011), the mean annual rainfall of the region is estimated to be 473 mm, with the average annual temperature varying between 7.5 °C, in the highlands, and about 27 °C in the eastern lowlands (Abraha, Citation2013).
Fig. 2. Mean monthly (a) and mean annual (b) precipitation and temperature of the study area for the period 1901 to 2016.
Given the ages of human occupation, little remains of the original vegetation cover in Tigray region (Abraha, Citation2013). The current land cover comprises a mosaic of cultivation, with grassland and shrubland. In the lowlands, there remains an extensive area of woodland and shrubland with areas of shifting cultivation. The natural forest resource of the region is extensively exploited and accounts only for about 0.2% of the total land area. The decline in forest cover has a long history and is highly linked with human economic activities and population pressure. In Tigray region, agricultural land use expansion is reported to have increased at the expense of maintaining natural vegetation in the region. This, as a result, has supplemented the adverse impacts from the frequent occurrence of drought (Nyssen et al., Citation2009).
3. Data collection and data processing
3.1. Climate data
Even though there are meteorology stations in Tigray region, they are mostly characterized by short climate records containing missing values for several months or years. Therefore, in order to avoid errors and misrepresentations from the use of local climate data, a high resolution (0.5° × 0.5°) gridded Climatic Research Unit (CRU) Time-series (TS) data version 4.01 dataset was collected from KNMI (Koninklijk Nederlands Meteorologisch Instituut) climate explorer (https://climexp.knmi.nl/start.cgi) on 12 systematically selected grid points (). The grid points were systematically distributed over the study area with an elevation range of 661 m to 2553 m above mean sea level. The gridded CRU TS 4.01 data is a month-by-month variation in climate over the period 1901 to 2017, produced by CRU at the University of East Anglia (Harris and Jones, Citation2017). There are also other widely used dataset versions like CRU TS 2.1. The CRU TS 2.1 dataset was developed by Mitchell and Jones (Citation2005), with a temporal coverage of 1901 to 2002. However, the CRU TS 4.01 dataset was used for drought analyses because of its wider temporal coverage.
3.2. Global factors
The sea surface temperature dataset used in this research, daily Advanced Very High-Resolution Radiometer (AVHRR-only) version 2 data with a spatial resolution of 0.25° (Reynolds et al., Citation2002; Reynolds et al., Citation2007), is part of the National Oceanic and Atmospheric Administration (NOAA) Climate Data Record (CDR) program product suite (Banzon et al., Citation2016). This data was used because of its long-time record and its wide spatial coverage. Additionally, the Nino 3.4 SSTA monthly data and the SOI were obtained from NOAA. The SSTA in the Nino 3.4 region and SOI were selected for analyses mainly due to the fact that different studies (Trenberth, Citation1997; Knaff and Landsea, Citation1997; Chowdhury, Citation2003; Gergis and Fowler, Citation2005) indicated their significant relationship with ENSO events that occurred in the tropical Pacific. Hence, the 1981 to 2010 base period Extended Reconstructed Sea Surface Temperature Version 5 (ERSSTV5) monthly SSTA and the SOI data were obtained from the National Oceanic and Atmospheric Administration (NOAA) and used to examine their connection with the drought events that occurred in the study area.
3.3. Local factors
Studies (Charney et al., Citation1975; Hu et al., Citation2000; Norton et al., Citation2002; Pielke et al., Citation2002; Singh et al., Citation2003; Wan et al., Citation2004; Fensham et al., Citation2005; Juszak et al., Citation2014; Sentian and Kong, Citation2015; Banzon et al., Citation2016) indicate that AVHRR and Moderate Resolution Imaging Spectroradiometer (MODIS) image-based Albedo and Normalized Vegetation Index (NDVI) data can be used to monitor vegetation changes and drought conditions in different parts of the world. This shows the link between albedo and vegetation cover (Hu et al., Citation2000). It is also indicated by Bounoua et al. (Citation2000) that NDVI affects climate by redistributing the surface energy fluxes and creating cooler near-surface climate conditions. Cognizant of the potential impact of the local albedo and vegetation cover on drought by affecting surface temperature, Albedo (Modern-Era Retrospective analyses for Research and Applications (MERRA) and MODIS Terra-aqua 8-day surface reflectance products (MCD43A)) and NDVI (AVHRR and Terra Moderate Resolution Imaging Spectroradiometer (MOD13Q1)) data were obtained for the years 1982 to 2016 on a maximum of one-month temporal resolution and used for analyses.
3.4. Data analyses
3.4.1. Drought analyses
All the monthly gridded CRU TS 4.01 data (1982 to 2016) were averaged to represent the climate data of the study area. The time-series data was then used to automatically calculate the Standard Precipitation and Evapotranspiration Index (SPEI), at different time scales, using the ‘SPEI’ package in R statistical software. SPEI developed by Vicente-Serrano et al. (Citation2010) was chosen over SPI (Standard Precipitation Index) because it includes temperature changes as part of its analyses (Lweendo et al., Citation2017). The inclusion of Potential Evapotranspiration (PET) makes a discernible difference in index values and is then recommended as an alternative to SPI to quantify anomalies in accumulated climate water balance, incorporating potential evapotranspiration (Stagge and Tallaksen, Citation2014).
In the presence of a monthly climate data for a location, the SPEI can be calculated on 1, 2, 3, 6, 12, 24, 48… months depending upon the time scale of interest (Edwards and McKee, Citation1997). According to Svoboda et al. (Citation2012), groundwater, streamflow and reservoir storage reflect the longer-term precipitation variances. Differently, soil moisture conditions respond to precipitation variances on a relatively short timescale. Accordingly, 1-month SPEI was used to characterize the meteorological drought, 3-month to 6-month SPEI for agricultural drought, and 12-month to 24-month SPEI for hydrological drought.
3.4.2. Trend analyses
Trend analyses refer to the quantification of patterns over a specific period of time. A trend can also take various forms, such as increasing, decreasing, or periodic (cyclic). According to the Interstate Technology Regulatory Council (Citation2013), detecting and assessing temporal and spatial trend is important for many environmental studies and monitoring programs. Before looking for a trend, however, testing for randomness is important to identify the presence or absence of a trend in a time series data (Ayoade, Citation2008). Different techniques of randomness tests are thoroughly discussed by Wang (Citation2003), Biswas et al. (Citation2014). According to Wang (Citation2003), all techniques have their own strength and weakness. However, Wald-Wolfowitz Run’s test of randomness proved to be from among the strongest randomness test techniques such as the Mann-Kendall test and the Bartels’ rank test. Thus, all the time series data on SPEI and the causal factors were tested for randomness using Wald-Wolfowitz Run’s test method in EquationEq. (1)(1)
(1) computed based on the number of runs above and below the median as a reference value. Time series data with Run’s test (Z) values falling within
were regarded as random, hence no trend. Contrarily, Z value falling outside of the range were considered non-random. Finally, for the non-random time series data, the correlation coefficient was used to further understand the strength and direction of the trend.
(1)
(1)
Where Z is a test of randomness, r is the number of runs, and n is the sample size.
3.4.3. Regression analyses
To identify the major drought causal factors in the study area, multiple linear regression analyses (EquationEqs. (2)(2)
(2) and Equation(3)
(3)
(3) ) was used on SPEI as a dependent variable and the two local factors (vegetation cover and albedo) and six global factors (SSTAs for the tropical Indian Ocean, tropical Atlantic Ocean, tropical Pacific Ocean, Red Sea, Nino 3.4 and SOI) as independent variables. The analyses was carried out at 1-month, 3-month, 6-month, 12-month and 24-month time scales. These time scales were selected to represent the meteorological, agricultural and hydrological drought conditions defined by WMO (2012). However, before the variables were considered for the multiple linear regression analyses, they had to be checked for multicollinearity by calculating correlation coefficients for all pairs of predictor variables. A stepwise multiple linear regression method was, then, used to identify the statistically significant predictive variables automatically.
(2)
(2)
whereby
is beta coefficient showing the performance of dependent variable’s (n) contribution,
is correlation coefficient and Xn is the independent variable,
is the standard deviation.
(3)
(3)
where by
Moreover, f-test (EquationEq. (4)(4)
(4) ) was used to test the significance level of the correlation coefficient.
(4)
(4)
Where k is the number of predictors, R is the correlation coefficient and n is the number of samples.
4. Results
4.1. Drought occurrence
The run’s test results in show below −1.96 z values at all time scales investigated, indicating a non-random occurrence of drought in the study area. The results also show a significant (p < 0.01) increasing drought trend at all investigated time scales for the period 1982 to 2016. Negative correlation values normally represent a decreasing trend. However, this can also be interpreted as an increasing deviation in the linear relationship between the two variables, SPEI and time. Hence, the negative values here represent decreasing SPEI values (i.e. the negative SPEI values became smaller with time) as the time in years increased from 1982 to 2016. This, thus, indicates an increase in drought occurrence over time as illustrated in .
Fig. 3. Temporal pattern of SPEI at 1-month, 3-month, 6-month, 12-month and 24-month time scales (1982 to 2016).
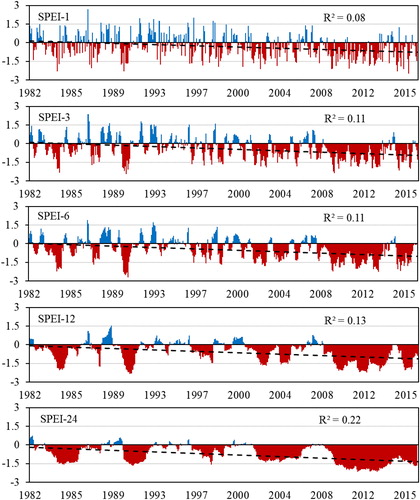
Table 1. Test of randomness and the product-moment correlation coefficient values representing the trend of drought conditions in Tigray region at 1-month, 3-month, 6-month, 12-month and 24-month time scale (1982–2016).
4.2. Global factors
The trend analyses result for the global causal factors presented in indicate a significant (p < 0.01) increasing trend in SOI and SSTAs of tropical Indian Ocean, tropical Atlantic Ocean, tropical Pacific Ocean and the Red Sea region (see ), at all investigated timescales.
Fig. 4. Map of sampled tropical Indian Ocean, tropical Atlantic Ocean, tropical Pacific Ocean, the Red Sea and Nino 3.4 regions (12-month average global SSTAs for the period 1982 to 2016).
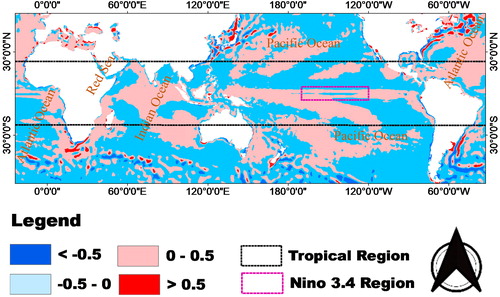
Table 2. Trend test summary of the global and local factors used in drought causation analyses (z = run’s test, r = Pearson’s correlation coefficient, p = probability-value) for the period 1982 to 2016.
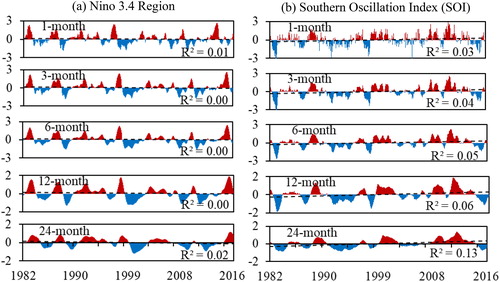
Differently, the SSTAs in the Nino 3.4 region did not show any significant trend at all investigated time scales. With the exception to Nino 3.4, the correlation coefficient values of all global causal factors increased as the time scale increased from 1-month to 24-months with the SOI correlation value (rSOI = 0.18, 1-month time scale) being the smallest and the tropical Indian Ocean correlation value (rIndian-Ocean = 0.86, 24-month time scale) being the highest. The temporal patterns of global causal factors are presented in and .
Fig. 5. Running means of the sea surface temperature anomalies for the (a) tropical Indian Ocean, (b) tropical Atlantic Ocean, (c) tropical Pacific Ocean and (d) Red Sea region on 1-month, 3-month, 6-month, 12-month and 24-month basis.
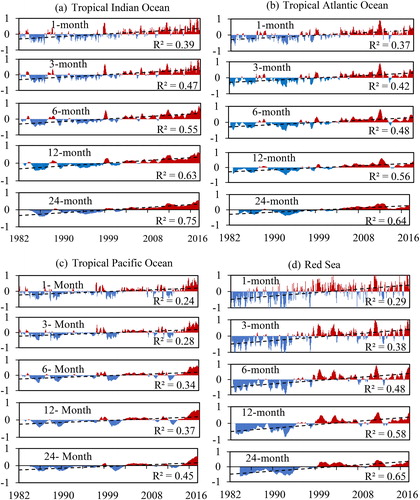
Fig. 6. Running means of the (a) Nino 3.4 region surface temperature anomaly and (b) Southern Oscillation Index (SOI) on 1-month, 3-month, 6-month, 12-month and 24-month basis.
4.3. Local factors
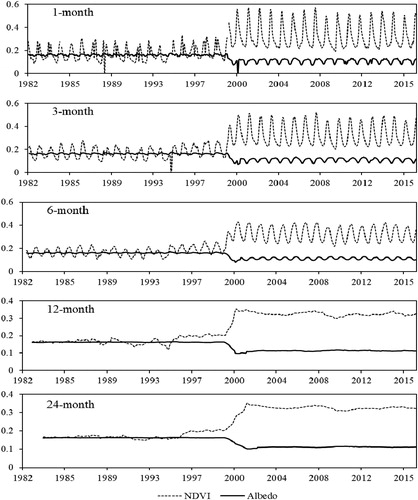
NDVI and albedo were considered as potential local causal factors of drought in the study area. Unlike the global causal factors and albedo, however, the trend analyses test on NDVI showed a significant (r1 = 0.59, r3 = 0.66, r6 =0.76, r12 = 0.88, r24 = 0.89; p < 0.01) increasing trend at all investigated time scales between 1982 and 2016 (see ). shows that the NDVI values were low between the years 1982 and 1998. However, the values spiked starting in 1999 and continued with no sign of dropping to previous values. On the contrary, the temporal trend of albedo was characterized by a significant decreasing trend (r1 = −0.75, r3 = −0.78, r6 = −0.81, r12 = −0.85, r24 = −0.87; p < 0.01). It is also indicated in that the reflectivity of the surface remained high and fairly constant between 1982 and 1998. The reflectivity exhibited a sharp decline in 1999 and remained low until 2016.
Fig. 7. Temporal pattern of average NDVI and Albedo at 1-month, 3-month, 6-month, 12-month and 24-month time scales.
4.3.1. Zero-time-lag correlation and regression analyses
It is shown in that negative significant linear correlation existed between SPEI and the investigated global and local factors, with exception to the SSTA in the Nino 3.4 region, SOI and Albedo at all investigated time scales. The linear correlation between SPEI and SSTAs at the Nino 3.4 was significant only at 6-month (r = −0.1, p = 0.043) and 12-month (r = −0.148, p = 0.003) time scales. Similarly, the correlation coefficient between SPEI and SOI was significant at all time scales except at 12-month time scale (r = −0.041, p = 0.413). The linear relationship between SPEI and Albedo, however, was significant but positive at all investigated time scales. Moreover, the strongest linear relationship was observed between SPEI and the tropical Indian Ocean followed by the tropical Atlantic Ocean at all investigated time scales at p < 0.01 ().
Table 3. Correlation coefficient (r) values between zero-lag SPEI and the local and global climate controlling factors at 1-month, 3-month, 6-month, 12-month and 24-month time scales for the period 1982 to 2016.
For the stepwise multiple linear regression analyses, factors which only correlated with SPEI at p < 0.05 were included as an input. Thus, the Nino 3.4 SSTA (at 1-month, 3-month, and 24-month time scale) and SOI (at 12-month time scale) were excluded from the analyses. Moreover, the NDVI and Albedo factors were excluded as drought causing factors because of their inverse relationship with SPEI. On these bases, the stepwise multiple linear regression analyses was carried out and, thus, the SSTA in the tropical Indian Ocean alone was identified as drought influencing factor at 1-month and 6-month time scales accounting for only 5.8% and 8% of the variations in SPEI, respectively (see ).
Fig. 8. Scatter plots showing the zero-time-lag observed SPEI against predicted SPEI values at (a)1-month, (b) 3-month, (c) 6-month, (d) 12-month and (e) 24-month time scales.
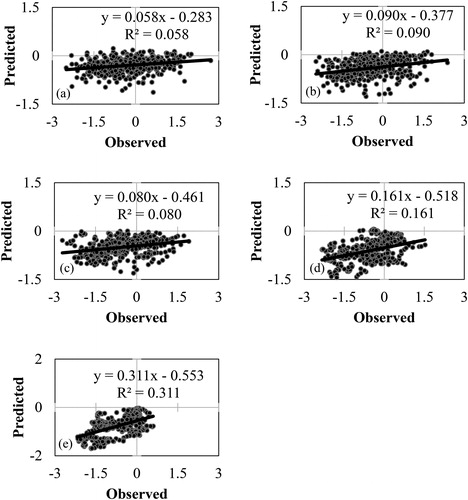
At 3-month, 12-month and 24-month time scales, however, other global factors were also found to have significant (p < 0.01) influence on the SPEI of their corresponding time scales. SSTAs in the tropical Indian Ocean along with the SSTA in the tropical Atlantic Ocean were able to describe 9% of the variation in SPEI at 3-month time scale (). At 12-month time scale, however, the SSTAs in the Tropical Indian Ocean, Red Sea, Tropical Atlantic Ocean and the Nino 3.4 region were identified as drought influencing factors accounting for 16.1% of the variation in SPEI (). Similarly, the 24-month time scale SSTAs in the tropical Indian Ocean, Red Sea, the SOI and the SSTA in the tropical Pacific Ocean were able to explain the variation in SPEI by 31.1% ().
4.3.2. Time-lagged correlation and regression analyses
The correlation coefficient values for lagged SPEI and the global and local causal factors are presented in . Similar to the zero-time-lag correlation, the linear relationship with the tropical Indian Ocean was higher at all time scales investigated than the other factors. SSTAs at the tropical Indian Ocean showed significant (p < 0.01) negative correlation with the lagged SPEI at −0.24, −0.30, −0.28, −0.34 and −0.48 at 1-month, 3-month, 6-month, 12-month and 24-month time scales respectively.
Table 4. Correlation coefficient (r) values between time-lagged SPEI and the local and global climate controlling factors at 1-month, 3-month, 6-month, 12-month and 24-month time scales for the period 1982 to 2016.
In a much similar way with the zero-time-lag analyses, factors significantly correlated with SPEI at p < 0.05 were included as an input for analyses. Hence, SSTAs of the Nino 3.4 region were included as an input in the regression model only at 6-month (r = −0.097, p = 0.048) and 12-month (r = −0.166, p = 0.001) time scales. The SOI was also excluded as a factor at 6-month (r = −0.073, p = 0.136) and 12-month (r = −0.021, p = 0.667) time scales. The small correlation could arise due to the high sample size that could result in a higher likelihood of obtaining a very low correlation coefficient. Additionally, the NDVI and Albedo were excluded as inputs because of their inverse relationship with the SPEI.
At 3-month and 6-month time scales, only SSTAs in the tropical Indian Ocean was identified as a statistically significant drought influencing factor significant at p < 0.01. It was observed that about 9.2% and 8.2% of the variation in the 3-month and 6-month lagged SPEI were accounted for by the changes in SSTAs in the tropical Indian Ocean alone (). However, at 12-month time scale, SSTAs in the tropical Indian Ocean, Red Sea, tropical Atlantic Ocean and Nino 3.4 region were identified as influencing factors of drought in the study area. At this time scale, the identified factors accounted for 16.5% of the variation in SPEI significant at p < 0.01 (See ).
Fig. 9. Scatter plots showing the time-lagged observed SPEI against predicted SPEI values at (a)1-month, (b) 3-month, (c) 6-month, (d) 12-month, (e) 24-month time scales.
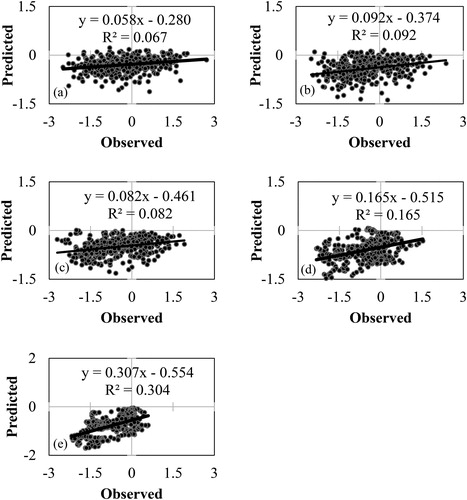
The analyses result also revealed the influence of SSTAs in the tropical Indian Ocean, Red Sea, SOI and tropical Pacific Ocean on the time-lagged SPEI at 24-month time scale. All the identified factors were able to describe 30.4% of the variation in SPEI (). It was also observed that the R-squared value between time-lagged SPEI and the identified factors increased with time scale. The values increased from 0.067 at 1-month time scale to 0.304 at 24-month time scale.
5. Discussion
5.1. Trend of drought
The analyses result on regional drought occurrence indicates a significant increasing trend of drought at all investigated time scales during the 1982 to 2016 analyses period. This finding was in agreement with (El Kenawy et al., Citation2016) which reported an increasing trend of drought occurrence in Ethiopia since 1982.
5.2. Trend of global and local factors
This study shows that the SSTAs in the tropical Indian Ocean increased significantly between 1982 and 2016 at all investigated time scales. This result was in agreement with (Deser et al., Citation2010), which reported a positive significant trend of SST changes in all tropical Oceanic surfaces, between 1900 and 2008, except for the North Atlantic Ocean. Another study by Levitus et al. (Citation2000) reported warming of the Pacific Ocean starting the 1950’s while the Indian Ocean did some years later starting the mid-1960s. The result was also confirmed by Cane et al. (Citation1997) referring that the increasing zonal sea surface temperature changes as good evidence for global warming. However, the warming of the global oceanic surfaces is not limited to the Indian and Pacific Oceans only. Chaidez et al. (Citation2017) reported an increasing surface temperature in one of the warmest seas, the Red Sea. Similar researchs in the Red Sea by Raitsos et al. (Citation2011), Nandkeolyar et al. (Citation2013) also revealed the warming of the Red Sea which started in the mid-1990s with another abrupt leap in 1994. Additionally, this study found the highest warming trend in the tropical Indian Ocean followed by the tropical Atlantic Ocean and the Red Sea at all investigated time scales. The same observation was made by Servain (Citation1991), Cardinal et al. (Citation2010), Lin and Li (Citation2012) which reported similar increasing linear trend in SST in the tropical Indian Ocean and the tropical Atlantic Ocean. However, the smallest increasing linear trend was observed in the tropical Pacific Ocean. According to Cane et al. (Citation1997), Hoell and Funk (Citation2013), Kidwell et al. (Citation2017) it is possible for this situation to arise from the variability between the cooling and warming trends of the eastern and the western equatorial pacific zones in relation to ENSO events.
Although no agreement on the starting period of the warming events was found, this study generally agreed with the research findings and have captured the warming trends in the tropical Indian Ocean, tropical Atlantic Ocean, tropical Pacific Ocean and the Red Sea. Unlike any other oceanic surfaces in the tropical region, however, this study found no trend of sea surface temperature anomalies in the Nino 3.4 region at all time scales investigated, except at 6-month time scale. Hence, the absence of a trend in SSTA in the Nino 3.4 region could attribute to the non-cyclic nature of ENSO events.
The Southern Oscillation Index (SOI) has been used as a predictor of climatic variables, such as rainfall (Suppiah, Citation2004) and temperature, and is related to the El Nino and La Nina phenomena (Eso et al., Citation2016). This study has found a weak positive SOI trend, significant (p < 0.01) at all investigated time scales between 1982 and 2016. This is in agreement with Pant and Parthasarathy (Citation1981), McLean et al. (Citation2009) which demonstrated for the absence of any appreciable SOI’s long term trend because of its oscillating nature with an irregular period of 3 to 5 years. This was also further supported by Eso et al. (Citation2016). According to this particular research, the analyses result, which was conducted by dividing the cumulative data from 1876 to 2014 into 4 periods, showed increased SOI at the first period from 1876 to 1919. The SOI for the years 1920 to 1975 also showed an increasing trend, followed by a decreasing trend between the years 1976 and 1995. However, no trend was observed during the 1996 to 2014 period.
The trend test for local causal factors including NDVI and albedo show statistically significant high trend values which are opposite to each other. NDVI showed a statistically significant positive trend, while albedo showed the same statistically significant but negative trend in all of the investigated time scales. A similar statistically significant positive trend in monthly maximum NDVI was reported by Herrmann et al. (Citation2005) over a large portion of the Sahel region between 1982 and 2003. The decreasing trend of albedo is accounted by the increasing vegetation cover in the study area. Albedo increases with decreasing vegetation (Lofgren, Citation1995; Fuller and Ottke, Citation2002; Benas and Chrysoulakis, Citation2014). Hence, a decreasing pattern is expected in areas where the vegetation cover improves. In this study, the trends in NDVI and albedo are classified into two distinctive periods. The period of below-average NDVI (i.e. from 1982 to 1998), and the period of above-average NDVI (i.e. from 1999 to 2016). However, the periods for below (1999–2016) and above (1982–1998) average albedo is quite the reverse to NDVI. These results show closer resemblance with the Sahelian below average (1982–1993) and above-average (1994–2003) NDVI values (Anyamba and Tucker, Citation2005). The NDVI and albedo values showed abrupt change starting in 1999 and remained fairly constant until 2016 with no significant decreasing or increasing signs. Rasmussen et al. (Citation2001) suggested that constant vegetation changes in semi-arid regions could be in response to changes in climate trend and human impacts. Various researches assessing land use and land cover change have been carried out in the study area that show the same increasing trend in vegetation cover (Munro et al., Citation2008; Kiros, Citation2014; Belay et al., Citation2015). However, a research work in Kilte Awlaelo district by Tilahun et al. (Citation2015) reported a decreasing trend of vegetation between 1972 and 2014. According to Kiros (Citation2014), the vegetation cover in the study area increased between 1995 and 2014 mainly due to the increasing rehabilitation practices.
Moreover, the land tenure system from 1975 to 1990 has resulted in fragmentation of landholdings and tenure insecurity which resulted in lack of appropriate land use, further intensifying land degradation. The 1995 constitution came up with property rights that vested the state and the people followed by the new proclamation of 1997. The proclamation again transferred the land administration authority to the regional state and the people to own land and its natural resources (Nega et al., Citation2003; Teka et al., Citation2013). Moreover, according to Teka et al. (Citation2013), three major natural resource management policies (i.e. Ethiopian Forestry Action Programme in 1994, Tigray Forestry Action Programme in 1996 and Ethiopia’s Environmental policy in 1997) has been developed to reduce land degradation through improved vegetation cover. Hence, these changes in ownership and natural resource management policies could have impacted the vegetation cover, thus, explain the low NDVI and high Albedo values during 1982 to 1998; and the increased vegetation cover and decreased surface reflectivity from 1999 to 2016.
5.3. Linear relationship between SPEI and causal factors
The SSTA in the tropical Indian Ocean was identified as a major drought causal factor at 1-month, 3-month and 6-month timescales. At 12-month time scale, however, both the zero-time-lag and time-lagged SSTAs in the Red Sea region, tropical Atlantic Ocean, and Nino 3.4 region played a crucial role as climate control factors affecting drought conditions in the study area in addition to the SSTAs in the tropical Indian Ocean. Differently, the SOI and SSTA in the tropical Pacific Ocean were identified as major drought causing factors at 24-month time scales along with the SSTAs in the tropical Indian Ocean and the Red Sea region. This, thus, indicates the consistent role of the tropical Indian Ocean in defining the drought conditions in the study area.
According to Lu (Citation2009), the tropical Indian Ocean has warmed significantly during the second half of the twentieth century affecting the Sahelian precipitation negatively. Consistent warming of the tropical Indian Ocean has also been observed in the 1998 to 2002 droughts in the United States, southern Europe, and southwest Asia (Hoerling and Kumar, Citation2003). Rigorous studies on the influence of SST changes in the tropical Indian Ocean on the east African climate have been made by Mutai and Ward (Citation2000), Ummenhofer et al. (Citation2009), Segele et al. (Citation2015), Appelhans and Nauss (Citation2016). In line with our findings, these studies demonstrated the effect of SST changes on the east African climate by influencing the zonal pressure gradient and the surface wind component in the region. Shanko and Camberlin (Citation1998) also confirmed that the SST changes over the western Indian Ocean is associated with the drought occurrences in Ethiopia. Moreover, shreds of evidence by Zolina et al. (Citation2017) show the effects of the SST changes in the Red Sea region on the parts of east Africa by affecting the received precipitation.
This study also found a positive significant relationship between NDVI and drought occurrences in the study area. Various researches have been done on the impact that climate change has on vegetation change (Li and Guo, Citation2012; Chuai et al., Citation2013; Yuan et al., Citation2015; Ning et al., Citation2015). Conversely, studies examining the impact of vegetation cover on climate through their influence on the atmospheric temperature, humidity, cloud cover and precipitation at various scales (Mahmood et al., Citation2014; Sentian and Kong, Citation2015; Laux et al., Citation2017) are also widely available. Vegetation, in general, provides numerous ecosystem services, many of which influence the climate systems directly or indirectly (Pielke et al., Citation2002). However, the degree to which the land cover changes affect the climate system depends on the type of land cover conversion (Sertel et al., Citation2011).
In this study, the trend of vegetation change was positively correlated with the drought occurrences. For vegetation cover change to be considered as a drought controlling factor, its link with drought should be negative. The increasing vegetation pattern should have resulted in decreasing drought pattern over time. However, the trend analyses results show that drought trend and the vegetation change increased over time. Unlike the vegetation cover, a decreasing trend in albedo was observed. As a result, vegetation cover and the albedo were ruled out as a drought causal factors in the study area.
6. Conclusion
In this study, six global factors (SSTAs of tropical Indian Ocean, tropical Atlantic Ocean, tropical Pacific Ocean, Nino 3.4 region, the Red Sea and the atmospheric pressure based SOI) and two local factors (Albedo and NDVI) were examined as potential factors influencing the variation in drought occurrences in the study area. Each factor was examined for any increasing or decreasing trend using the Wald-Wolfowitz Run’s test method. The results indicate that five out of the six global factors showed a statistically significant increasing trend between 1982 and 2016. No appreciable significant linear trend was observed for the SSTA in the Nino 3.4 region. NDVI increased significantly while Albedo decreased between 1982 and 2016. The increasing trend of the five global factors was in agreement with the increasing trend of drought at all investigated time scales. However, the magnitude of drought increment was not equivalent to the magnitude that the causal factors increased through the years. Since multicollinearity was observed between the independent factors, a stepwise multiple linear regression was used to identify the factors functionally related to the variation in drought occurrences in the study area. Moreover, NDVI and Albedo were excluded as drought causal factors due to the reverse linear relationship with the drought trend.
In general, this study has found the significant role of the tropical Indian Ocean in determining the drought conditions of the study area at all time scales investigated. The SSTAs in the tropical Atlantic Ocean, tropical Pacific Ocean, the Red Sea and Nino 3.4 regions also played a statistically significant role in drought occurrences in the study area besides to the SSTAs in the tropical Indian Ocean. Moreover, the SOI was identified as one of the drought affecting factors only at 24-month time scale. Hence, this implies that SSTA in the tropical Indian Ocean can be used to predict droughts in the study area for shorter time periods including 1-month, 3-month and 6-month time scales. For longer periods, the SSTAs of the tropical Indian Ocean combined with the SSTAs of the tropical Atlantic Ocean, tropical Pacific Ocean, the Red Sea and Nino 3.4 region and SOI should be used to predict drought occurrences with higher precision than the shorter time scales. However, it should also be noted that the influence of the identified drought causal factors is small, hence indicating the need for further assessment of other potential drought causal factors both at the local and global scale.
Authors’ contribution
AST initiated and designed the methods, materials used, carried out the data collection and analyses, and prepared the draft manuscript. JOA and NJB provided professional input throughout the course of time and helped draft and edit the final manuscript. All authors have read and approved the final manuscript.
Acknowledgements
The authors are grateful for the financial support by the Pan African University (PAU), African Union (AU), Addis Ababa, Ethiopia. The authors would also like to extend their gratitude to the anonymous reviewers as well as to everyone who contributed to the success of this study.
Disclosure statement
The authors declare that there is no conflict of interest.
Availability of data and materials
The climate data used in this study are available from the corresponding author upon request.
References
- Abraha, M. E. 2013. Assessment of drought early warning in Ethiopia: A comparison of WRSI by surface energy balance and soil water balance. M.Sc. Thesis, University of Twente, Netherlands.
- Anyamba, A. and Tucker, C. J. 2005. Analyses of Sahelian vegetation dynamics using NOAA-AVHRR NDVI data from 1981–2003. J. Arid Environ. 63, 596–614. doi:10.1016/j.jaridenv.2005.03.007
- Appelhans, T. and Nauss, T. 2016. Spatial patterns of sea surface temperature influences on East African precipitation as revealed by empirical orthogonal teleconnections. Front. Earth Sci. 4, 1–8.
- Atlas, R., Wolfson, N. and Terry, J. 1993. The effect of SST and soil moisture anomalies on GLA model simulations of the 1988 U.S. summer drought. J. Climate 6, 2034–2048. doi:10.1175/1520-0442(1993)006<2034:TEOSAS>2.0.CO;2
- Audu, M. O., Isikwue, B. C. and Eweh, J. E. 2014. Estimation of seasonal and annual albedo of the earth’s atmosphere over Kano, Nigeria. IOSR J. Appl. Phys. 6, 56–62.
- Ayoade, J. O. 2008. Techniques in Climatology. Stirling-Horden Publishers Ltd., Ibadan.
- Banzon, V., Smith, T. M., Mike Chin, T., Liu, C. and Hankins, W. 2016. A long-term record of blended satellite and in situ sea-surface temperature for climate monitoring, modelling and environmental studies. Earth Syst. Sci. Data 8, 165–176. doi:10.5194/essd-8-165-2016
- Barnston, A. G., Chelliah, M. and Goldenberg, S. B. 1997. Documentation of a highly ENSO-related SST région in thé equatorial Pacific. Atm-Ocean 35, 367–383.
- Belay, K. T., Van Rompaey, A., Poesen, J., Van Bruyssel, S., Deckers, J. and co-authors. 2015. Spatial analyses of land cover changes in eastern Tigray (Ethiopia) from 1965 to 2007: are there signs of a forest transition? Land Degrad. Develop. 26, 680–689. doi:10.1002/ldr.2275
- Benas, N. and Chrysoulakis, N. 2014. Estimation of land surface albedo time series and trends based on MODIS data. In: Proceedings of Remote Sensing for Agriculture, Ecosystems, and Hydrology XVI, 9239, 92390Q.
- Biswas, M., Mukhopadhyay, M. and Ghosh, A. K. 2014. A distribution-free two-sample run test applicable to high-dimensional data. Biomet 101, 913–926. doi:10.1093/biomet/asu045
- Bojinski, S., Verstraete, M., Peterson, T. C., Richter, C., Simmons, A. and co-authors. 2014. The concept of essential climate variables in support of climate research, applications, and policy. Bull. Amer. Meteor. Soc. 95, 1431–1443. doi:10.1175/BAMS-D-13-00047.1
- Bounoua, L., Collatz, G. J., Los, S. O., Sellers, P. J., Dazlich, D. A. and co-authors. 2000. Sensitivity of climate to changes in NDVI. J. Climate 13, 2277–2292. doi:10.1175/1520-0442(2000)013<2277:SOCTCI>2.0.CO;2
- Bunge, L. and Clarke, A. J. 2009. A verified estimation of the El Ninõ index Ninõ-3.4 since 1877. J. Climate 22, 3979–3992. doi:10.1175/2009JCLI2724.1
- Cane, M. A., Clement, A. C., Kaplan, A., Kushnir, Y., Pozdnyakov, D. and co-authors. 1997. Twentieth-century sea surface temperature trends. Science 275, 957–960. doi:10.1126/science.275.5302.957
- Cardinal, D., Gaillardet, J., Hughes, H. J., Opfergelt, S. and André, L. 2010. Contrasting silicon isotope signatures in rivers from the congo basin and the specific behaviour of organic-rich waters. Geophys. Res. Lett. 37, 1–6.
- Chaidez, V., Dreano, D., Agusti, S., Duarte, C. M. and Hoteit, I. 2017. Decadal trends in Red Sea maximum surface temperature. Sci. Rep. 7, 1–8.
- Charney, J., Stone, P. H. and Quirk, W. J. 1975. Drought in the Sahara: a biogeophysical feedback mechanism. Science 187, 434–435. doi:10.1126/science.187.4175.434
- Charney, J., Quirk, W. J., Chow, S. and Kornfield, J. 1977. A comparative study of the effects of albedo change on drought in semi-arid regions. J. Atmos. Sci. 34, 1366–1385. doi:10.1175/1520-0469(1977)034<1366:ACSOTE>2.0.CO;2
- Chowdhury, M. R. 2003. The El Niño-Southern Oscillation (ENSO) and seasonal flooding - Bangladesh. Theor. Appl. Clim. 76, 105–124. doi:10.1007/s00704-003-0001-z
- Chuai, X. W., Huang, X. J., Wang, W. J. and Bao, G. 2013. NDVI, temperature and precipitation changes and their relationships with different vegetation types during 1998-2007 in Inner Mongolia, China. Int. J. Climatol. 33, 1696–1706. doi:10.1002/joc.3543
- Climate Prediction Center. 2005. Climate Prediction Center - Southern Oscillation Index. Online at: https://www.cpc.ncep.noaa.gov/products/analyses_monitoring/ensocycle/soi.shtml
- Coakley, J. A. 2003. Reflectance and albedo, surface. In: Encyclopedia of Atmospheric Sciences. 2nd ed. Elsevier, New York, pp. 1914–1923.
- Courel, M. F., Kandel, R. S. and Rasool, S. I. 1984. Surface albedo and the Sahel drought. Nature 307, 528–531. doi:10.1038/307528a0
- De Ridder, K. 1998. The impact of vegetation cover on sahelian drought persistence. Bound. Meteorol. 88, 307–321. doi:10.1023/A:1001106728514
- Deo, R. C., Syktus, J. I., McAlpine, C. A., Lawrence, P. J., McGowan, H. A. and co-authors. 2009. Impact of historical land cover change on daily indices of climate extremes including droughts in eastern Australia. Geophys. Res. Lett 36, 1–5.
- Deser, C., Phillips, A. S. and Alexander, M. A. 2010. Twentieth century tropical sea surface temperature trends revisited. Geophys. Res. Lett. 37, 1–6.
- Dobos, E. 2011. Albedo. In Encyclopedia of Soil Science. 2nd ed. Springer, Berlin.
- Edwards, D. C. and McKee, T. B. 1997. Characteristics of 20th century drought in the United States at multiple time scales. M.Sc. Thesis. Colorado State University, Fort Collins, Colorado.
- El Kenawy, A. M., McCabe, M. F., Vicente-Serrano, S. M., López-Moreno, J. I. and Robaa, S. M. 2016. Changes in the frequency and severity of hydrological droughts over Ethiopia from 1960 to 2013. Cuad. Invest. Geog. 42, 145–166.
- Eso, M., Kuning, M., Green, H., Ueranantasun, A. and Chuai-Aree, S. 2016. The Southern Oscillation Index as a random walk. Walailak J. Sci. Tech. 13, 317–327.
- Evans, J. P., Meng, X. and McCabe, M. F. 2017. Land surface albedo and vegetation feedbacks enhanced the millennium drought in south-east Australia. Hydrol. Earth Syst. Sci. 21, 409–422. doi:10.5194/hess-21-409-2017
- Feng, S., Oglesby, R. J., Rowe, C. M., Loope, D. B. and Hu, Q. 2008. Atlantic and Pacific SST influences of medieval drought in North America simulated by the Community Atmospheric Model. J. Geophys. Res. Atmo. 113, 1–14.
- Fensham, R. J., Fairfax, R. J. and Archer, S. R. 2005. Rainfall, land use and woody vegetation cover change in semi-arid Australian savanna. J. Ecology 93, 596–606. doi:10.1111/j.1365-2745.2005.00998.x
- Fuller, D. O. and Ottke, C. 2002. Land cover, rainfall and land-surface albedo in West Africa. Clim. Change 54, 181–204. doi:10.1023/A:1015730900622
- Gebrehiwot, T., van der Veen, A. and Maathuis, B. 2011. Spatial and temporal assessment of drought in the Northern highlands of Ethiopia. Int. J. Appl. Earth Obs. Geoinf 13, 309–321. doi:10.1016/j.jag.2010.12.002
- Gergis, J. L. and Fowler, A. M. 2005. Classification of synchronous oceanic and atmospheric El Niño-Southern Oscillation (ENSO) events for palaeoclimate reconstruction. Int. J. Climatol. 25, 1541–1565. doi:10.1002/joc.1202
- Gul, M., Kotak, Y., Muneer, T. and Ivanova, S. 2018. Enhancement of albedo for solar energy gain with particular emphasis on overcast skies. Energies 11, 2881. doi:10.3390/en11112881
- Harris, I. C. and Jones, P. D. 2017. Climatic Research Unit (CRU) Time-Series (TS) version 4.01 of high-resolution gridded data of month-by-month variation in climate (Jan. 1901- Dec. 2016). Centre for Environmental Data Analysis.
- Henderson-Sellers, A. and Hughes, N. A. 1982. Albedo and its importance in climate theory. Progr. Phys. Geog. 6, 1–44. doi:10.1177/030913338200600101
- Herrmann, S. M., Anyamba, A. and Tucker, C. J. 2005. Recent trends in vegetation dynamics in the African Sahel and their relationship to climate. Global Environ. Change 15, 394–404. doi:10.1016/j.gloenvcha.2005.08.004
- Hoell, A. and Funk, C. 2013. The ENSO-related West Pacific Sea surface temperature gradient. J. Climate 26, 9545–9562. doi:10.1175/JCLI-D-12-00344.1
- Hoerling, M. and Kumar, A. 2003. The perfect ocean for drought. Science 299, 691–694. doi:10.1126/science.1079053
- Hu, B., Lucht, W., Strahler, A. H., Barker Schaaf, C. and Smith, M. 2000. Surface albedos and angle-corrected NDVI from AVHRR observations of South America. Rem.Sens. Environ. 71, 119–132. doi:10.1016/S0034-4257(99)00050-4
- Interstate Technology Regulatory Council. 2013. Groundwater statistics and monitoring compliance - statistical tools for the project life cycle - Guidance document.
- Janicot, S., Moron, V. and Fontaine, B. 1996. Sahel droughts and Enso dynamics. Geophys. Res. Lett. 23, 515–518. doi:10.1029/96GL00246
- Juszak, I., Erb, A. M., Maximov, T. C. and Schaepman-Strub, G. 2014. Arctic shrub effects on NDVI, summer albedo and soil shading. Rem. Sens. Environ. 153, 79–89. doi:10.1016/j.rse.2014.07.021
- Kidwell, A., Han, L., Jo, Y. H. and Yan, X. H. 2017. Decadal Western Pacific warm pool variability: a centroid and heat content study. Scient. Reports 7, 1–9.
- Kiros, A. 2014. GIS and RS based assessment of area exclosure and vegetation cover change in KoraroTabia, HawzenWoreda. Ph.D. Thesis. Mekelle University.
- Knaff, J. A. and Landsea, C. W. 1997. An El Niño–Southern Oscillation Climatology and Persistence (CLIPER) forecasting scheme. Wea. Forecasting 12, 633–652. doi:10.1175/1520-0434(1997)012<0633:AENOSO>2.0.CO;2
- Konnen, G. P., Jones, P. D., Kaltofen, M. H. and Allan, R. J. 1998. Pre-1866 extensions of the Southern Oscillation Index using early Indonesian and Tahitian meteorological readings. J. Climate 11, 2325–2339. doi:10.1175/1520-0442(1998)011<2325:PEOTSO>2.0.CO;2
- Kravitz, B., Rasch, P. J., Wang, H., Robock, A., Gabriel, C. and co-authors. 2018. The climate effects of increasing ocean albedo: an idealized representation of solar geoengineering. Atmos. Chem. Phys. 18, 13097–13113. doi:10.5194/acp-18-13097-2018
- Laux, P., Nguyen, P. N. B., Cullmann, J. and Kunstmann, H. 2017. Impacts of land-use/land-cover change and climate change on the regional climate in the central vietnam. In: Land Use and Climate Change Interactions in Central Vietnam (eds. A. Nauditt and L. Ribbe). Springer, Singapore, pp. 143–151.
- Levitus, S., Antonov, J. I., Boyer, T. P. and Stephens, C. 2000. Warming of the World Ocean. Science 287, 2225–2229. doi:10.1126/science.287.5461.2225
- Li, Z. and Guo, X. 2012. Detecting Climate effects on vegetation in northern mixed prairie using NOAA AVHRR 1-km time-series NDVI data. Rem. Sens. 4, 120–134. doi:10.3390/rs4010120
- Lin, Z. and Li, Y. 2012. Remote influence of the tropical Atlantic on the variability and trend in North West Australia summer rainfall. J. Climate 25, 2408–2420. doi:10.1175/JCLI-D-11-00020.1
- Liu, W. T. and Kogan, F. N. 1996. Monitoring regional drought using the vegetation condition index. Int. J. Rem. Sens. 17, 2761–2782. doi:10.1080/01431169608949106
- Lofgren, B. M. 1995. Surface albedo–climate feedback simulated using two-way coupling. J. Climate 8, 2543–2562. doi:10.1175/1520-0442(1995)008<2543:SAFSUT>2.0.CO;2
- Lu, J. 2009. The dynamics of the Indian Ocean sea surface temperature forcing of Sahel drought. Clim. Dyn. 33, 445–460. doi:10.1007/s00382-009-0596-6
- Lu, J. and Delworth, T. L. 2005. Oceanic forcing of the late 20th century Sahel drought. Geophys. Res. Lett. 32, 1–5.
- Lweendo, M., Lu, B., Wang, M., Zhang, H. and Xu, W. 2017. Characterization of droughts in humid subtropical region, Upper Kafue River Basin (Southern Africa). Water 9, 242. doi:10.3390/w9040242
- Mahmood, R., Pielke, R. A., Hubbard, K. G., Niyogi, D., Dirmeyer, P. A. and co-authors. 2014. Land cover changes and their biogeophysical effects on climate. Int. J. Climatol. 34, 929–953. doi:10.1002/joc.3736
- McLean, J. D., De Freitas, C. R. and Carter, R. M. 2009. Influence of the Southern Oscillation on tropospheric temperature. J. Geophys. Res. Atmos. 114, 1–8.
- Michelle, L., Tippett, M. K. and Barnston, A. G. 2015. Characterizing ENSO coupled variability and its impact on North American seasonal precipitation and temperature. J. Climate 28, 4231–4245.
- Mitchell, T. D. and Jones, P. D. 2005. An improved method of constructing a database of monthly climate observations and associated high-resolution grids. Int. J. Climatol. 25, 693–712. doi:10.1002/joc.1181
- Munro, R. N., Deckers, J., Haile, M., Grove, A. T., Poesen, J. and co-authors. 2008. Soil landscapes, land cover change and erosion features of the Central Plateau region of Tigrai, Ethiopia: photo-monitoring with an interval of 30 years. Catena 75, 55–64. doi:10.1016/j.catena.2008.04.009
- Mutai, C. C. and Ward, M. N. 2000. East African rainfall and the tropical circulation/convection on intraseasonal to interannual timescales. J. Climate 13, 3915–3939. doi:10.1175/1520-0442(2000)013<3915:EARATT>2.0.CO;2
- Nandkeolyar, N., Raman, M., Kiran, G. S. and Ajai, 2013. Comparative analyses of sea surface temperature pattern in the Eastern and Western Gulfs of Arabian Sea and the Red Sea in recent past using satellite data. Int. J. Oceanog. 2013, 1–16. doi:10.1155/2013/501602
- Nega, B., Adenew, B. and Gebre Sellasie, S. 2003. Current land policy issues in Ethiopia. Ethiopian Economic Policy Research Institute - Eldis, pp. 103–124.
- Ning, T., Liu, W., Lin, W. and Song, X. 2015. NDVI variation and its responses to climate change on the Northern Loess Plateau of China from 1998 to 2012. Adv. Meteorol. 2015, 1–10. doi:10.1155/2015/725427
- Nobre, P. and Srukla, J. 1996. Variations of sea surface temperature, wind stress, and rainfall over the Tropical Atlantic and South America. J. Climate 9, 2464–2479. doi:10.1175/1520-0442(1996)009<2464:VOSSTW>2.0.CO;2
- Norton, C. C., Mosher, F. R. and Hinton, B. 2002. An investigation of surface albedo variations during the recent sahel drought. J. Appl. Meteor. 18, 1252–1262.
- Nury, A. H. and Hasan, K. 2016. Analyses of drought in northwestern Bangladesh using standardized precipitation index and its relation to southern oscillation index. Environ. Engin. Res. 21, 58–68. doi:10.4491/eer.2015.115
- Nyssen, J., Poesen, J., Haile, M., Moeyersons, J., Deckers, J. and co-authors. 2009. Effects of land use and land cover on sheet and rill erosion rates in the Tigray highlands, Ethiopia. Zeit. Fur. Geo. 53, 171–197. doi:10.1127/0372-8854/2009/0053-0171
- Pant, G. B. and Parthasarathy, S. B. 1981. Some aspects of an association between the southern oscillation and Indian summer monsoon. Arch. Met. Geoph. Biocl, Ser. B. 29, 245–252. doi:10.1007/BF02263246
- Peters, A. J., Walter-Shea, E. A., Ji, L., Viña, A., Hayes, M. J. and co-authors. 2002. Drought monitoring with NDVI-based standardized vegetation index. Photogram. Engin. Rem. Sens. 68, 71–75.
- Pielke, R. A., Marland, G., Betts, R. A., Chase, T. N., Eastman, J. L. and co-authors. 2002. The influence of land-use change and landscape dynamics on the climate system: relevance to climate-change policy beyond the radiative effect of greenhouse gases. Phil. Trans. R. Soc. London. Ser. A.: Math. Phys. Engin. Sci. 360, 1705–1719. doi:10.1098/rsta.2002.1027
- Raitsos, D. E., Hoteit, I., Prihartato, P. K., Chronis, T., Triantafyllou, G. and co-authors. 2011. Abrupt warming of the Red Sea. Geophys. Res. Lett. 38, n/a–n/a.
- Rajagopalan, B., Cook, E., Lall, U. and Ray, B. K. 2000. Spatiotemporal variability of ENSO and SST teleconnections to summer drought over the United States during the twentieth century. J. Climate 13, 4244–4255. doi:10.1175/1520-0442(2000)013<4244:SVOEAS>2.0.CO;2
- Rasmussen, K., Fog, B. and Madsen, J. E. 2001. Desertification in reverse? Observations from northern Burkina Faso. Glob. Environ. Change 11, 271–282. doi:10.1016/S0959-3780(01)00005-X
- Reynolds, R. W., Rayner, N. A., Smith, T. M., Stokes, D. C., Wang, W. and co-authors. 2002. An improved in situ and satellite SST analyses. J. Climate 15, 1609–1625. doi:10.1175/1520-0442(2002)015<1609:AIISAS>2.0.CO;2
- Reynolds, R. W., Smith, T. M., Liu, C., Chelton, D. B., Casey, K. S. and co-authors. 2007. Daily high-resolution-blended analyses for sea surface temperature. J. Climate 20, 5473–5496. doi:10.1175/2007JCLI1824.1
- Segele, Z., Leslie, L. and Tarhule, A. 2015. Sensitivity of horn of Africa rainfall to regional sea surface temperature forcing. Climate 3, 365–390. doi:10.3390/cli3020365
- Sentian, J. and Kong, S. K. 2015. The effect of land cover changes on surface temperature and precipitation in the Southeast Asia region. Adv. Sci. Lett. 21, 181–184. doi:10.1166/asl.2015.5849
- Sertel, E., Ormeci, C. and Robock, A. 2011. Modelling land cover change impact on the summer climate of the Marmara Region, Turkey. IJGW 3, 194–202. doi:10.1504/IJGW.2011.038379
- Servain, J. 1991. Simple climatic indices for the tropical Atlantic Ocean and some applications. J. Geophys. Res. 96, 15137–15146. doi:10.1029/91JC01046
- Shanko, D. and Camberlin, P. 1998. The effects of the Southwest Indian Ocean tropical cyclones on Ethiopian drought. Int. J. Climatol. 18, 1373–1388. doi:10.1002/(SICI)1097-0088(1998100)18:12<1373::AID-JOC313>3.0.CO;2-K
- Singh, R. P., Roy, S. and Kogan, F. 2003. Vegetation and temperature condition indices from NOAA AVHRR data for drought monitoring over India. Int. J. Rem. Sens. 24, 4393–4402. doi:10.1080/0143116031000084323
- Soden, B. J., Lau, N.-C. and Klein, S. A. 1999. Remote sea surface temperature variations during ENSO: evidence for a tropical atmospheric bridge. J. Climate 12, 917–932.
- Stagge, J. and Tallaksen, L. 2014. Standardized precipitation-evapotranspiration index (SPEI): Sensitivity to potential evapotranspiration model and parameters. In: Proceedings of FRIEND-Water 2014, Montpellier, France, pp. 367–373.
- Suppiah, R. 2004. Trends in the southern oscillation phenomenon and Australian rainfall and changes in their relationships. Int. J. Climatol. 24, 269–290. doi:10.1002/joc.1001
- Svoboda, M., Hayes, M. and Wood, D. 2012. Standardized Precipitation Index User Guide. World Meteorological Organization, Geneva, Switzerland.
- Teka, K., Van Rompaey, A. and Poesen, J. 2013. Assessing the role of policies on land use change and agricultural development since 1960s in northern Ethiopia. Land Use Policy 30, 944–951. doi:10.1016/j.landusepol.2012.07.005
- Tesfay, G. 2006. Agriculture, Resources Management and Institutions: a socio-economic analyses of households in Tigray, Ethiopia. PhD Thesis, Wageningen University, Wageningen.
- Tilahun, A., Islam, Z., Behaylu, A., Kassa, G. and Abere, M. 2015. Application of GIS and Remote Sensing for Land Use and Land Cover Change in Kilite Awulalo, Tigray Ethiopia. G- J. Environ. Sci. Technol. 2, 60–65.
- Trenberth, K. E. 1997. The Definition of El Niño. Bull. Amer. Meteor. Soc. 78, 2771–2777. doi:10.1175/1520-0477(1997)078<2771:TDOENO>2.0.CO;2
- Trenberth, K. E. 2019. The Climate Data Guide: Nino SST Indices (Nino 1 + 2, 3, 3.4, 4; ONI and TNI). Online at: https://climatedataguide.ucar.edu/climate-data/nino-sst-indices-nino-12-3-34-4-oni-and-tni
- Trenberth, K. E. and Caron, J. M. 2000. The southern oscillation revisited: sea level pressures, surface temperatures, and precipitation. J. Climate 13, 4358–4365. doi:10.1175/1520-0442(2000)013<4358:TSORSL>2.0.CO;2
- Ummenhofer, C. C., Sen Gupta, A., England, M. H. and Reason, C. J. C. 2009. Contributions of Indian Ocean Sea surface temperatures to enhanced East African rainfall. J. Climate 22, 993–1013. doi:10.1175/2008JCLI2493.1
- Vicente-Serrano, S. M., Beguería, S. and López-Moreno, J. I. 2010. A multiscalar drought index sensitive to global warming: the standardized precipitation evapotranspiration index. J. Climate 23, 1696–1718. doi:10.1175/2009JCLI2909.1
- Wan, Z., Wang, P. and Li, X. 2004. Using MODIS Land Surface Temperature and Normalized Difference Vegetation Index products for monitoring drought in the southern Great Plains, USA. Int. J. Rem. Sens. 25, 61–72. doi:10.1080/0143116031000115328
- Wang, Y. 2003. Nonparametric tests for randomness. ECE 461, 1–11.
- WMO and GCOS. 2015. Status of the global observing system for climate. No. GCOS-195.
- Yan, H., Sun, L., Wang, Y., Huang, W., Qiu, S. and co-authors. 2011. A record of the Southern Oscillation Index for the past 2,000 years from precipitation proxies. Nat. Geosci. 4, 611–614. doi:10.1038/ngeo1231
- Yuan, X., Li, L., Chen, X. and Shi, H. 2015. Effects of Precipitation Intensity and Temperature on NDVI-Based Grass Change over Northern China during the Period from 1982 to 2011. Rem. Sens 7, 10164–10183. doi:10.3390/rs70810164
- Zhang, Y. and Liang, S. 2018. Impacts of land cover transitions on surface temperature in China based on satellite observations. Environ. Res. Lett. 13, 024010. doi:10.1088/1748-9326/aa9e93
- Zolina, O., Dufour, A., Gulev, S. K. and S, G. 2017. Regional hydrological cycle over the Red Sea in ERA-Interim. J. Hydrometeor. 18, 65–83.