
 ?Mathematical formulae have been encoded as MathML and are displayed in this HTML version using MathJax in order to improve their display. Uncheck the box to turn MathJax off. This feature requires Javascript. Click on a formula to zoom.
Abstract
Winter (DJF) temperature and precipitation variability in an Arctic Archipelago, Svalbard is investigated for an extreme event during December 2015 as well as on interannual time scales. During December 2015–16, a strong high pressure anomaly over northern Europe channelised warm and moist air into Ny Ålesund (∼79°N and ∼11°E) resulting in extreme temperature and precipitation. This high pressure anomaly was a result of wave trains associated with the Madden Julian Oscillation (MJO). On interannual time scales, the observation site, Ny Ålesund was characterised by an increasing trend in precipitation and temperature. A composite of SLP anomalies associated with the temperature and precipitation anomalies was characterised by a high pressure anomaly over northern Europe. The second mode in the EOF of SLP anomalies during winter (DJF) also indicated the presence of a high pressure anomaly over northern Europe, extending into the Pacific. The mode was correlated significantly with the ENSO. During the study period, more than 50% of the ENSO events influenced temperature and precipitation in Ny Alesund. In the present study, the EOF-2 temporal pattern correlated strongly with La Nina in the Pacific, suggesting the generation of a high/low pressure anomaly during negative/positive ENSO phases. On interannual timescales, extremes were conspicuous, particularly when La Nina coincided with active MJO. This may be due to the fact that both processes generate similar pressure anomalies in northern Europe and reinforce each other. This study also suggests that the influence of El Nino is weaker than La Nina. It is also noted that decadal oscillations in the Pacific, particularly the Interdecadal Pacific Oscillation (IPO) also enhance the high-pressure anomalies over northern Europe. Thus, the temperature and precipitation in a high Arctic location, Ny Ålesund is interconnected, at least hemispherically and is defined by processes of different time scales.
1. Introduction
The Arctic undergoes unprecedented changes. It is very likely that the average sea-ice extent has decreased at a rate of 3.5 to 4.1% per decade over the period 1979–2012, also almost during the same time period northern Hemisphere and permafrost temperatures have also changed substantially (IPCC, Citation2013). Recent temperature trends indicate a warming of the northern high latitudes unprecedented in the past 600 years (Tingley and Huybers, Citation2013). However, proxy records extended further back in time depict a medieval period as warm as the late 20th century (Crowley, Citation2000; Divine et al., Citation2011). This result is in general agreement with the temperature trends in the Northern Hemisphere (Moberg et al., Citation2005). The changes that manifest in the Arctic are the results of long term trends and cyclic variabilities at different time scales (Polyakov et al., Citation2005). Changes in solar irradiance (Cubasch et al., Citation1997; Shindell et al., Citation2001), greenhouse gases (Delworth and Knutson, Citation2000) as well as ocean – atmosphere internal adjustment (Schlesinger and Ramankutty, Citation1994) are known causes of these oscillations. Spatial patterns such as the Arctic Oscillation (AO) induce variabilities in temperature, precipitation, sea-ice, etc (Moritz et al., Citation2002). This relationship, however, undergoes decadal variability, with intermittent periods of insignificant correlations. Since 1960, the correlation between the North Atlantic Oscillation (NAO) and SLP over the North Atlantic declined (Polyakova et al., Citation2006) suggesting a complex evolution of ocean – ice – atmosphere interactions in determining the climate variability of the Arctic.
Recent studies show that the conventional tripolar AO/NAO has shifted to a dipolar pattern (Zhang et al., Citation2008), indicating substantial changes in the atmospheric circulations and led to a breakdown of NAO sea-ice correlations in the 21st century (Maslanik et al., Citation2007). Reanalysis data suggest an increase in near surface specific humidity in all the seasons. Though large spatial differences exist in precipitation, generally the precipitation has increased in the Arctic during the past five decades (Vihma et al., Citation2016). Models with various forcing scenarios attribute precipitation changes with the decline in the sea – ice cover, remote moisture transport and local evaporation (Bintanja and Selten, Citation2014). Warming scenarios in Climate Model Inter Comparison Project (CMIP) models predict an increase in the number of atmospheric rivers in the North Atlantic (Lavers et al., Citation2013) consistent with the enhanced precipitation in the Arctic.
The past decade was characterised by dramatic changes in the Arctic. The Barents and Kara sea – ice exhibited a marked decline since 1998 (Yang and Yuan, Citation2014), whereas cloud cover increased in the recent decade (Jun et al., Citation2016). The 20th century Arctic climate is dominated by AO and the Pacific North American (PNA) like patterns. However, since the beginning of the 21st century, the spatial patterns of dominant climate modes are decidedly different and resulted in an Arctic wide positive surface temperature anomaly (Overland and Wang, Citation2005; Overland et al., Citation2008). The 21st century changes in the Arctic atmospheric circulations are also attributed to the complex feedback mechanisms associated with the Arctic sea-ice loss (Overland et al., Citation2008; Overland and Wang, Citation2010; Yang and Yuan, Citation2014), anthropogenic sources and natural chaotic variabilities. Much of these changes are prominent in the North Atlantic.
The tropics also command a part of the northern high latitude variability. Equatorial central Pacific warming results in a deepening of the polar vortex that in turn inhibits the summer ice melting and Arctic warming (Yang et al., Citation2016). Atmospheric model experiments suggest that tropical warming strongly influence NAO and result in the warming of Greenland and northeastern Canada (Ding et al., Citation2014). In another study, Lee et al. (Citation2011) propose that poleward heat fluxes associated with circulation changes excited by tropical Indian and the Pacific Ocean are responsible for polar amplification. On intraseasonal timescales, the Madden Julian Oscillations (MJO) interacts with NAO (Flatau and Kim, Citation2013) and contribute to Arctic warming (Yoo et al., Citation2011). MJO phases 2, 3, 6, 7 produce a robust PNA like pattern. MJO influence the NAO through Rossby wave teleconnection (Cassou, Citation2008; Lin et al., Citation2015). A stratospheric connection involving the northward and vertically propagating Rossby waves during an MJO has also been suggested (Garfinkel et al., Citation2012). Recently, it has been shown that MJO phases 6 to 8 results in blocking conditions over Europe at lags of 5–15 days, while reduction in blocking events occurred during MJO phases 3–5 (Henderson et al., Citation2016). The authors also note an increase in blocking frequencies with no lag during MJO phases 7 and 8. The influence of MJO may also be through its influence on ENSO. MJO rectified SST is shown to increase the strength of El Nino by ∼50% (Kessler and Kleeman, Citation2000) may subsequently enhance ENSO teleconnections as well.
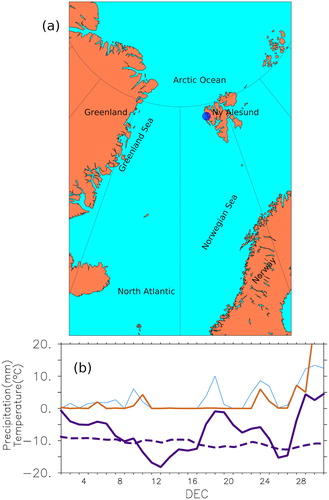
The present study attempts to understand atmospheric circulation in the past four decades in the northern hemisphere to ascertain its changes and linkages with the precipitation and air temperature at Ny Ålesund, an Arctic station located in Svalbard at 79°N 10°E (). Owing to its geographical location, Ny Ålesund offers a unique natural laboratory to observe changes associated with heat and moisture transport from the mid-latitude Atlantic. Downscaled reanalysis with realistic topography shows that western Svalbard is warmer and wetter than the eastern regions (Vikhamar-Schuler et al., Citation2019). Heat and moisture transport associated with Icelandic low and Spitzbergen current make Svalbard climate milder and wetter than the average for the latitude (Hanssen-Bauer, et al., Citation2019) This is also the location where the central Arctic warming starts becoming conspicuous. Unprecedented warming (0.5–0.9 °C) has been reported here since 2000 (López-Moreno et al., Citation2016). Extreme temperature events have also increased in Ny Ålesund (Wei et al., Citation2016). Future climate predictions show a 10 °C increase in Longyearbyen temperature by the year 2100 (Førland et al., Citation2011). A conspicuous feature in Ny Ålesund air temperature is a wintertime warming pronounced more since the late 90s. The warming is pronounced in the boundary layer below 1 km and is linked to more frequent southerly winds (Maturilli and Kayser, Citation2016). Nearly a quarter of this trend is explained by increased advection of warm and moist air (Dahlke and Maturilli, Citation2017). Some of these changes are associated with the pressure anomaly changes over northwest Europe and Greenland. Positive/negative summer temperature anomalies in Svalbard Lufthavn are associated with a high/low pressure cell over northwest Europe (Bednorz and Kolendowicz, Citation2013). Though a positive pressure anomaly over the Europe is linked to increased southerly winds, a hemispheric scale analysis linking remote and regional processes has not yet been attempted. Here we analyse winter (December, January and February (DJF)) temperature and precipitation and its links to hemispheric scale atmospheric circulation. We address the issue by analysing a specific event during December 2015 and extend the analysis to interannual timescales.
Fig. 1. (a) Location map for Ny Ålesund (b) Daily temperature and Precipitation at Ny Ålesund during December 2015. Thickest purple (solid/broken) line indicates air temperature/longterm daily mean. Precipitation from Micro Rain Radar is represented by the thin blue line and thick brown line indicates snow bucket measurement of precipitation (www.eklima.org).
2. Data and methods
We use the surface temperature and precipitation recorded at Ny Ålesund. There are two sources of data: One is the precipitation derived from a Micro rain radar (MRR), installed in November 2013 as a part of Indian Arctic Research Program. Another is the historical precipitation and temperature recorded at Ny Ålesund observation site and archived by Norwegian Meteorological Institute (MET Norway) obtained from www.eklima.org. The time period of the study is 1979–2016 and the analysis is focussed on the winter (DJF) temperature and precipitation.
Large scale atmospheric characteristics are analysed using the ERA Interim (Dee et al., Citation2011) monthly and daily fields of SLP, winds and air temperature and geopotential. EOF is performed on seasonal anomalies of SLP in the domain 0–360°, 40–90°N. EOF is a method to find variability in a single scalar field, in the present case SLP. The method finds a spatial pattern corresponding time variation and a measure of its importance, known as the percentage-variance explained. The time variation is obtained as a single time series spanning the period of analysis and is commonly known as EOF times series or expansion coefficients. The analysis decomposes the data into various modes. These may not necessarily be the physical modes and is a matter of subjective interpretation. A more detailed description of EOF can be found in Bjornsson and Venegas (Citation1997). In the present study Dawson (Citation2016) EOF library is employed to conduct the analysis for the region north of 40°N. To find how different is each pattern, a sampling error () for the eigen values is estimated following North et al. (Citation1982).
Where N is the number of observations, λ is the Eigen vector.
Correlations, wherever discussed are tested using students two tailed test at 90/95% confidence levels. These statistical methods though cannot unravel the dynamics, they sure point to possible linkages among different processes.
We first analyse a high intensity event during December 2015, followed by the investigation of large scale winter atmospheric circulation on daily as well as on seasonal (DJF) time scales. This will enable us to bring out the similarities and differences between daily and inter-annual timescales.
To understand the dynamics behind the atmospheric processes associated with sea surface temperature (SST) anomalies, a Rossby wave activity flux was derived (Takaya and Nakamura, Citation2001). The Rossby wave activity flux provides the source regions and propagation characteristics of Rossby wave anomalies. The input parameters for this is the geopotential height anomalies and the mean winds. Here the geopotential height anomalies are determined by subtracting the monthly mean from the daily values.
The Wheeler and Hendon MJO index is downloaded from http://www.bom.gov.au/climate/mjo/ is used to address the role of MJO in temperature and precipitation of Ny Ålesund.
Heat and moisture advection is calculated as -U. where U is the horizontal velocity and
is the gradient of temperature or humidity. Positive/negative values indicate advection from region having larger/smaller temperature and humidty to regions of smaller/larger temperature and humidity. The interdecadal Pacific Oscillation (Henley et al., Citation2015) is downloaded from www.ersl.noaa.gov.
3. Results and discussion
3.1. Temperature and precipitation during December 2015
Ny Ålesund during December 2015 was wetter as well as warmer than normal. The daily surface temperature measured at Ny Ålesund observation site was about 5 °C, which is ∼13 °C above normal during the last week of December (). Simultaneously the precipitation also showed an increase by about 13 mm. Warm and wet conditions were also noticed during the third week of December as well. However, it was during the last week of December that the temperature and precipitation were maximum. During this event, the snow bucket recorded values higher than the MRR. Nonetheless, both the measurements agreed with the timing of the maximum precipitation. However, MRR recorded higher values when the bucket derived precipitation was weak. There could be two reasons for the difference in precipitation values between MRR and the snow bucket. Firstly, MRR is located almost a kilometre away from the bucket observation site. Secondly, the snow bucket might not capture the snow during the low intensity events. We also note the second maximum in precipitation on 19 December. This, however, was not captured in the snow bucket measurements. We also note a corresponding increase in temperature during this period. Analysis of precipitation rate profiles (not shown) shows that this event was mostly confined above one-kilometre height. A detailed analysis of MRR data, however, is beyond the scope of the present study. Does the anomaly in temperature and precipitation relate to largescale atmospheric circulation? This link is explored by analysing SLP and winds over the Arctic ().
Fig. 2. 5-Day averaged SLP (contours (hPa)), Winds (vectors) north of 40 N and air temperature (a) 1–5 December, (b) 6–10 December, (c) 11–15 December, (d) 16–20 December, (e) 21–25 December, (f) 26–31 December. Latitude circles are at 25-degree intervals, while meridians are drawn at 60 degree intervals. The colour map indicates air temperature (°C)W.
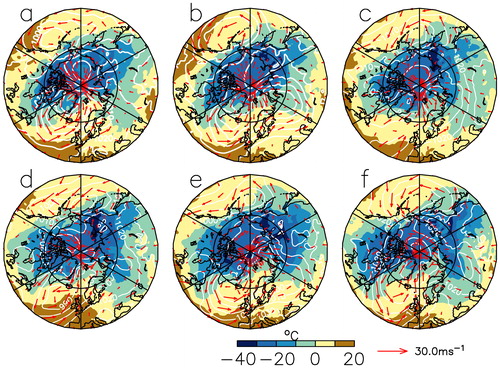
Weekly atmospheric circulation was characterised by a low-pressure system over the North Atlantic during the first week of December (). During the following week, the centre of this low-pressure was shifted to the Barents Sea (). By the third week of December, a high-pressure cell began to form over northwestern (∼15°E,50°N) Europe and a low-pressure system formed near Iceland (). Both the low and the high intensified during the last week (). Corresponding to the changes in the SLP, winds were predominantly southerly except during the second week when Ny Ålesund experienced northerlies (). Strong warm and moist southerly winds blew into the Arctic during the last week of December, warming the Arctic atmosphere ∼ 13 °C above normal (). An important feature that emerges from the analysis of weekly circulation is the presence of a high-pressure anomaly over northwestern Europe, between 0–45°E and 40–70°N) when the precipitation and temperature were maximum.
Previous studies indicate that correlation of daily temperature anomalies in Svalbard with SLP is characterised by a strong zonal gradient in the North Atlantic, with a high-pressure cell located over the Barents and Kara sea and a low over Iceland (Bednorz and Kolendowicz, Citation2013; Bednorz et al., Citation2016). This zonal gradient channels warm and humid mid latitude air masses into the Arctic. The high-pressure anomalies over Europe were studied by various authors. Luo, Xiao, Yao et al. (Citation2016) suggested the blocking near the Ural Mountains interacts with positive NAO events resulting in cold anomalies over Europe. The location of the high-pressure anomalies obtained during December 2015 was nearer to the location for the northward displaced Ural blocking (Luo, Xiao, Diao et al., Citation2016). Studying the dominant pattern of atmospheric circulation, Crasemann, et al (Citation2017) reported that the sea – ice loss in the Arctic triggers Rossby wave anomalies that propagate downstream intensifying the Scandinavian pattern, during December January. The authors also noted variability in Svalbard temperature associated with this pattern. Low sea – ice years in the Barents and Kara Seas were accompanied by a high-pressure anomaly pattern along the Siberian coast as well (Inoue et al., Citation2012). Therefore, some of the generation mechanisms of the high-pressure anomaly over northern Europe are known, however, in addition to the above-mentioned mechanisms, additional mechanisms may also be present and need to be explored, particularly those arising from the tropics. In order to ascertain this, we computed the Rossby wave activity flux for the last week of December 2015.
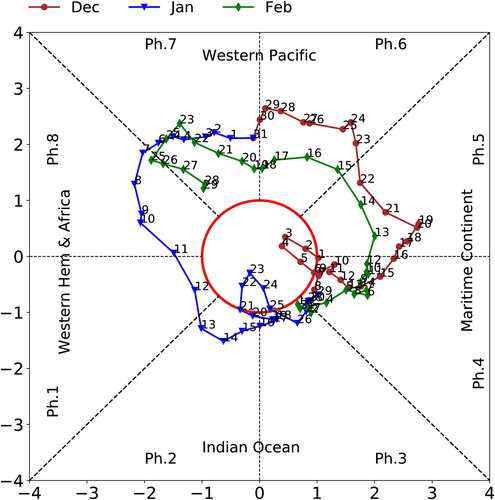
The Rossby wave activity flux indicated wave train emanating from the tropical western Pacific and was characterised by a high-pressure anomaly over northwestern Europe (). MJO phases 6 to 8 results in blocking conditions over Europe at lags of 5–15 days (Henderson et al., Citation2016). During the last week of December, MJO was in phase 6 (western Pacific, ) from 23 to 29 December 2015, suggesting the generation of high pressure anomaly over northern Europe by MJO. In another study Seo et al. (Citation2016) delineated the Rossby wave pattern associated with MJO. This study showed propagation of wave train from tropical Pacific and was characterised by a positive pressure anomaly over northern Europe and co-occurred with a positive NAO. In another study, Hu et al. (Citation2016) suggests that warming over Central Pacific lead to a wave train that consists of a high-pressure anomaly over northern Europe. Numerical modelling experiments using prescribed SST anomalies in western Pacific on interannual time scales resulted in a high-pressure anomaly over northern Europe (Kucharski et al., Citation2006). All these results imply that tropical convection in the western Pacific could potentially result in a high-pressure anomaly over different regions in Europe. In the present case, the MJO was active in the western Pacific and timing of the wave train anomalies associated with MJO coincided with the period of heavy rainfall and strong temperature anomalies in Ny Ålesund, indicating the influence of tropical features on high Arctic weather.
Fig. 3. Rossby wave activity flux computed as Takaya and Nakamura (Citation2001) for (a) 28 December 2015 and (b) 29 December 2015 AT 250 hPa. Wave trains emanating from western Pacific seen during both the days. Here daily geopotential height anomalies and monthly mean winds are used to derive the flux. Shading represents geopotential anomaly.
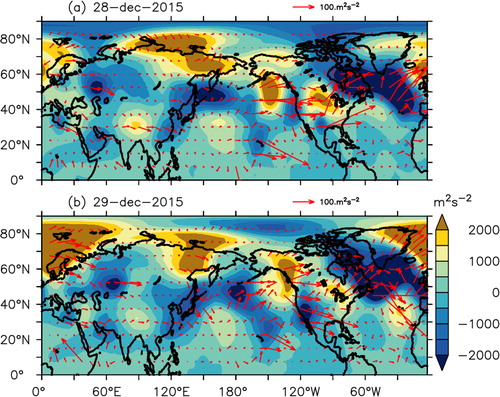
Fig. 4. Wheeler Hendon diagram depicting phases for MJO during DJF of 2015–16. Brown, blue, green lines represent phases of MJO during December, January and February, respectively.
Another factor to consider during the last week of December was the cyclone near Iceland. NAO favours the growth of explosive cyclones in the North Atlantic (Gomara et al., Citation2016). Thus, the cyclogenesis could be due to NAO as NAO was positive during this time (Supplementary material, Fig. S1).
In short, atmospheric variability on daily time scales during December 2015, revealed two important features that lead to enhanced precipitation in Ny Ålesund. The first one was a large scale positive SLP anomaly over northwestern Europe and a cyclone near Iceland. The SLP anomaly was at its peak during the last week of December when the cyclone over Iceland was developed. Wave trains from western tropical Pacific as well as, a positive NAO co-occurred during this time. It is known that the positive phase of NAO is set by tropical convection in the western tropical Pacific (e.g. Cassou, Citation2008). Thus, the present analysis suggests that tropical convection plays a role in the generation of the pressure anomaly in northwestern Europe and a cyclonic storm over Iceland observed during the last week of December 2015. Interaction of these processes channelised heat and moisture into the Arctic resulting in above normal temperature and precipitation in Ny Ålesund ().
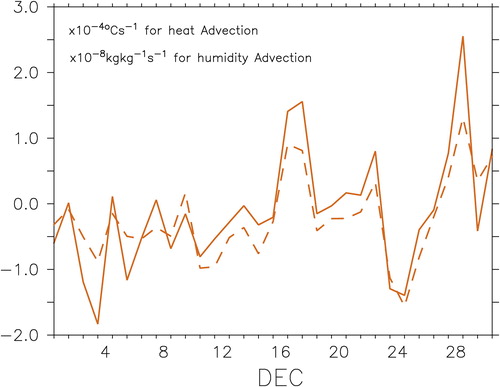
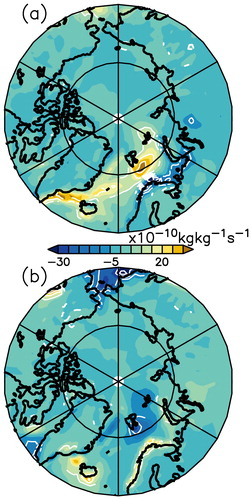
Fig. 5. Heat (×10-4 °Cs−1)and moisture advection (×10-8 kg kg−1 s−1) averaged over the region 10°W to 10°E and 60 to 80°N during December 2015 integrated over 1000 to 700 hPa.
3.2. Long term variability
Summarising the case study described in the last section, we found that a high-pressure anomaly over north western Europe interacted with a cyclone during the last week of December 2015 and channelised warm and moist air into the Arctic. The high-pressure anomaly has occurred in conjunction with MJO in the tropics. Rossby wave trains were found to emanate from the western Pacific when MJO was active. (Phase 6), intensifying the high-pressure anomaly over northern Europe. This high-pressure anomaly along with a cyclone drove massive heat and moisture into the high Arctic. Thus, in this section, we investigate the circulation features on longer time scales to understand the occurrence of high pressure anomalies over northern Europe on and its impact on temperature and precipitation at Ny Ålesund. Here we focus more on the hemispheric scale features than regional ones. For example the Scandinavian pattern, defined as the third EOF pattern of SLP anomalies between 50E and 80E in the North Atlantic is correlated with the precipitation at NyAlesund (R = 0.46), while its relationship with the temperature is weak during winter.
In order to understand the influence of circulation on the temperature and precipitation, a correlation analysis of temperature and precipitation anomalies with SLP anomalies was conducted. As revealed in other studies both the time series were correlated strongly with a high pressure anomaly over northern Europe (Supplementary material, Fig. S2). However, there were subtle differences in both the patterns, the pattern for precipitation (Supplementary material, Fig. S2a) was strong between 0 and 60 E while the pattern for temperature was strong between 60 and 120 E (Supplementary material, Fig. S2b).
In order to ascertain whether the above pressure anomaly patterns form leading modes of SLP variability over northern Europe and whether they are related to tropics, an EOF of wintertime (DJF) SLP anomalies was performed and results are summarised below.
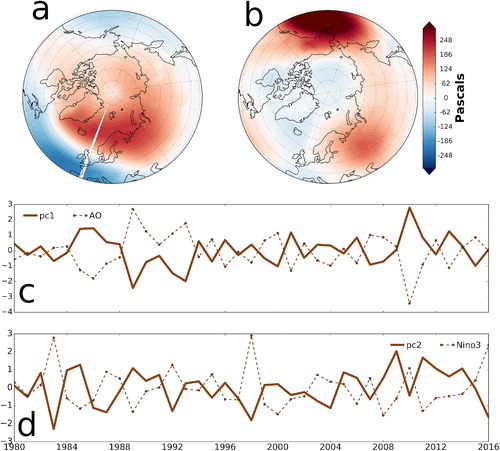
Over interannual timescales, the leading mode of SLP, EOF for winter depicted the Arctic oscillation (). The high over the Azores in the EOF-1 has weakened in EOF-2 (). A striking difference was the presence of high-pressure anomalies over northern Europe (60°N) and to the east of the Bering Strait. Low-pressure anomalies over the Arctic extended southwards into North America gave a wavenumber 1 structure to the EOF-2. Mode 1 and 2 explained 33 and 17 per cent of the total variance. Mode-1 clearly depict the AO (e.g. Wallace and Thompson, Citation2002). Sampling error computed for the first two modes indicate that they are well separated (Supplementary material, Fig. S3). Subsequent modes were not well separated from the EOF-2 as their sampling errors overlap. Hence, we investigate EOF-2 further. Interestingly, the temporal function of this mode depicted a weak positive trend. This is largely consistent with the studies by Luo, Xiao, Diao et al. (Citation2016) and Maturilli and Kayser (Citation2016). They noted that the high-pressure anomaly over northern Europe was intense since 2000.
Fig. 6. Spatial patterns of EOF of seasonal (DJF) SLP anomalies in the region 40–90 N. (a) For the first mode (explains 33% of the variance) and (b) second mode (explains 17% of the variance). (c) Time series of EOF-1 and (d) EOF-2. The dashed line in (c) and (d) represents AO and Nino3 SST anomalies respectively. The correlation between AO time series of EOF-1 is –0.9 while the correlation of Nino3 SST anomalies with time series of EOF-2 is –0.7.
Temperature and precipitation at Ny Ålesund are strongly correlated with a high-pressure cell over Europe (Bednorz et al., Citation2016) Therefore the circulation changes over northern Europe and sub-polar North Atlantic are vital in warm and wet conditions in parts of Arctic. Some of these circulation changes are modulated by sea – ice loss as the Arctic undergoes rapid sea – ice loss. In Section 3.1, we have discussed the Barents and Kara sea-ice loss influencing the high-pressure anomalies over northern Europe. We extend the discussion further. Autumn sea – ice extent is related to blocking patterns in northern Europe particularly in Scandinavia, while the reduction in winter sea – ice extent has a more widespread positive co-variability in northern Europe (Tang et al., Citation2013). Winter atmospheric circulation in the Arctic is connected to the baroclinic response of atmosphere to the summer sea -ice loss. This is characterised by negative sea – ice anomalies in the Chuckchi and Siberian Seas during summer, inducing a negative AO like pattern during winter (Jaiser et al., Citation2012). Similar results were obtained by Overland and Wang (Citation2010). These studies indicate that the winter atmospheric circulation is increasingly driven by summer sea – ice loss. This inturn will generate a negative AO like pattern during winter as represented in EOF-1. Therefore, even though an AO type atmospheric response is suggested for summer sea – ice loss, the correlation associated with mode-1 that represent AO and temperature and precipitation at Ny Alesund was low. The PC of EOF-2 was inversely correlated (∼ −0.73) with the Nino 3/3.4 SST anomalies and exhibited distinct interannual variability while spatial pattern consisted of a high pressure anomaly over northwestern Europe. Do tropical SST anomalies on interannual time scales generate pressure anomalies that eventually influence Ny Ålesund weather? It is important to note that EOF-2 is different in spatial pattern than from the SLP patterns for positive and negative anomalies for temperature and precipitation at Ny Alesund. Thus, if ENSO impacts the Ny Alesund climate, it would be through the modification of local pressure patterns responsible for temperature and precipitation anomalies as depicted in Fig. S2 (Supplementary material).
Tropical forcing associated with ENSO produces circulation anomalies through Rossby wave propagation and meridional eddy transport (Seager et al., Citation2003; Dong and Dai, Citation2015). A well-defined wave train pattern characterised by a negative geopotential height anomaly over Northern Europe was present in observations during 1997–98 El Nino (Kumar et al., Citation2001). Examining this in detail is beyond the scope of the present study. Suffice to state here that the inverse correlation suggests that during La Nina/El Nino Northern Europe will be characterised by a positive/negative pressure anomaly. The Tropical Pacific not only have interannual variability. But there is also a pronounced decadal variability which may also contribute to the observed high latitude SLP anomalies much the same way as in the case of interannual ENSO. A correlation of the wintertime (DJF) IPO with DJF SLP anomalies after removing the Arctic Oscillation component by linear regression was characterised by a wave train emanating from the western Pacific with a negative correlation over northern Europe (Supplementary material, Fig. S4). It is also pertinent to note that the last decade was characterised by cold anomalies in the equatorial Pacific indicating a cold phase of IPO (Henley et al., Citation2015). Thus, as the tropical Pacific SST cools, we can expect a persistent background positive pressure anomaly over north-western Europe in the past decade. Positive SLP anomalies over north western Europe during the past decade is an indication of this (e.g. Luo, Xiao, Diao et al., Citation2016; Maturilli and Kayser, 2016). Therefore, interannual and decadal variabilities in the tropical Pacific also generate a high/low pressure anomaly over northern Europe during cold/warm phases.
What are the implications of this to the 2015–16 event described in Section 3.1? The Year 2015–16 was characterised by an El Nino. A positive SST anomaly in the equatorial Pacific generates a negative SLP anomaly over Northern Europe. DJF temperature and precipitation at Ny Ålesund exhibited co variability with the Equatorial Pacific SST anomalies except for a couple of years (, in stars circle indicates La Nina/El Nino years with SST anomalies >0.5 °C). There were 14 La Nina events during 1980–2016, out of which nine negative episodes were characterised by positive temperature anomalies in Ny Ålesund, while the number of El Ninos were 10. Out of this seven were characterised by negative temperature anomalies in Ny Ålesund. Precipitation also revealed a similar relationship, positive precipitation anomalies were noticed during 8 out of 14 La Nina years while seven El Nino years were characterised by negative precipitation anomalies (). We have constructed SLP anomaly composite of Ny Alesund temperature and precipitation during the eight La Nina and seven El Nino years when the temperature and precipitation were positive and negative, respectively. The analysis clearly depicts the pattern represented in the EOF-2 (). Please note that the composite is different from the correlation (Fig. S2) because the composite only contains years in which La Nina and El Nino generated positive and negative anomalies, respectively. Also, the heat and moisture transport during these years are significant near Svalbard, indicating the influence of El Nino/LaNina ( and ). It is also important to note that El Nino was not as significant as La Nina over northern Europe and in Svalbard. Let us examine a few extreme events in Ny Alesund to further confirm this.
Fig. 7. DJF time series of (a) Precipitation (mm) and (b) Temperature (°C) observed at Ny Ålesund from 1979 to 2016. The lower panel (c) indicates NINO3 SST anomalies. The dots in the line indicate NINO3 SST anomalies greater than 0.5 C. It can be seen that some of the strongest precipitation and temperature occurred during La Nina years.
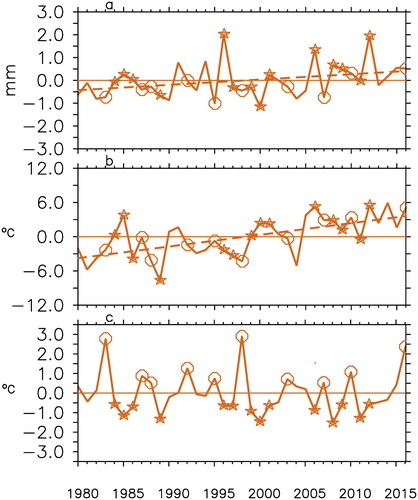
Fig. 8. Composites of SLP anomalies during positive (a,c) and negative (b,d) temperature (a,b) and precipitation (c,d) anomalies in Ny Alesund. The composites are constructed for years when temperature/precipitation anomalies were positive and negative during La Nina and El Nino respectively. Contours represent regions of significance at 95% confidence level.
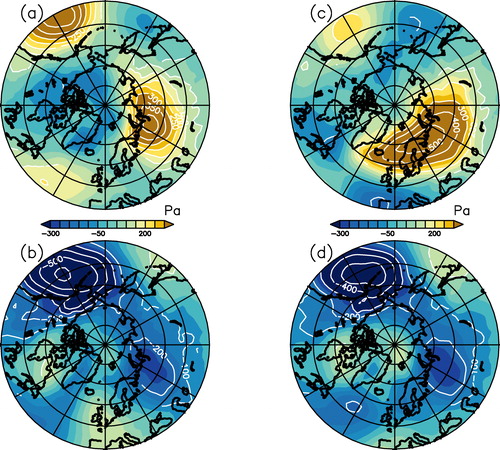
Fig. 9. Composites of temperature advection at 1000 hPa during positive (a) and negative (b) temperature anomalies in Ny Ålesund. The composites are constructed for years when temperature anomalies were positive and negative during La Nina/El Nino respectively. Contours represent regions of significance at 95% confidence level.
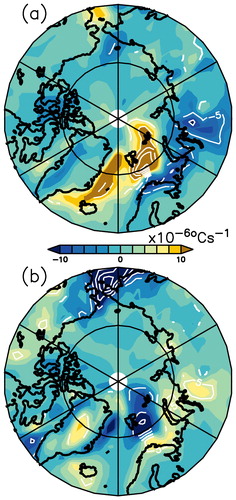
Fig. 10. Composites of specific humidity advection at 1000 hPa during positive (a) and negative (b) precipitation anomalies in NyÅlesund. The composites are constructed for years when precipitation anomalies were positive and negative during La Nina/El Nino respectively. Contours represent regions of significance at 95% confidence level.
The three strongest peaks in temperature and precipitation in Ny Ålesund were during 1995–96, 2005–2006 and 2011–2012 when cold conditions prevailed in the tropical Pacific and during active phases of MJO. During 1995–96, MJO was active in the western Pacific during most of December. During 2005–06, MJO was active during January and February and went through all the phases during these two months. A similar characteristic for MJO was noted during 2011–12 as well. Enhanced temperature and precipitation were noticed during 1984–85 also. This was a La Nina year with MJO active during most of the time in winter (). All these years were characterised by a high pressure anomaly over north western Europe () and enhanced temperature and precipitation in Ny Ålesund. The year 1995–96 turned out to be an anomaly since the precipitation was positive, but the temperature did not show an expected increase. This was because, the high pressure anomaly over northern Europe was shifted westward, leading to more zonal westerlies at Ny Alesund. Also, it is interesting to note that as the pressure anomalies are shifted towards west, the southerly flow takes place over the cold east Greenland current losing much of the heat there.
Fig. 11. Wheeler Hendon diagrams for the years of maximum temperature and precipitation .
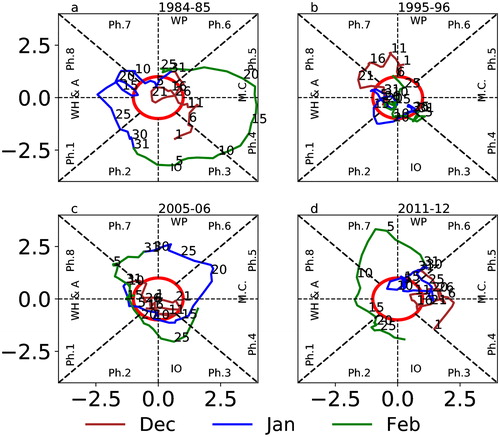
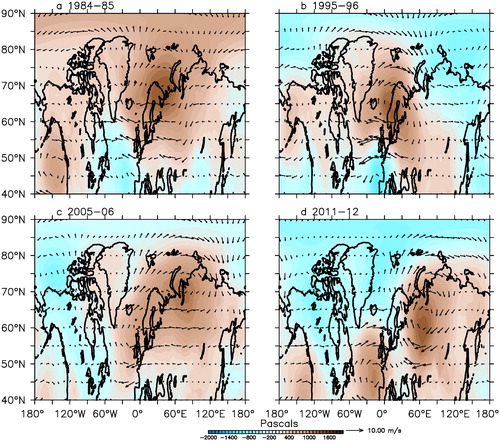
Fig. 12. DJF SLP anomalies north of 40N for 4 years when MJO was active as in . A high pressure anomaly can be noticed in the Northern Europe on all the years. The southerly flow associated with the pressure anomalies direct heat and moisture in to the Ny Ålesund influencing temperature and precipitation.•
The warm west Spitzbergen current makes the western Svalbard warmer generating a strong east-west temperature gradient. Hence the westerlies blowing from Greenland coast will generate a cold east ward moving front, upon interacting with the warmer Svalbard result in precipitation and low temperatures.
This analysis makes the influence clear, however, some years the mechanisms cannot be explained and could be due to the influence of other local and/or remote factors that need to be examined.
Also, it is interesting to note that 1997–98 and 2015–16 El Nino years had similar strength during DJF. However, the average temperature during 1997–98 was −15 °C (4 °C below normal), whereas during 2015–16 the average temperature was −6 °C (5 °C above normal). There could be two reasons for this. (1) The decadal trend in the tropical Pacific was predominantly negative in the past 15 years indicating a negative IPO. The teleconnection associated with this can generate high-pressure anomalies over northern Europe and modulate interannual ENSO variability. (2) The teleconnection of MJO; Even though 2015–16 was an El Nino year the MJO wave trains during last week of December resulted in extreme temperature and precipitation, whereas during DJF of 1997–98 MJO activity was relatively weak (Supplementary material, Fig. S5). Also, the impact of decadal variability in the tropical Pacific might o have aided the intensification of MJO induced wave train anomalies during 2015–16.
Precipitation during El Nino years was relatively, weak but strong MJO activity can be noticed sometimes, for example, 2006–07, 1991–92 (Figure not presented). However, as discussed earlier, 1997–98 was a strong El Nino year coupled with weak MJO activity. This resulted in negative pressure anomalies over northern Europe and a reduction in precipitation and temperature at Ny Ålesund.
4. Conclusion
We have investigated the temperature and precipitation variability in the Arctic from observations at Ny Ålesund. Daily variability of temperature and precipitation during December 2015 was influenced by a high-pressure anomaly over north western Europe as well as by the cyclones near Iceland. However, the study points out that the high pressure anomalies conducive for precipitation and temperature anomalies at Ny Alesund had subtle differences. Precipitation is mostly generated by a high pressure anomaly with its core between 0 and 60E while that for the temperature it was between 60 and 90E. Previous studies have highlighted the role of sea-ice loss in the Barents and Kara seas and NAO in generating a high-pressure anomaly over Europe. This analysis indicates that tropical processes like MJO, ENSO, IPO also influence the atmospheric pressure over Europe and modulate the local circulation patterns. During the last week of December 2015, the high-pressure anomaly, observed as part of a Rossby wave train emanating from the western tropical Pacific (MJO phase 6), when interacted with a cyclone, possibly generated by NAO resulted in massive heat and moisture flux to the Arctic during December 2015. An examination of historical data of SLP anomalies revealed that AO as the leading mode of climate variability, however, the second mode of SLP anomalies north of 40°N was characterised by a high pressure anomaly over northwestern Europe. This mode was more correlated with the tropical Pacific SST, suggesting positive/negative pressure anomalies over north western Europe during La Nina/El Nino. Analysis suggests La Nina and MJO conditions were characterised by high precipitation in Ny Ålesund, suggesting the role of the high pressure anomaly in driving heat and moisture into the Arctic. There are exceptions to this, e.g. During the 1995 La Nina, the precipitation was increased while temperature dropped because of a westward shift in the high pressure centre. The study also suggests that the high pressure anomaly covaries with the decadal oscillations in the Pacific. This background anomaly is conducive for the amplification of MJO and La Nina impacts as both these processes have similar pressure anomalies and reinforce each other. The EOF-2 has a positive pressure anomaly over north western Europe, however, the pattern is different from the correlation pattern for temperature and precipitation, suggesting an interaction of EOF-2 with the two patterns related with the temperature and precipitation anomalies at Ny Alesund. Thus, the extreme event during 2015–16 examined in the present study was characterised by higher than normal temperature and precipitation and could be a result of teleconnections from tropics and local processes like the cyclone formed near Iceland. ENSO years, particularly La Nina years have more chances for extreme temperature and precipitation anomalies in Ny Alesund.
Acknowledgements
The authors thank Director NCPOR for his keen interest and encouragement for this study. SST was obtained from Met Office Hadley Centre web site http://hadobs.metoffice.com/hadisst/data/download.html. ERA interim was downloaded from http://apps.ecmwf.int/datasets/data/. We thank two anonymous referees for their comments. This is NCAOR contribution J-69/2019-20. One of the co-authors, Sheeba Nettukandy Chenoli would like to acknowledge FRGS project FP059-2019A.
Disclosure statement
No potential conflict of interest was reported by the authors.
Supplemental data
Supplemental data for this article can be accessed here.
References
- Bednorz, E., Kaczmarek, D. and Dudlik, P. 2016. Atmospheric conditions governing anomalies of the summer and winter cloudiness in Spitsbergen. Theor. Appl. Climatol. 123, 1–10. doi:10.1007/s00704-014-1326-5
- Bednorz, E. and Kolendowicz, L. 2013. Summer mean daily air temperature extremes in Central Spitsbergen. Theor. Appl. Climatol. 113, 471–479. doi:10.1007/s00704-012-0798-4
- Bintanja, R. and Selten, F. M. 2014. Future increases in Arctic precipitation linked to local evaporation and sea-ice retreat. Nature 509, 479–482. doi:10.1038/nature13259
- Bjornsson, H. and Venegas, S. A. 1997. A Manual for EOF and SVD Analyses of Climate Data. CGCR report no. 97–1.
- Cassou, C. 2008. Intraseasonal interaction between the Madden-Julian Oscillation and the North Atlantic Oscillation. Nature 455, 523–527. doi:10.1038/nature07286
- Crasemann, B., Handorf, D., Jaiser, R., Dethloff, K., Nakamura, T. and co-authors. 2017. Can preferred atmospheric circulation patterns over the North-Atlantic-Eurasian region be associated with arctic sea ice loss? Polar Sci. 14, 9–20. doi:10.1016/j.polar.2017.09.002
- Crowley, T. 2000. Causes of climate change over the past 1000 years. Science 289, 270–277. doi:10.1126/science.289.5477.270
- Cubasch, U., Voss, R., Hegerl, G. C., Waszkewitz, J. and Crowley, T. J. 1997. Simulation of the influence of solar radiation variations on the global climate with an ocean – atmosphere circulation model. Clim. Dyn. 13, 757–767. doi:10.1007/s003820050196
- Dahlke, S. and Maturilli, M. 2017. Contribution of atmospheric advection to the amplified Winter warming in the Arctic North Atlantic region. Adv. Meteorol. 2017, 1–8.. doi:10.1155/2017/4928620
- Dawson, A. 2016. Eofs: a library for EOF analysis of meteorological, oceanographic and climate data. J. Open Res. Softw. 4(1),e14. doi:10.5334/jors.122
- Dee, D. P., Uppala, S. M., Simmons, A. J., Berrisford, P., Poli, P. and co-authors. 2011. The ERA-Interim reanalysis: configuration and performance of the data assimilation system. Q. J. R. Meteorol. Soc. 137, 553–597. doi:10.1002/qj.828
- Delworth, T. and Knutson, T. 2000. Simulation of early 20th century global warming. Science 287, 2246–2250. doi:10.1126/science.287.5461.2246
- Ding, Q., Wallace, J. M., Battisti, D. S., Steig, E. J., Ailie, J. E. and co-authors. 2014. Tropical forcing of the recent rapid Arctic warming in northeastern Canada and Greenland. Nature 509, 209–212. doi:10.1038/nature13260
- Divine, D., Isaksson, E., Martma, T., Meijer, H. A. J., Moore, J., and co-authors. 2011. Thousand years of winter surface air temperature variations in Svalbard and northern Norway reconstructed from ice-core data. Polar Res. 30, 1–12.
- Dong, B. and Dai, A. 2015. The influence of the Interdecadal Pacific Oscillation on temperature and precipitation over the globe. Clim. Dyn. 45, 2667–2681. doi:10.1007/s00382-015-2500-x
- Flatau, M. and Kim, Y. J. 2013. Interaction between the MJO and polar circulations. J. Clim. 26, 3562–3574. doi:10.1175/JCLI-D-11-00508.1
- Førland, E. J., Benestad, R., Hanssen-Bauer, I., Haugen, J. E. and Skaugen, T. E. 2011. Temperature and precipitation development at Svalbard 1900–2100. Adv. Meteorol. 2011, 1–14. doi:10.1155/2011/893790
- Garfinkel, C. I., Feldstein, S. B., Waugh, D. W., Yoo, C. and Lee, S. 2012. Observed connection between stratospheric sudden warmings and the Madden‐Julian Oscillation. Geophys. Res. Lett. 39, L18807.
- Gomara, I., Rodriguez-Fonseca, B., Zurita-Gotor, P., Ulbrich, S. and Pinto, J. G. 2016. Abrupt transitions in the NAO control of explosive North Atlantic cyclone development. Clim. Dyn. 47, 3091–3111. doi:10.1007/s00382-016-3015-9
- Hanssen-Bauer, I., Forland, E. J., Hisdal, H., Mayer, S., Sando, A. B. and co-authors. 2019. Climate in Svalbard 2100- a Knowledge Base for Climate Adaptation. NCCS report no. 1/2019.
- Henderson, S. A., Maloney, E. D. and Barnes, E. A. 2016. The influence of the Madden–Julian Oscillation on Northern Hemisphere winter blocking. J. Clim. 29, 4597–4616.. doi:10.1175/JCLI-D-15-0502.1
- Henley, B. J., Gergis, J., Karoly, D. J., Power, S., Kennedy, J. and co-authors. 2015. A Tripole Index for the Interdecadal Pacific Oscillation. Clim. Dyn. 45, 3077–3090.. doi:10.1007/s00382-015-2525-1
- Hu, C., Yang, S., Wu, Q., Li, Z., Chen, J. and co-authors. 2016. Shifting El Niño inhibits summer Arctic warming and Arctic sea-ice melting over the Canada Basin. Nat. Commun. 7, 11721–11729. doi:10.1038/ncomms11721
- Inoue, J., Hori, M. E. and Takaya, K. 2012. The role of Barents Sea Ice in the wintertime cyclone track and emergence of a warm-Arctic cold-Siberian anomaly. J. Clim. 25, 2561–2568.. doi:10.1175/JCLI-D-11-00449.1
- IPCC. 2013. Summary for policymakers. In: Climate Change 2013: The Physical Science Basis. Contribution of Working Group I to the Fifth Assessment Report of the Intergovernmental Panel on Climate Change, 1–33. (eds. T. F. Stocker, D. Qin, G.-K. Plattner, M. Tignor, S. K. Allen and co-authors) Cambridge University Press, Cambridge.
- Jaiser, R., Dethloff, K., Handorf, D., Rinke, A., Cohen, J. and co-authors. 2012. Impact of sea ice cover changes on the northern hemisphere atmospheric winter circulation. Tellus A Dyn. Meteorol. Oceangr. 64, 11595. doi:10.3402/tellusa.v64i0.11595
- Jun, S. Y., Ho, C. H., Jeong, J. H., Choi, Y.-S. and Kim, B.-M. 2016. Recent changes in winter Arctic clouds and their relationships with sea ice and atmospheric conditions. Tellus A Dyn. Meteorol. Oceangr. 68, 1–20.
- Kessler, W. S. and Kleeman, R. 2000. Rectification of the Madden–Julian Oscillation into the ENSO cycle. J. Clim. 13, 3560–3575. doi:10.1175/1520-0442(2000)013<3560:ROTMJO>2.0.CO;2
- Kucharski, F., Molteni, F. and Bracco, A. 2006. Decadal interactions between the western tropical Pacific and the North Atlantic Oscillation. Clim. Dyn. 26, 79–91.. doi:10.1007/s00382-005-0085-5
- Kumar, A., Wang, W., Hoerling, M. P., Leetmaa, A. and Ji, M. 2001. The sustained North American warming of 1997 and 1998. J. Clim. 14, 345–353.. doi:10.1175/1520-0442(2001)014<0345:TSNAWO>2.0.CO;2
- Lavers, D. A., Allan, R. P., Villarini, G., Lloyd-Hughes, B., Brayshaw, D. J. and co-authors. 2013. Future changes in atmospheric rivers and their implications for winter flooding in Britain. Environ. Res. Lett. 8, 34010. doi:10.1088/1748-9326/8/3/034010
- Lee, S., Gong, T., Johnson, N., Feldstein, S. B. and Pollard, D. 2011. On the possible link between tropical convection and the Northern Hemisphere Arctic surface air temperature change between 1958 and 2001. J. Clim. 24, 4350–4367.. doi:10.1175/2011JCLI4003.1
- Lin, H., Brunet, G. and Yu, B. 2015. Interannual variability of the Madden‐Julian Oscillation and its impact on the North Atlantic Oscillation in the boreal winter. Geophys. Res. Lett. 42, 5571–5576. doi:10.1002/2015GL064547
- López-Moreno, J. I., Boike, J., Sanchez-Lorenzo, A. and Pomeroy, J. W. 2016. Impact of climate warming on snow processes in Ny-Ålesund, a polar maritime site at Svalbard. Glob. Planet Change 146, 10–21. doi:10.1016/j.gloplacha.2016.09.006
- Luo, D., Xiao, Y., Diao, Y., Dai, A., Franzke, C. L. E., Simmonds, I. and co-authors. 2016. Impact of Ural blocking on winter warm Arctic-cold Eurasian anomalies. Part II: the link to the North Atlantic Oscillation. J. Clim. 29, 3949–3971. doi:10.1175/JCLI-D-15-0612.1
- Luo, D., Xiao, Y., Yao, Y., Dai, A., Simmonds, I. and co-authors. 2016. Impact of Ural blocking on winter warm Arctic–Cold Eurasian anomalies. Part I: blocking-induced amplification. J. Clim. 29, 3925–3947.. doi:10.1175/JCLI-D-15-0611.1
- Maslanik, J., Drobot, S., Fowler, C., Emery, W. and Barry, R. 2007. On the Arctic climate paradox and the continuing role of atmospheric circulation in affecting sea ice conditions. Geophys. Res. Lett. 34, L03711.
- Maturilli, M. and Kayser, M. 2016. Arctic warming, moisture increase and circulation changes observed in the Ny-Ålesund homogenized radiosonde record. Theor. Appl. Climatol. 130, 1–17. doi:10.1007/s00704-016-1864-0
- Moberg, A., Sonechkin, D. M., Holmgren, K., Datsenko, N. M., Karlén, W. and co-authors. 2005. Highly variable Northern Hemisphere temperatures reconstructed from low- and high-resolution proxy data. Nature 433, 613–617. doi:10.1038/nature03265
- Moritz, R. E., Bitz, C. M. and Steig, E. J. 2002. Dynamics of recent climate change in the Arctic. Science 297, 1497–1502. doi:10.1126/science.1076522
- North, G. R., Bell, T. L., Cahalan, R. F. and Moeng, F. J. 1982. Sampling errors in the estimation of empirical orthogonal functions. Mon. Wea. Rev. 110, 699–706. doi:10.1175/1520-0493(1982)110<0699:SEITEO>2.0.CO;2
- Overland, J. E. and Wang, M. 2005. The third Arctic climate pattern: 1930s and early 2000s. Geophys. Res. Lett. 32, 1–4.
- Overland, J. E. and Wang, M. 2010. Large-scale atmospheric circulation changes are associated with the recent loss of Arctic sea ice. Tellus A Dyn. Meteorol. Oceangr. 62, 1–9. doi:10.1111/j.1600-0870.2009.00421.x
- Overland, J. E., Wang, M. and Salo, S. 2008. The recent Arctic warm period. Tellus A 60, 589–597. doi:10.1111/j.1600-0870.2008.00327.x
- Polyakova, E. I., Journel, A. G., Polyakov, I. V. and Bhatt, U. S. 2006. Changing relationship between the North Atlantic Oscillation and key North Atlantic climate parameters. Geophys. Res. Lett. 33, 2–5.
- Polyakov, I. V., Bhatt, U. S., Simmons, H. L., Walsh, D. E., Walsh, J. E. and co-authors. 2005. Multidecadal variability of North Atlantic temperature and salinity during the twentieth Century. J. Clim. 18, 4562–4581. doi:10.1175/JCLI3548.1
- Schlesinger, M. E. and Ramankutty, N. 1994. An oscillation in the global climate system of period 65–70 years. Nature 367, 723–726. doi:10.1038/367723a0
- Seager, R., Harnik, N., Kushnir, Y., Robinson, W. and Miller, J. 2003. Mechanisms of hemispherically symmetric climate variability. J. Clim. 16, 2960–2978.. doi:10.1175/1520-0442(2003)016<2960:MOHSCV>2.0.CO;2
- Seo, K.-H., Lee, H.-J. and Frierson, D. M. W. 2016. Unraveling the teleconnection mechanisms that induce wintertime temperature anomalies over the Northern Hemisphere continents in response to the MJO. J. Atmos. Sci. 73, 3557–3571. doi:10.1175/JAS-D-16-0036.1
- Shindell, D. T., Schmidt, G. A., Mann, M. E., Rind, D. and Waple, A. 2001. Solar forcing of regional climate change during the Maunder minimum. Science 294, 2149–2152. doi:10.1126/science.1064363
- Takaya, K. and Nakamura, H. 2001. A formulation of a phase-independent wave-activity flux for stationary and migratory quasigeostrophic eddies on a zonally varying basic flow. J. Atmos. Sci. 58, 608–627. doi:10.1175/1520-0469(2001)058<0608:AFOAPI>2.0.CO;2
- Tang, Q., Zhang, X., Yang, X. and Francis, J. A. 2013. Cold winter extremes in northern continents linked to Arctic sea ice loss. Environ. Res. Lett. 8, 14036. doi:10.1088/1748-9326/8/1/014036
- Tingley, M. P. and Huybers, P. 2013. Recent temperature extremes at high northern latitudes unprecedented in the past 600 years. Nature 496, 201–205. doi:10.1038/nature11969
- Vihma, T., Screen, J., Tjernström, M., Newton, B., Zhang, X., and co-authors. 2016. The atmospheric role in the Arctic water cycle: a review on processes, past and future changes, and their impacts. J. Geophys. Res. Biogeosci. 121, 586–620. doi:10.1002/2015JG003132
- Vikhamar-Schuler, D., Forland, E.J., Lutz, J. and Gjelten, H.M. 2019. Evaluation of downscaled reanalysis and observations for Svalbard- Backgroud report for climate in Svalbard 2100. NCCS -report4/2019.
- Wallace, J. M. and Thompson, D. W. J. 2002. The Pacific center of action of the Northern Hemisphere Annular Mode: real or artifact? J. Clim. 15, 1987–1991. doi:10.1175/1520-0442(2002)015<1987:TPCOAO>2.0.CO;2
- Wei, T., Ding, M., Wu, B., Lu, C. and Wang, S. 2016. Variations in temperature-related extreme events (1975-2014) in Ny-Ålesund, Svalbard. Atmos. Sci. Lett. 17, 102–108. doi:10.1002/asl.632
- Yang, X. Y. and Yuan, X. 2014. The early winter sea ice variability under the recent arctic climate shift. J. Clim. 27, 5092–5110. doi:10.1175/JCLI-D-13-00536.1
- Yang, X. Y., Yuan, X. and Ting, M. 2016. Dynamical link between the Barents-Kara sea ice and the Arctic Oscillation. J. Clim. 29, 5103–5122. doi:10.1175/JCLI-D-15-0669.1
- Yoo, C., Feldstein, S. and Lee, S. 2011. The impact of the Madden‐Julian Oscillation trend on the Arctic amplification of surface air temperature during the 1979–2008 boreal winter. Geophys. Res. Lett. 38, L24804.
- Zhang, X., Sorteberg, A. and Zhang, J. 2008. Recent radical shifts of atmospheric circulations and rapid changes in Arctic climate system. Geophys. Res. Lett. 35, 1–7.