
 ?Mathematical formulae have been encoded as MathML and are displayed in this HTML version using MathJax in order to improve their display. Uncheck the box to turn MathJax off. This feature requires Javascript. Click on a formula to zoom.
Abstract
We show evidence that tropical atmospheric variability over the central tropical Pacific modulates the circulation over the western Arctic and the North Atlantic-European sector, impacting the summer precipitation especially over Nordic European countries (NEC). Our results, based on the ERA5 reanalysis, suggest the occurrence of a teleconnection mechanism (similar to the Pacific North American pattern) between the tropical Pacific in early spring and summer precipitation over NEC, and we propose two indices as predictors for NEC summer precipitation based on geopotential height anomalies at 500 hPa over the western tropical Pacific during March. We propose an empirical model based on both indices as predictors and assess the model’s skill with a leave-one-out cross-validation procedure. Over large portions of NEC, our proposed empirical model is able to reproduce dry, normal and wet years, defined from summer standardized precipitation anomalies, with a Heidke skill score greater than 0.9.
1. Introduction
In recent years, potential sources of interannual variability for summer precipitation over Europe have been identified, including the characterization of different modes of atmospheric variability that cause dry or wet summers (Saeed et al., Citation2014; O’Reilly et al., Citation2018; Wulff et al., Citation2017 ), possible influences of soil moisture anomalies (Schär et al., Citation1999; Seneviratne et al., Citation2006) and linkages to changes in sources of moisture availability due to Sea Surface Temperature (SST) anomalies (Årthun et al., Citation2017), especially at multi-annual frequencies. It has also been indicated that general circulation models could be used to simulate skilfully multi-annual periods of wet and dry summers over Europe (Dunstone et al., Citation2018; Neddermann et al., Citation2019). However, up to now, it is still a challenge to understand which processes influence the variability of summer precipitation over Europe, as well as the inherent predictability, and the skill of current seasonal prediction systems to represent and predict these processes. In this paper, we show evidence that atmospheric anomalies over the North Atlantic and Europe, causing wet and dry summers over Northern Europe, are related to the state of the subtropical atmosphere over the Pacific in early spring.
Tropical sources of interannual variability for European climate variability have been previously analysed (e.g. Hoskins and Ambrizzi, Citation1993; Palmer and Anderson, Citation1994; Van Oldenborgh et al., Citation2000; Ding et al., Citation2011; Gastineau and Frankignoul, Citation2015; Wulff et al., Citation2017; Neddermann et al., Citation2019), and some dynamical linkages have been suggested as the mechanisms connecting precipitation and Sea Surface Temperatures (SST) in the tropics and the climate variability over the North Atlantic and Europe. For example, Van Oldenborgh et al., (Citation2000) have previously found a significant correlation between tropical Pacific SST anomalies and precipitation over Europe, with increased spring precipitation in Central Europe after an El Niño and decreased precipitation after a La Niña.
A mechanism proposed to establish the connection between the tropics and high latitudes, are planetary-scale atmospheric waves, specifically Rossby waves (also identified by Branstator (2002) as circumglobal teleconnection pattern CGT), which propagate pole-eastwards (Hoskins and Karoly, Citation1981). Rossby waves impacting on the atmospheric circulation of the North Atlantic and European sector are generated by SST anomalies over the Gulf of Mexico and the Pacific (Saeed et al., Citation2014; Wulff et al., Citation2017; Neddermann et al., Citation2019).
Ding et al. (Citation2011) used maximum covariance analysis (MCA) to analyse the dominant modes between the atmospheric dynamics in the extra-tropical regions of the northern hemisphere and tropical precipitation. The CGT was found to be the dominant mode and its origin was attributed partially to the Indian summer monsoon. The second mode, called the western Pacific North America (WPNA) pattern, was reported to appear in summers following the peak of an El Niño event. Ding et al. (Citation2011) suggested that it is caused by diabatic heating anomalies over the Philippine Sea associated with the western North Pacific summer monsoon (WNPSM).
Similarly, O’Reilly et al. (Citation2018), applied MCA to analyse the dominant modes of co-variability between tropical precipitation and atmospheric circulation over Europe and the Atlantic. They found that the dominant mode shows a cyclonic anomaly over the extra-tropical North Atlantic during one of its phases, contributing to anomalously wet conditions over western Europe and dry conditions over eastern Europe and Scandinavia. They found that this mode is linked to tropical precipitation related to ENSO. In turn, O’Reilly et al. (Citation2018) found that the second MCA mode shows weaker tropical precipitation anomalies but with a stronger extra-tropical signal, compared to the first MCA mode, that reflects internal atmospheric variability. O’Reilly et al. (Citation2018) suggested that the observed link between the dominant mode of tropical precipitation and atmospheric circulation anomalies over the North Atlantic and Europe is consistent with linear Rossby wave dynamics. According to O’Reilly et al. (Citation2019) these summer Pacific-extratropics teleconnections, are associated with the ENSO amplitude, and therefore they are only present after 1979 when ENSO increased its amplitude especially after the strong El Niño event of 1982/1983. This ENSO linkage of the atmospheric variability over the North Atlantic and Europe, under the current state of the climate system which was attributed to due to warmer SST conditions that ultimately modifies the background state of the atmosphere.
The second mode of low-frequency variability during summer over the North Atlantic, called summer East Atlantic mode (SEA, Wulff et al., Citation2017), or the East Atlantic pattern (Wallace and Gutzler, Citation1981; Barnston and Livezey, Citation1987; Iglesias et al., Citation2014), has been reported as one of the most important modulators of summer climate variability. During its positive phase, the spatial pattern of this mode shows a positive pressure anomaly over the subtropical North Atlantic and a negative pressure anomaly over central Europe.
Although the spatial atmospheric patterns over Europe analysed by Wulff et al., (Citation2017) and O’Reilly et al. (Citation2018) are different (SEA and the second mode of covariance respectively), both have in common a strong linkage with the tropical precipitation over the Caribbean and the tropical eastern Pacific. Wulff et al. (Citation2017) suggested that its source is a zonal pressure gradient over the North Pacific, which in turn is modulated and/or generated by the SST anomalies over the Caribbean and in the tropical North Pacific. Wulff et al. (Citation2017) also mentioned that the tropical SSTs are leading the extra-tropical patterns by a few months. This temporal lag arises from the persistence of the SSTs in the tropical regions.
In this paper, we analyse the linkage between summer (JJA) standardized precipitation anomalies (P, anomaly divided by standard deviation) over Nordic European countries (NEC, the continental parts of Norway, Sweden, Finland, and Denmark) and global modes of variability, particularly its link to tropical and subtropical variability over the Pacific and the Caribbean. Further, we investigate the skill on reproducing interannual variability of summer precipitation over NEC of a multi-linear regression model. In Section 2, we describe the applied methodology and data used. The results and discussion are presented in Section 3 and summarized in the conclusions in Section 4.
2. Data and methods
For this study we used geopotential height at 500 hPa (z500), surface temperature (Ts), vertical pressure velocity (omega) and vertically integrated moisture divergence (VIMD) from the European Centre for Medium-range Weather Forecasts (ECMWF) ERA5 reanalysis (Copernicus Climate Change Service (C3S), 2017). The horizontal resolution of ERA5 is approximately 31 km, with 137 model levels from the surface and up to 0.01 hPa. The forecast model and assimilation system stem from cycle Cy41r2. As for the assimilation system, it is an Ensemble of Data assimilation with 4-dimensional variational approach, where the Background error covariance matrix of the 4DVar is updated for every cycle (every 12 hours) by the ensemble information. We use 40 years from 1979 to 2018.
For precipitation we used data from the E–OBS daily gridded dataset (Cornes et al., 2018), which is a European land-only, high-resolution gridded observational dataset produced using the ECA&D blended daily station data (Klein Tank, Citation2007). In this case, we use the 0.22° resolution of the dataset that covers the area within latitudes 25–75°N and longitudes 40°W–75°E. Even though the dataset is available from 1950, we used the same period as in ERA5, 1979–2018.
We used sea ice concentration from the GLORYS2V4 reanalysis, an updated version of GLORYS2V1 (Ferry et al., Citation2010), that uses the NEMOv3.1 ocean model with 0.25° horizontal resolution and 75 vertical levels refined near the surface, with 1-m to 100-m layer thickness from the surface to bottom. A bias correction scheme for temperature and salinity is also included. GLORYS2V4 includes the 1993–2015 period. GLORYS2v4 uses the sea-ice model LIM2 with Elastic-Viscous-Plastic rheology (Fichefet and Morales Maqueda, Citation1997; Bouillon et al., Citation2009).
Lagged Pearson correlations between P over a region covering portions of Northern Sweden and Finland (SwedFin, the region defined within latitudes 63°N and 68°N and longitudes 19°E and 27°E) and global monthly (from January to July) z500 data were calculated. We then identified the lag with the highest correlation values between P and z500. Two areas exhibiting high correlation were tested to be used as predictors for a multiple linear correlation model, to reproduce observed P over all NEC. To assess the skill of the model to reproduce standardized summer precipitation data that has not been used for the predictors fitting, we applied a leave-one-out cross-validation procedure (where each yearly (summer) sample is left out of the model calibration in turn and predicted once).
We used the Heidke skill score (HSS) to assess the model skill in reproducing the amplitude of the modelled anomalies. HSS is a measure of categorical hits versus misses. HSS is equal to the total number of correct forecasts minus the correct random forecasts (hits minus correct random forecasts) divided by the subtraction of the total number of forecasts minus the correct forecasts due to chance. HSS values fall within the (−1, +1) range. No incorrect forecasts give a score of +1, no correct forecasts give a score of −1. In a similar way as in Fuentes-Franco et al., (Citation2018), dividing the distribution of P into three parts with the ranges given by years with P < −0.5σ (dry), P within ±0.5σ (normal) and P > +0.5 σ (wet)a hit is considered when observations and forecasts are coincident in the same range (compared to the respective seasonal values). In other words, for precipitation forecasts, the HSS shows the relative improvement over a random forecast considering any of the three cases: dry, normal or wet.
Formally, the HSS is defined as follows:
(1)
(1)
where Hits is the total number of times within the 1979–2018 period in which the model and the observations are in the same percentile (dry, normal or wet). L is the length of the time series, in this case, 40 summer seasons are considered.
3. Results and discussion
The summer season is the wettest season of the year over the Nordic countries. Using E-Obs, we obtained that over the SwedFin region, the mean annual precipitation is 571.6 mm, and 201.2 mm during the summer season. This means that the summer precipitation accounts as 35.2% of the annual mean precipitation. Over the whole NEC, summer is the wettest season, even for some regions of Sweden (Lappland, Jämtland and Härjedalen), Finland (Laponia) and Norway (Oppland and Finnmark), summer precipitation accounts for at least 40% of the annual precipitation.
3.1. Linkage between tropical variability and summer precipitation over Northern Europe
We correlated P over the SwedFin region with monthly z500 from different single months (January until July in ), and we found that the late winter (particularly March ) z500 shows the highest correlation with P over the SwedFin region (). The region of highest positive correlation (with r > 0.7) was located over the central tropical and subtropical Pacific, west of the Hawaiian Archipelago (WH) within latitudes 18°N–27°N and longitudes 168°W–180°W (enclosed in a yellow rectangle in ). Two other regions show high correlations, one with negative correlation (r < = −0.5) located southwest of Alaska, in the area of the semi-permanent Aleutian low-pressure centre; and the second over western Canada (WCan, enclosed in yellow in ).
Fig. 1. Pearson correlation between regionally averaged summer (JJA) precipitation over SwedFin and global z500 during (a) January, (b) February, (c) March, (d) April, (e) May, (f) June, (g) July and (h) August. Precipitation data from E-Obs and z500 from ERA5.
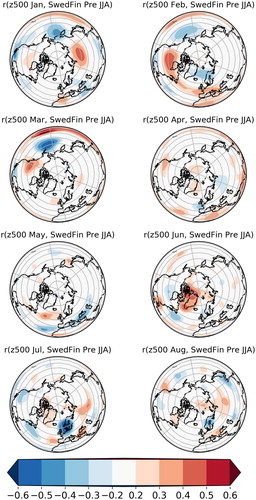
Fig. 2. (a) Pearson correlation between regionally averaged summer (JJA) precipitation over SwedFin and global z500 during March for every grid point. Regions of West of Hawaii (WH) and western Canada (WCan) that are used as predictors for summer precipitation are enclosed in yellow rectangles. (b) Standardized (removed the mean and divided by the standard deviation) time series of the PNA and of spatially averaged z500 over WH from ERA5. PNA data was downloaded from the webpage https://www.esrl.noaa.gov/psd/data/correlation/pna.data. Precipitation data from E-Obs.
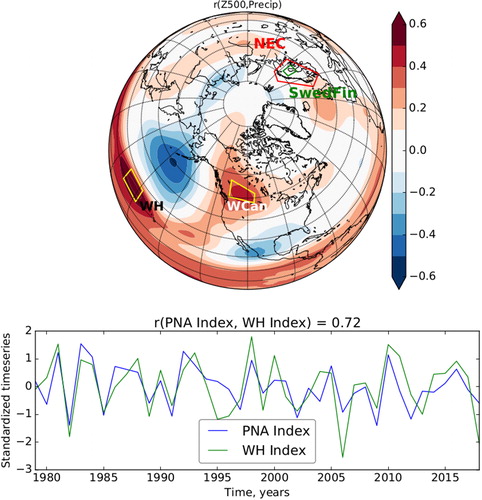
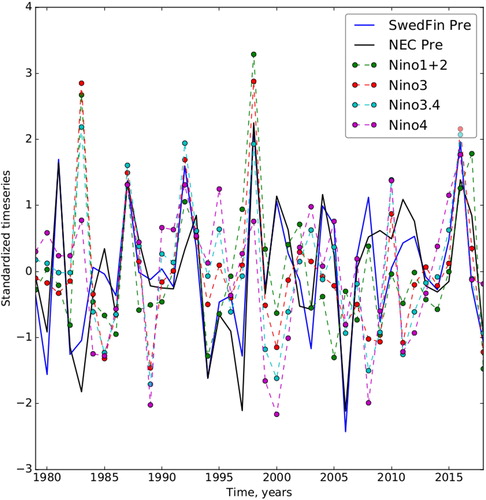
shows that the pattern of correlation resembles the positive phase of the Pacific North American (PNA) pattern during March, however, the correlation pattern shows a slight displacement towards the west compared to the PNA main points of variability. The correlation of P over both NEC and SwedFin regions and WH time series (r = 0.43, 0.63, respectively) is higher than P over NEC and SwedFin regions and PNA time series (r = 0.28, 0.60, respectively). The PNA and WH time series show high similarities () with a correlation value r = 0.72. ENSO shows a more canonical PNA-like pattern when correlating with z500 (see ), with some spatial coincidence with the correlation sign over the areas used as WH and WCan predictors. We also found that generally El Niño winters are followed by wetter than normal summer over SwedFin and NEC, but not all La Niña cases are followed by drier than normal cases (see time series of precipitation and ENSO indices in ). Despite the relatively low correlations between El Niño indices and precipitation over SwedFin, from the time series () we observe that almost all early spring El Niño events (1987, 1992, 1998 and 2016) are associated with high precipitation over NEC/SwedFin during summer. La Niña events do not necessarily show negative precipitation anomalies.
Fig. 3. Correlation between Niño3 index and geopotential height at 500 hPa. Enclosed are shown the WH and WCan regions used as z500-based predictors, which show some regions of coincidence with same sign correlation values as . NEC and SwedFin regions for summer precipitation are also shown. Niño3 index from https://psl.noaa.gov/gcos_wgsp/Timeseries/Data/nino3.long.anom.data. Z500 data from ERA5.
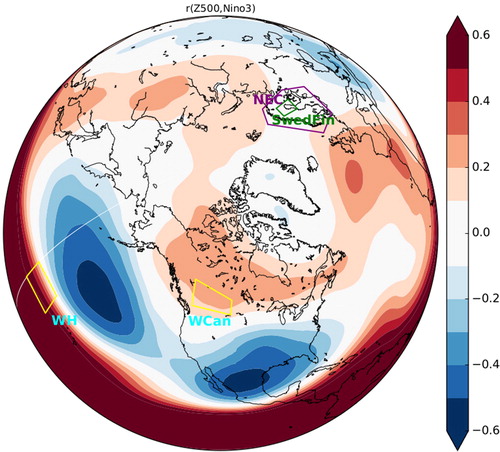
Fig. 4. Standardized time series of ENSO indices during March and summer (JJA) precipitation over NEC and SwedFin regions. The correlation coefficients between SwedFin precipitation and ENSO indices: r(SwedFin, Nino1 + 2) = 0.36, r(SwedFin, Nino3) = 0.36, r(SwedFin, Nino3.4) = 0.29, r(SwedFin, Nino4) = 0.10. Niño indices from https://psl.noaa.gov/gcos_wgsp/Timeseries/, precipitation from E-Obs.
Although we find a high negative correlation over the Aleutian low region, including this region as predictor does not improve the correlation between predicted and observed summer SwedFin precipitation. We, therefore, used only WH and WCan as predictors.
The WH and PNA z500 indices show high similarity (see ), and both summarize the same global circulation features for the early spring, which have an influence at global scale, and whose impact in the atmosphere remains until the next summer. We show this, with the correlation of z500 over WH (from now WH-z500) during March and different variables during summer. First, we correlated March WH-z500 with vertical velocity (omega, the pressure velocity with positive values downwards, in a tropical band from 13 N to 22 N) during summer (JJA) and found that WH-z500 correlates positively with omega in the western and central Pacific (longitudes 120E–160E) along the whole atmospheric column, while it correlates negatively over the eastern tropical Pacific, southern Mexico and the Caribbean Sea (longitudes 40 W–100 W, ). This would imply that positive z500 anomalies over the WH region would be related with a modified Walker circulation, with increased subsidence over the western and central tropical Pacific and increased rising motion over the eastern tropical Pacific, southern Mexico, and the Caribbean sea; opposite circulation conditions would occur during negative z500 over the WH region.
Fig. 5. Correlation between z500 during March averaged over WH with (a) omega (averaged along the tropical band between the latitudes 13 N-22 N) during summer, (b) vertically integrated moisture divergence (VIMD) during summer, (c) geopotential height at 500 hPa (z500) during summer, (d) two metre air temperature (Ts) during summer, (e) sea ice concentration during summer and (f) precipitation during summer. Correlation values abs(r) > 0.26 are statistically significant at p < 0.1. Omega, VIMD, z500 and Ts variables are from ERA5. Precipitation from E-Obs. Sea ice concentration from GLORYS2V4, and precipitation from E-Obs.
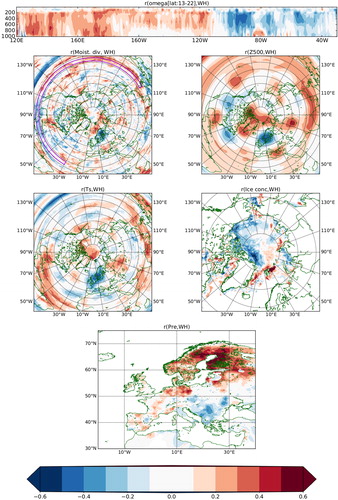
Consistently with omega, the correlation of WH-z500 with the vertically integrated moisture divergence shows a positive correlation over the western and central tropical Pacific and negative over the eastern tropical Pacific, southern Mexico and the Caribbean Sea (). A stronger rising motion over the eastern tropical Pacific, southern Mexico, and the Caribbean Sea would, in turn, be associated with increased vertically integrated moisture convergence over this region. Wulff et al (Citation2017) showed that there is a robust link between the variability in the atmosphere during summer over the East Atlantic region and convection in the tropical Pacific. Similarly, O’Reilly et al. (Citation2018) applying a maximum covariance analysis (MCA) showed that positive summer precipitation anomalies located in the central tropical Pacific, and negative anomalies over the eastern tropical Pacific and their respective associated upper-level divergence, were associated with a high z500 anomaly over Scandinavia and northern Europe. Therefore, they suggested that the relatively weak precipitation anomalies in the eastern tropical Pacific can generate Rossby wave anomalies over the jet entrance region in the North Atlantic, which then trigger the observed storm-track anomalies and associated eddy feedback onto the large-scale circulation.
show an agreement with the mechanisms described by Wulff et al. (Citation2017) and by O’Reilly et al. (Citation2018), and here we show evidence that z500 anomalies over WH in March could extend the predictability of this mechanism into the early spring.
When we analyse the correlation of March WH-z500 with global z500, two-meter temperature, sea ice concentration, and precipitation during summer (JJA) (, respectively), we find positive correlation values with z500 over the western Arctic, strongest north of the Canadian Archipielago, where also a positive correlation with temperature is found. Concurrently, we find a strong negative correlation of WH-z500 during March with z500 and temperature during summer over southern Scandinavia and northern Germany and Poland.
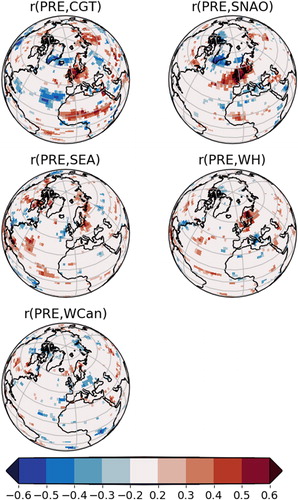
The spatial features of the atmospheric pattern linking the tropical precipitation with the North Atlantic and European (NAE) sector found by O’Reilly et al. (Citation2018), as well as the precipitation associated over Europe, exhibit the same features that we obtained using WH-z500, which suggests that their approach linking precipitation with atmospheric variability at the NAE sector, and our approach based on spring-to-summer z500 lagged impact explain the same dynamical phenomena. However, here we show that the mechanism giving predictability arises months prior to the summer, already in early spring. We compare the summer z500 and precipitation patterns over the NAE sector associated to the WH-z500 and WCan indices with the spatial patterns from other modes of variability (particularly with CGT, SNAO, and SEA), and we find that the WH-z500 index is the only one showing the higher correlation of z500 and precipitation over SwedFin and NEC regions (see and ). The WCan-z500 index shows negative correlation with mean summer z500 over the North Atlantic, covering also the NEC region, however, the correlation over NEC is weaker than that showed by WH-z500 index (). The WCan-z500 index shows a significant positive correlation with precipitation over the Norwegian Sea and SwedFin region, however over a much narrower area than the WH-z500 index ().
Fig. 6. Correlation between summer z500 and (a) CGT index, (b) SNAO, (c) SEA, (d) WH and WCan predictors based on z500 during March. All indices were calculated using ERA5 data.
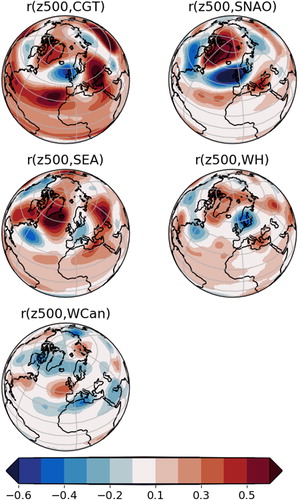
Fig. 7. Correlation between summer precipitation and (a) CGT index, (b) SNAO, (c) SEA, (d) WH and (e) WCan predictors based on z500 during March. Global precipitation from the Global Precipitation Climatology Project (GPCP) Monthly Analysis (New Version 2.3). z500 indices calculated with ERA5 data.
Although the WH-z500 index shows some similarities spatially with CGT and SNAO, more than with SEA, the correlation of the principal components between this modes of variability and WH-z500 index show low correlations with r(WH-z500, CGT) = 0.15, r(WH-z500, SNAO) = 0.23 and r(WH-z500, SEA) = 0.26. Furthermore, the different modes of variability exhibit low correlation values with P over SwedFin with r(SwedFin, CGT) = 0.32, r(SwedFin, SNAO) = 0.23 and r(SwedFin, SEA) = 0.24.
We showed that the WH-z500 index is very similar to the PNA index and that we showed that March WH-500 values tend to have a lagged relationship with global variables. Previously, L’Heureux et al. (Citation2008) have shown that the PNA has a strong impact on the western Arctic ice loss during summer, due to increased incoming solar radiation caused by the most pronounced feature of the positive polarity PNA, a strongly anticyclonic flow over the western Arctic. The correlation of WH-z500 with global summer z500 and temperature () could be interpreted so that a positive geopotential height over WH (similar positive PNA) would cause an anticyclonic circulation and higher temperature over the western Arctic. The latter would, in turn, cause a decrease in sea ice concentration, as interpreted from the strong negative correlation (r < 0.5) found between WH-z500 and ice concentration ().
Therefore, our results are not only in agreement with results from Saeed et al. (Citation2014), Wulff et al. (Citation2017) and O’Reilly et al. (Citation2018), suggesting an influence of Rossby waves generated over the eastern tropical Pacific crossing the Atlantic on the European circulation, but also with the mechanism proposed by L’Heureux et al. (Citation2008) suggesting waves (the summer PNA) travelling from the Pacific towards the NAE region across the western Arctic. Our results indicate that both mechanisms might belong to the same global dynamical mechanism forced by tropical anomalies, or if they are analysed as separated phenomena, they interact to cause a modulation of the climate variability in Nordic European countries, and that both mechanisms could be predictable with WH-z500 during March.
The correlation between WH-z500 in March and precipitation is not limited to the SwedFin region but larger areas reach values greater than r > 0.5, e.g. over wide regions of Sweden, Finland, and Northern Germany. Somewhat weaker positive correlations are found over Norway, Denmark, and Scotland (). Standardized precipitation time series over both NEC and SwedFin regions show a correlation of r(SwedFin, NEC) = 0.87, and both the smaller and wider regions appear to be dominated by the same large scale dynamics.
3.2. Empirical model for summer precipitation
We now assess the skill of March z500 over WH and WCan to reproduce P over the SwedFin and the NEC regions. We express the possible linkage of P to z500 over WH and WCan, using the following model:
Where β1 and β2 represent the sensitivity of the summer precipitation to the z500 over WH and WCan regions respectively during March. Using standardized units for precipitation and z500 time series, we find for SwedFin that β1 = 0.56 and β2 = 0.18.
When comparing how much percentage of the variance is explained by every predictor, we found that z500 anomalies over WH explain 40% of the total variance of summer precipitation, including in our model WCan the total variance explained by the model is 44%.
When we used the entire 40-year ERA5 dataset, our results revealed substantial predictability of P based on z500 conditions during March over WH and WCan for several months ahead. To assess the robustness of our results, we use a leave-one-out cross-validation method, to assess the performance of our predictors to produce out-of-sample precipitation predictions, which imply to reproduce precipitation comparable with observations outside the period used to train the model. The observations and model for the out-of-sample summer precipitation over SwedFin region estimated with our model (), show a statistically significant (p < 0.01) Pearson correlation of r = 0.6. We also perform 2-fold cross-validation, training the model with the first half of the time series and calculating the second half, and vice versa, and we get higher correlation results (not shown) compared to the leave-one-out cross-validation. NCEP/NCAR reanalysis1 and ERA-Interim were also used to reproduce the results shown with ERA5, and all the reanalysis show similar results for the period 1979–2018. In general, over the SwedFin region the WH and WCan predictors allowed to reproduce well four of the observed top 5 wettest years (1981, 1992, 1998, 2016), failing to reproduce 1987. These two predictors allow reproducing the driest years of 1982, 2006 and 2016 failing to reproduce the dry years of 1980 and 1994. In general, the empirical model shows less skill to reproduce negative anomalies. Although an underlying reason for which there is more skill in reproducing wet summer could be the ocean forcing, with generally wet years appearing after winters with strong El Niño conditions, the reasons for this non-linear response require further investigation.
Fig. 8. (a) Time series of observed (E-obs) summer precipitation over the SwedFin region and time series of forecast precipitation from the leave-one-out cross-validation. (b) β1 weights of predictor WH, (c) β2 weights of predictor WCan, (d) correlation between summer observed precipitation and modelled precipitation, (e) HSS values for the modelled precipitation. HSS as described in EquationEquation 1(1)
(1) is multiplied by 100%, (f) observed and (g) modelled precipitation anomaly in summer of 1981. (h) observed and (i) modelled precipitation anomaly in summer of 2018. The precipitation anomalies in (f)–(i) are shown in (wet, normal and dry) with standard deviations as units considering dry years when P < −0.5σ, normal when P is within ±0.5σ and wet with P > +0.5 σ.
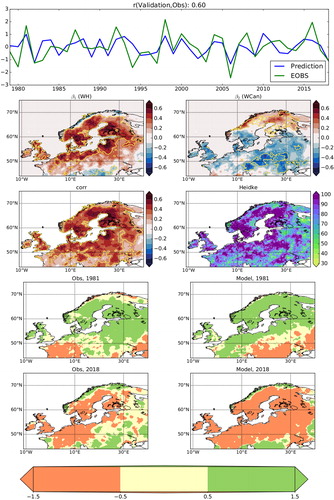
As for the SwedFin regionally averaged P, we calculate the parameters β1 and β2 for every precipitation grid-point and we find that WH has a strong influence over most of NEC, but also over the UK (). In turn, WCan shows values over northern Norway where WH does not seem to have an influence. WCan shows also some influence in northern Sweden and Finland (). When we correlate the modelled precipitation per grid-point with observed precipitation, we find that wide portions of Sweden, Finland, the Baltic countries, Poland, Germany, Denmark, the Netherlands, and the UK show values greater than r > 0.5 () while HSS > 0.9 (, multiplied by 100% in which 100% would be perfect prediction), which implies that with our empirical methodology it could be possible to infer from early spring whether the conditions for the upcoming summer would be drier, normal or wetter than normal for large portions of northern Europe. A comparison of the observed and modelled spatial precipitation anomalies divided into three ranges, wet (P > +0.5σ), normal (P within ±0.5σ) or dry (P < −0.5 σ) of a wet year (1981) and a dry year (2018) are shown in . We find that the observed wet anomalies of 1981, are well reproduced over NEC, except for overestimated precipitation over the northern part of Sweden. Also, the dry summer 2018 is well reproduced in most parts of northern, central and western Europe, but the model overestimates the extension of the dry conditions far to the east. Both examples highlight the ability of the model to reproduce summer standardized precipitation anomalies over northern Europe.
Besides showing good results against a random forecast, our methodology also shows better results than a persistence benchmark forecast, in this case, the persistence forecast is that the observed precipitation anomaly during spring will remain for the summer so that a dry/normal/wet spring over SwedFin will be followed by a dry/normal/wet summer (see ). We found that for the SwedFin region there were only 9 occasions in which dry/average/wet summers followed dry/average/wet springs (hits), which would mean an HSS of −16, meaning that the random chance forecast is better than the spring to summer persistent anomaly forecast, since the value of HSS equal to zero, would mean that the assessed forecast is as good as the random guess. shows the time precipitation series for both spring and summer seasons over the SwedFin region, which have a correlation of r = 0.
Fig. 9. Upper figure shows standardized precipitation time series over the SwedFin region for spring (MAM) and summer (JJA). Precipitation data from ERA5 and E-Obs. Lower figure shows HSS values for the spring precipitation anomalies as predictors for summer precipitation anomalies. HSS as described in EquationEquation 1(1)
(1) is multiplied by 100%.
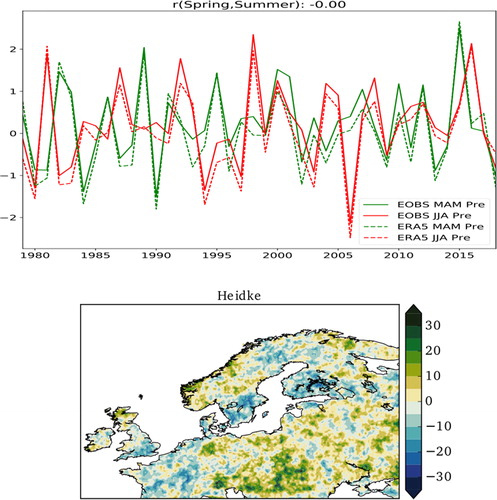
We have also calculated the HSS for all the gridpoints and we found that the highest numbers are 30 over some eastern European countries, however, over Northern Europe, it shows wide land portions of negative HSS, for example over Sweden and Finland, where the random forecast would give more chances to have a hit in the prediction of standardized summer precipitation anomalies.
4. Conclusions
Different modes of atmospheric variability like SEA, SNAO, CGT previously analysed and reported by O’Reilly et al. (Citation2018, Citation2019), Saeed et al. (Citation2014) and Wulff et al. (Citation2017), explain part of the summer atmospheric variability over the NAE region, all of them showing a different temporal and spatial behaviour when compared among each other. It has been shown that these modes of variability have a connection to tropical variability specifically to the Caribbean Sea and the Pacific, although this connection has been only present from the late 1970s until the present. In this study, we have shown that the Pacific-NAE connection is detectable from early spring and that particularly the geopotential height of the atmosphere over the subtropical central Pacific during early spring (March) seems to be related with the variability of summer precipitation over NEC, explaining 40% of its total variance. We hypothesize that higher variability in ENSO plays a role in the WH and WCan z500 indices variability, however, further research would be needed to analyse its linkage to other processes. Besides broadening the understanding of the teleconnection processes that affect the northern European climate, our findings are relevant because our method allows a simple but skilful estimate of the climate conditions several months in advance. This could allow decision-makers to make efforts to reduce environmental and socio-economic impacts through short-term adaptation and response to climate variability.
Our study could also serve as a basis to assess models for mechanisms impacting the variability of precipitation over NEC, specifically the ability of models to reproduce the observed inter-seasonal Pacific-NEC linkage across the Arctic and the North Atlantic.
Acknowledgements
All data we used for this paper is shared through the different centres (GLORYS: http://marine.copernicus.eu/services-portfolio/access-to-products/, [email protected], ERA5: https://cds.climate.copernicus.eu/cdsapp#!/dataset/reanalysis-era5-pressure-levels-monthly-means?tab=overview, EOBS: https://www.ecad.eu/download/ensembles/download.php#datafiles). We acknowledge the E-OBS dataset from the EU-FP6 project UERRA (http://www.uerra.eu) and the Copernicus Climate Change Service, and the data providers in the ECA&D project (https://www.ecad.eu).
Disclosure statement
No potential conflict of interest was reported by the authors.
Additional information
Funding
References
- Årthun, M., Eldevik, T., Viste, E., Drange, H., Furevik, T. and co-authors. 2017. Skillful prediction of northern climate provided by the ocean. Nat. Commun. 8, 15875. doi:10.1038/ncomms15875
- Barnston, A. G. and Livezey, R. E. 1987. Classification, seasonality and persistence of low-frequency atmospheric circulation patterns. Mon. Wea. Rev. 115, 1083–1126. doi:10.1175/1520-0493(1987)115<1083:CSAPOL>2.0.CO;2
- Bouillon, S., Morales Maqueda, M. A., Legat, V. and Fichefet, T. 2009. An elastic-viscous-plastic sea ice model formulated on Arakawa B and C grids. Ocean Model 27, 174–184. doi:10.1016/j.ocemod.2009.01.004
- Branstator, G. 2002. Circumglobal teleconnections, the jet stream waveguide, and the North Atlantic Oscillation. J. Clim. 15, 1893–1910. doi:10.1175/1520-0442(2002)015<1893:CTTJSW>2.0.CO;2
- Copernicus Climate Change Service (C3S). 2017. ERA5: fifth generation of ECMWF atmospheric reanalyses of the global climate. Copernicus Climate Change Service Climate Data Store (CDS), date of access. Online at: https://cds.climate.copernicus.eu/cdsapp#!/home
- Cornes, R. C., van der Schrier, G., van den Besselaar, E. J. and Jones, P. D. 2018. An ensemble version of the E‐OBS temperature and precipitation data sets. J. Geophys. Res. Atmos. 123, 9391–9409. doi:10.1029/2017JD028200
- Ding, Q., Wang, B., Wallace, J. M. and Branstator, G. 2011. Tropical–extratropical teleconnections in boreal summer: observed interannual variability. J. Clim. 24, 1878–1896. doi:10.1175/2011JCLI3621.1
- Dunstone, N., Smith, D., Scaife, A., Hermanson, L., Fereday, D. and co-authors. 2018. Skilful seasonal predictions of summer European rainfall. Geophys. Res. Lett. 45, 3246–3254. doi:10.1002/2017GL076337
- Ferry, N., Parent, L., Garric, G., Barnier, B. and Jourdain, N. C. 2010. Mercator global Eddy permitting ocean reanalysis GLORYS1V1: description and results. Mercator-Ocean Q. Newslett. 36, 15–27.
- Fichefet, T. and Morales Maqueda, M. A. 1997. Sensitivity of a global sea ice model to the treatment of ice thermodynamics and dynamics. J. Geophys. Res. 102, 609–612.
- Fuentes-Franco, R., Giorgi, F., Pavia, E. G., Graef, F. and Coppola, E. 2018. Seasonal precipitation forecast over Mexico based on a hybrid statistical–dynamical approach. Int. J. Climatol. 38, 4051–4065. doi:10.1002/joc.5550
- Gastineau, G. and Frankignoul, C. 2015. Influence of the North Atlantic SST variability on the atmospheric circulation during the twentieth century. J. Clim. 28, 1396–1416. doi:10.1175/JCLI-D-14-00424.1
- Hoskins, B. J. and Ambrizzi, T. 1993. Rossby wave propagation on a realistic longitudinally varying flow. J. Atmos. Sci. 50, 1661–1671. doi:10.1175/1520-0469(1993)050<1661:RWPOAR>2.0.CO;2
- Hoskins, B. J. and Karoly, D. J. 1981. The steady linear response of a spherical atmosphere to thermal and orographic forcing. J. Atmos. Sci. 38, 1179–1196. doi:10.1175/1520-0469(1981)038<1179:TSLROA>2.0.CO;2
- Iglesias, I., Lorenzo, M. N. and Taboada, J. J. 2014. Seasonal predictability of the east Atlantic pattern from sea surface temperatures. PLoS One 9, e86439. doi:10.1371/journal.pone.0086439
- Klein Tank, A. 2007. EUMETNET/ECSN optional programme: European Climate Assessment & Dataset (ECA&D) Algorithm Theoretical Basis Document (ATBD), version 4. Report EPJ029135.
- L’Heureux, M. L., Kumar, A., Bell, G. D., Halpert, M. S. and Higgins, R. W. 2008. Role of the Pacific‐North American (PNA) pattern in the 2007 Arctic sea ice decline. Geophys. Res. Lett. 35, L20701
- Neddermann, N. C., Müller, W. A., Dobrynin, M., Düsterhus, A. and Baehr, J. 2019. Seasonal predictability of European summer climate re-assessed. Clim. Dyn. 53, 3039–3018. doi:10.1007/s00382-019-04678-4
- O’Reilly, C. H., Woollings, T., Zanna, L. and Weisheimer, A. 2018. The impact of tropical precipitation on summertime Euro-Atlantic circulation via a circumglobal wave train. J. Clim. 31, 6481–6504. doi:10.1175/JCLI-D-17-0451.1
- O’Reilly, C. H., Woollings, T., Zanna, L. and Weisheimer, A. 2019. An interdecadal shift of the extratropical teleconnection from the tropical Pacific during boreal summer. Geophys. Res. Lett. 46, 13379–13388
- Palmer, T. N. and Anderson, D. L. T. 1994. The prospects for seasonal forecasting—a review paper. Q. J. Royal Met. Soc. 120, 755–793.
- Saeed, S., Van Lipzig, N., Müller, W. A., Saeed, F. and Zanchettin, D. 2014. Influence of the circumglobal wave-train on European summer precipitation. Clim. Dyn. 43, 503–515. doi:10.1007/s00382-013-1871-0
- Schär, C., Lüthi, D., Beyerle, U. and Heise, E. 1999. The soil‐precipitation feedback: a process study with a regional climate model. J. Clim. 12, 722–741. doi:10.1175/1520-0442(1999)012<0722:TSPFAP>2.0.CO;2
- Seneviratne, S. I., Lüthi, D., Litschi, M. and Schär, C. 2006. Land‐atmosphere coupling and climate change in Europe. Nature 443, 205–209. doi:10.1038/nature05095
- Van Oldenborgh, G. J., Burgers, G. and Tank, A. K. 2000. On the El Niño teleconnection to spring precipitation in Europe. Int. J. Climatol. 20, 565–574. doi:10.1002/(SICI)1097-0088(200004)20:5<565::AID-JOC488>3.0.CO;2-5
- Wallace, J. M. and Gutzler, D. S. 1981. Teleconnections in the geopotential height field during the Northern Hemisphere winter. Mon. Wea. Rev. 109, 784–812. doi:10.1175/1520-0493(1981)109<0784:TITGHF>2.0.CO;2
- Wulff, C. O., Greatbatch, R. J., Domeisen, D. I., Gollan, G. and Hansen, F. 2017. Tropical forcing of the Summer East Atlantic pattern. Geophys. Res. Lett. 44, 11166–11173