
 ?Mathematical formulae have been encoded as MathML and are displayed in this HTML version using MathJax in order to improve their display. Uncheck the box to turn MathJax off. This feature requires Javascript. Click on a formula to zoom.
Abstract
The autocorrelation function (ACF) and its relationship to fluctuation analysis (FA) are discussed, based on the reanalysis monthly mean geopotential height at 500 hPa from ECMWF (ERA-20C). ACF provides a measure of the influence of correlation at different time points. The principal pattern ACF shows relatively large positive correlations between every consecutive years in the central Asian continent and the North African continent. However, the confidence intervals of the ACF distributions are generally too wide, and so of low confidence level. It is found that the scaling rule of the ACF breaks down typically, while the distributions of the critical exponent of FA always show patterns. It is also found that the larger values of critical exponent appear in the tropical region, which reflects a larger climate persistence. The critical exponent becomes smaller in the jet stream regions, indicating less year to year reappearance. The characteristic time accounts for the weighted summation of all possible ACFs, which represents a memory length of a certain climate events. In the boreal winter, some robust patterns can be identified by the corresponding distribution of the characteristic time, which provides a unified way of describing the persistence of climate. An approximate relation between the critical exponent of FA and the characteristic time has been found, and such relation is verified by the distributions of these two physical variables.
1. Introduction
Atmospheric variables exhibit a wide range of correlations in various spatial and temporal scales. The autocorrelation function (ACF), denoted as provides a measurement of the correlation of a signal with a delayed copy of itself between any two temporal points τ apart. Autocorrelation analysis is a mathematical tool for finding repeating patterns, such as the presence of a periodic signal obscured by noise, with strong positive values of ACF indicating a persistent pattern. However, ACF has seldom been applied to climate studies to address the correlation between different temporal periods. Does the climate system contain the character of persistence?, i.e. the weather events in neighbouring years have a certain degree of similarity to each other? If the persistence is true, can we use ACF to describe it adequately? Also, since ACF is essentially equivalent to a correlation function, how do we judge the reliability of the result based on the confidence interval?
Scaling is a very general physical method used to stretch or shrink an object in a spatial or temporal domain with a scale factor. The scaling rules of ACF and its related fluctuation analysis (FA) function are widely used to describe the mean time correlations of a time series. Generally, ACF and FA are found to obey the scaling power-law (Tsonis et al., Citation1999; Talkner and Weber, Citation2000; Weber and Talkner, Citation2001; Monetti et al., Citation2003; Lin et al., Citation2007; Vyushin and Kushner, Citation2009; Rypdal et al., Citation2013; Yuan et al., Citation2015; Zhao and He, Citation2015; He et al., Citation2016). However, most of the previous studies on discussing scaling rule focus on the surface temperature for short-time scale of hourly or daily data, and the performances of ACF and FA based on the longer time scale of monthly mean data for geopotential height have seldom been paid attention. The index of FA scaling (called Hurst index (1951)) contains three main domains, corresponding to correlated, white noise, and anti-correlated results of a time series. It is unknown to us what is the behaviour of the climate system based on the criterion of the Hurst index. Under what circumstance, will the climate system present the correlated or random state? Can the anti-correlated situation occur in the climate system?
The accumulation of ACF is intrinsically the characteristic time (Trenberth, Citation1984), which reveals climate memory at different time scales. Since both the characteristic time and FA are established on the accumulation of ACF, there must exist a relationship between the characteristic time and the scaling of FA. These are two different approaches to describing the persistent climate phenomenon.
To discuss the above questions by illustrating the temporal correlation in climate and its association with climate persistence and memory is the purpose of this work. Different from most previous studies on the application of ACF and FA to the atmosphere in that the studies were primarily local in nature and of short time scales. In this study, ACF and FA will analyse correlations of the geopotential height at the global scale for longer time scales. The 111-year monthly mean ERA-20C were used (Poli et al., Citation2016), and such data length is similar to that of the empirical orthogonal functions (EOF) method, which is widely used in the study of climate patterns.
The outline of the article is as follows: Section 2 presents correlations in climatic time series based on ECMWF monthly mean data (ERA-20C); Section 3 discusses the underlying physics of the scaling for ACF and FA; in Section 4, the distributions of the characteristic time are shown as the memory length of the climate and the relationship between the characteristic time and FA function are addressed; and finally, in Section 5, we summarize major results and draw conclusion.
2. Climate event correlation calculations
Considering a time series of where
denotes the discretized time, its normalized variability is defined as
(1)
(1)
where σ is the standard deviation of
is the time average of the series. ACF at each spatial point over interval τ is defined by
(2)
(2)
The detrended ECMWF monthly mean 500 hPa geopotential height data (ERA-20C) is used for 111 years from 1900 to 2010 and a horizontal resolution of 1° latitude by 1° longitude (Poli et al., Citation2016). The annual cycle is removed as well. The ACF’s provides a measurement of the correlation between signals at any two different temporal points separated by interval τ and so is able to indicate repeating patterns, such as the presence of periodic signals obscured by noise. Values of
near positive/negative unity represent a tendency nearly perfect in correlated/anti-correlated patterns. Monahan (Citation2012) has used this method to demonstrated the geographical distributions of ACF for surface wind speed.
In the top panel of , the geographical distributions of in the boreal winter are shown for several values of
years. In each plot, there are several apparent contour patterns in the Pacific and Atlantic oceans and also over the Asian continent. These patterns represent the chance of persistence of climate events between two temporal points. Note that the patterns of
are not equivalent to climate patterns as these are defined as climate events that happen in different locations in the atmosphere at the same time, where
represents the persistence of climate events with a certain temporal interval of τ.
Fig. 1. The top and third panels are the northern hemispheric distributions above 20°N of the values of ACF for boreal winter and summer. The second and fourth panels are the corresponding results for the confidence interval. Based on ECMWF monthly mean data of ERA-20C (1900–2010).
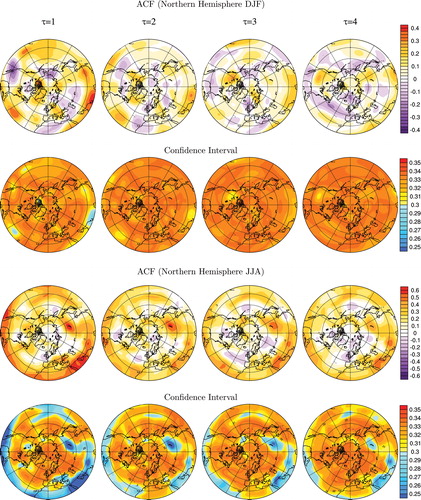
When τ = 1 year, represents the time average of the correlations between every two consecutive winter seasons and so displays climate events which have a relatively large chance to reoccur in two consecutive boreal winters. For example, there is a specific structure shown in the North Atlantic, the contour values are positive in its upper part and close to zero in its lower part, indicating positive and weak correlations, respectively, in every two consecutive winters.
The distributions also show the existence of a wave pattern in the Pacific and North America, similar to the Pacific/North American teleconnection pattern (PNA), the lower latitude of the eastern Pacific in the vicinity of Hawaii (25°N, 145°W), across to the higher latitude of western America continent (50°N, 120°W) and back to the lower latitude of the eastern American continent (38°N, 80°W). Although the values of
in these three regions are positive, they are small, which means that the chance for this kind persistent structure in two consecutive winters exists, but the probability is low.
is the principal distribution with a higher chance of occurring compared to the other distributions of
Any relatively larger positive contour shown in
indicates a bigger chance of unchanged from year to year; any relatively larger negative contour indicates a less year to year reappearance.
The geographical distribution of represents the chance of the reappear climate events in winters separated by 2 years. In the North Atlantic, the structure is similar to the result of
as the contour values are positive in its upper part (around 58°N) and close to zero in its lower part (around 45°N), indicating the sign does not systematically change for every second winter. Also the PNA type structure of
is similar to that of
In the upper North Atlantic, there is a double-centre structure with values of positive and close zero. One centre has a larger year to year persistence than another. other. In some areas, the contour is positive in
but turns to negative in
However, for regions with a substantial positive value in
the chance to turn to negative in
is small. For example, the North African continent always keeps the positive value for both
The geographical distribution of represents the chance of reappear climate events in every two winters with a temporal gap of 3 years. The noticed difference is that the double-centre structure disappears in the North Atlantic compared with
and
indicating that the persistence of
in the upper North Atlantic is weak between two winters separated by 3 years. The wave pattern structure in the Pacific and North America shown in
is different from that of
The sign in the lower latitude of the eastern Pacific turns negative, and so the type of structure in every third winter could be different. The phase and amplitude of each type of structure could be different for different winter seasons.
In the distribution of the most characteristic pattern is that the value of ACF becomes negative in the upper and lower North Atlantic (centred at 42°N, 45°W and 71°N, 0°W), implying values of
in the upper North Atlantic changes sign every 4 years, which is consistent with observations. Hurrell and Loon (Citation1997) showed that there are about 30 NAO happened in about 120 years from 1865 to 1995, thus the averaged period of NAO is approximately about 4 years. This is also confirmed by Stephenson et al. (Citation2000).
It is worth to emphasize that the first few dominate the temporal correlation since the chance of occurrence is larger than the other
with a larger τ.
in the boreal winter presents very different patterns at different values of τ, indicating that there is no trend in change of
for an increase of τ, which indicates a breaking of scaling rule in the boreal winter (see next section).
The confidence interval can be applied to ACF if we treat the values of the ACF as correlation coefficients (see Appendix). Note that the wider the confidence interval, the lower the likelihood of reaching the selected confidence level.
Row 2 of shows the confidence interval for a confidence level of 0.9 based on the method shown in Appendix. Most derived values of the confidence interval are around 0.32. The large confidence interval means that the results of ACF could fluctuate considerably around the mean results shown in the first row. The reasons for the large confidence interval and lower confidence level are due to the low value ACF in the boreal winter and the short data length. For the same ACF, this confidence interval could be much smaller if the data length was much longer (e.g. ∼500 years).
The third row of shows similar results of the ACF for the boreal summer. Unlike the boreal winter, in the boreal summer show a similar patterns for different τ. For example,
in the western part of North America shows a very similar distribution pattern for all the different τ, and the contour value decreases with an increase of τ, which, to some extent, is indicative of the phenomenon of scaling as the value gradually decrease with increase of τ.
The fourth row of presents the results of the confidence interval for the corresponding ACF in the boreal summer. Because of the larger values of ACF, the confidence intervals become narrower compared to the results of the boreal winter, and so have a higher confidence level.
3. Scaling of ACF and FA
Scaling is a common phenomenon seen in nature and indicates the invariance to stretching or shrinking on an object in a spatial or temporal domain using a scale factor. For a function f(x), if the argument x multiplied by a constant factor λ causes only a proportionate change of the function itself, i.e. then f(x) has a character of scaling and the α is called the critical exponent. What kind of scaling rule exists for the ACF is an interesting question. Even in theoretical physics there lacks a rigorous proof for the power-law of ACF (Granger, Citation1980; Koyama and Hara, Citation1992). In atmospheric science, it was claimed that autocorrelation can follow power-law decay (called long-range correlation), and we examine this aspect here.
If ACF follows a power-law decay then
(3)
(3)
and then the scaling rule would exist
(4)
(4)
generally, α cannot be negative, as that would indicate correlation increasing with τ.
In the atmosphere, the power-law scaling of ACF has been examined (Koscielny-Bunde et al., Citation1996; Talkner and Weber, Citation2000; Eichner et al., Citation2003), using calculations generally based on surface temperature data in a localized region with a very fine time step of a day or shorter. Here, we are more interested in longer time scales over a large geographical domain. Different from ACF, which measures an averaged correlation between two temporal points, the scaling of (3) measures the trend of change to such a correlation. Therefore, power-law scaling represents climate persistence, and describes a long-term record of climate by examining the probability of repeating a climate state. In (3), the smaller the α, the less degree of decay, and as there is no change in
thus indicating a maximum probability of climate persistence.
However, it is shown in detail in the Appendix that the scaling rule of (3) is generally not true for geopotential height in both cases of monthly mean and daily mean, even though the daily mean data is a very long time series of 13,880 days. The results in Section 2 of help us to understand that the scaling law of ACF is generally not true since in most regions of the boreal winter, the interannual fluctuation is too strong, and the similarity in
becomes very small or does not exist for different τ and so the scaling rule of (3) does not hold. The scaling rule is more likely to show in the boreal summer, as
for different τ shows similar patterns and the similarity decreases with an increasing τ (e.g. in the fast-east Siberian region), which demonstrates the possible existence of a scaling rule. Because it is difficult to evaluate the critical exponent, α, of ACF, as shown above and the further discussion of , the critical exponent of FA is commonly used (Talkner and Weber, Citation2000; Diego Rybski et al., Citation2008). If FA satisfies
(5)
(5)
where H is the critical exponent of FA, called Hurst index, then the scaling is satisfied as
It has been shown (Hurst Citation1951)
(6)
(6)
It is shown in the Appendix that even though the scaling rule of ACF does not exist the scaling rule of FA is generally true, and the values of H falls into the range of Unlike the ACF, which shows the correlation between two states with time lag τ, the n in FA is the accumulated time length from the beginning to the moment of n. Thus, the fluctuation of C(k) is mostly cancelled out in the accumulated process, and FA can follow a scaling rule. In the Appendix, (A2) shows that a larger value of H corresponds to a larger value of accumulated ACF in a temporal interval, which means a stronger correlation between any of two temporal points inside the range of from τ = 1 to
Therefore, the larger H represents a larger chance of persistence.
The upper left plot of shows the global averaged of FA, in the natural logarithm coordinate of and
The scaling is well presented in the linear relationship between the
and
coordinates. In the same plot, the 3-month mean results of DJF (December–February) and JJA (June–August) are also shown. For the global average, the slopes of the annual mean and JJA are larger than the slope of DJF. Thus, the climate persistence is weaker in the DJF season.
Fig. 2. FA calculated susing the 500 hPa geopotential height for global, tropical, and north/south hemisphere means. Three time series are considered for annual, DJF, and JJA means. Based on ECMWF monthly mean data of ERA-20C (1900–2010). τ is in unit of year. The black lines are the results of H = 0.5.
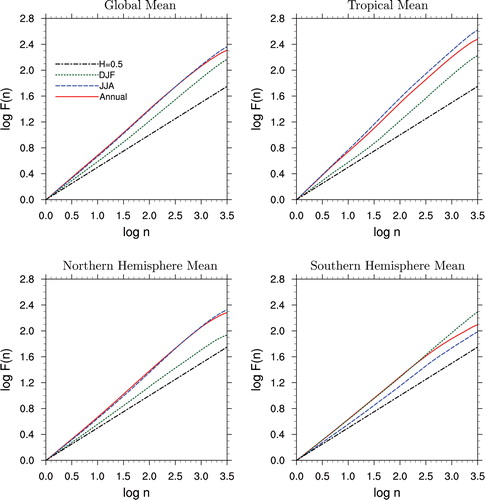
The upper right plot of shows the corresponding results in the tropical region (23°S–23°N). The tropical interannual variability is small when compared with the extra-tropics. The difference between any consequent years is relatively small, therefore the values of the slope (H) are larger than those of the global average. This result is consistent with the traditional view of weak climate variability in the tropical regions (see ). Therefore, the chance of climate persistence is large. Also, it is clearly shown that the slope of DJF is smaller than the slopes of the annual mean and JJA. Even in the tropical region, the chance of climate persistence is relatively lower for the DJF season.
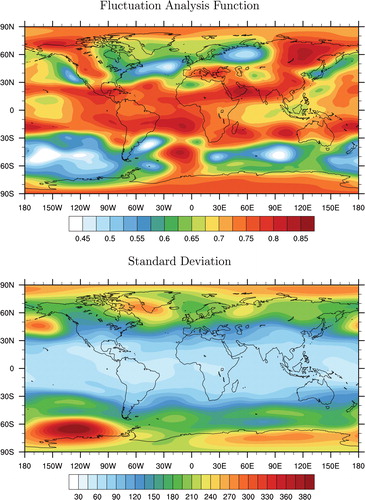
Fig. 3. Top panel, the annual mean distribution of the critical exponents H of FA using the 500 hPa geopotential heights; bottom panel, the distribution of the standard deviation.
The lower plots of show the corresponding results in both Northern Hemisphere ( N) and Southern Hemisphere (
S). In Northern Hemisphere, H is only 0.57 for the DJF mean, which is smaller than the that of annual mean and JJA mean. Thus, the climate persistence is low in the DJF Northern Hemisphere (boreal) winter. The quasi-stationary planetary waves have greater forcing in the Northern Hemisphere winter (Frankignoul Citation1985), which causes the large interannual variations there. The corresponding H of JJA is 0.69, considerably larger than that of DJF, as the boreal summer has a larger chance of the climate persistence. For the Southern Hemisphere. The curve of JJA shows a lower slope compared with those of the other two curves. The Hemispheric variations are similar but the slope of austral winter is obviously smaller than that of the austral summer, which indicates that the austral winter has a larger year to year persistence.
The results scaling of FA present the persistence in climate for consequent years. To further test the sampling variability of the climate persistence, we use a permutation method where data for different calendar years is shuffled to create a time series with no systematic autocorrelation between years and the results are shown in Appendix. It is found that the values of H in all cases are very close 0.5, which means that the results are in the white noise range and the climate persistence is lost. The surrogate data results, in turn, prove there does exist the persistence in climate.
In the upper panel of , we show the detailed geographical distributions of the critical exponents of H. A linear regression method is used to obtain the value of H using the linear relation of similar to that shown in . The range of n = 10 year is used for data in the regression, because the curves of H become not very straight for a large value of n as shown in . As
is an accumulated result, it presents the variation in the period from the beginning to time n, and so that the averaging process makes the result much more stable compared to that of ACF. The larger the value of H, the larger the similarity in physical states.
It is shown in , most areas over world have H > 0.5 (only 3% points of ), and over 84% points have the values of H > 0.6. In the tropical Pacific ENSO region, the value of H is larger in Nino 3 region compared to that of Nino 3.4 region. Bradley and Power (Citation2014) shows that the mean annual cycles of Nino index is higher in Nino 3.4 region compared to Nino 3 region. Note, the variance in geopotential is not fully driven by sea surface temperature.
Also, the critical exponent becomes smaller in the higher latitude regions. The smallest values mostly appear in the Southern Hemisphere polar jet stream regions, where values of H are smaller than 0.5. It is found that the values of H are never less than 0.4; therefore, the uncorrelated regions are only in white noise status. Also, the maximum value of H is about 0.85, no single region of as the climate system does not fall into pink noise range.
Northern Hemisphere latitudes N have the values of H, which are very small over large domains. This is related to the less climate persistence there, and will be further discussed when analysing results in . It is interesting to find that values of H are relatively large in the western part of the North American continent, but relatively small in the eastern part. The year to year persistence in the upper western region of North America are higher than the upper eastern region. In the Eurasian Continent, the situation is reversed, the larger/smaller values of H appear in the upper eastern/western parts, as the interannual persistence is high in the Russian Far East but low in Europe. In the northern Atlantic around 45°, the values of H are also minimal due to the variation of the NAO. Along the continent coasts, like the regions of Kuroshio and Gulf stream, the values of H are very small as well, as we expect these regions have lower interannual persistence.
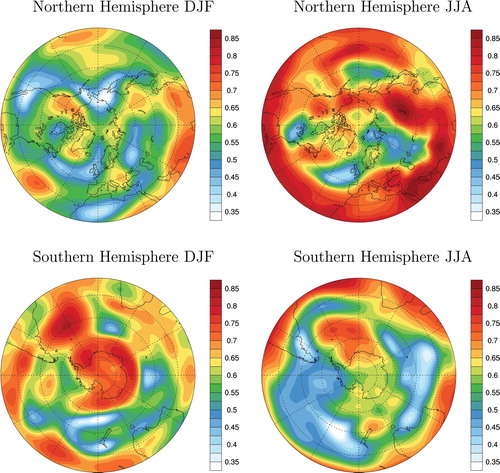
Fig. 4. Upper left and right plots are the northern hemispheric distributions above 20°N of H for the boreal winter and summer. Lower left and right plots are the southern hemispheric distributions below 20°S of H for the austral winter and summer.
In the Appendix, we have analysed the reliability for the length of ERA-20C by doing a series of tests. It is found that the result of is very robust if we use the data of the last 100 years from 1911 to 2010. However, if the data is too short, like using the data of the last 40 years, the results become very different.
The lower panel of shows the result of standard deviation based on the same annual mean data. It is found that the distribution of standard deviation, to some extent, has similarity to that of H. Especially in tropical region of larger H corresponds to a smaller standard deviation. A higher persistence means a higher climate reappearance in neighbouring years; thus, the deviation from the averaged result could be small. However, the persistence and variability are different. A signal can have a high variance and either a high or low persistence. The climate variability emphasizes the deviation to the multi-year climate mean, while climate persistence emphasizes the relationships in climate between neighbouring years. It is shown in that there exist noticeable differences between the two distributions, mostly occurring in the extratropics.
shows the regional and seasonal distributions of H. In the boreal winter, many regions show clear patterns: the characteristic feature of a H, close to 0.5 is shown near the regions of Bering sea, eastern Siberian sea, and Alaska. which can serve as a big perturbation source for climate; the western coast of North America and central Asia also show the small values of H, and the interannual persistence in these regions are small.
The most interesting feature is the double-centre structure shown in the North Atlantic, as the large and small values of H appear in the upper North Atlantic (centred at 60°N, 44°W) and lower North Atlantic (centred at 45°N, 45°W). The climate is relatively stable/unstable in these two regions, and this pattern is similar to NAO. The relatively higher values of H appear in the central Pacific in the vicinity of Hawaii. In the western America continent, relatively large values of H appear the higher latitudes, but small values of H appear in the lower latitudes. In the boreal summer, the values of H in most areas become much larger than those of boreal winter, showing a larger chance of climate persistence. Also, there is a double-centre structure shown in the North Atlantic similar to the boreal winter, but the two-centre structure is tilted to the west.
In the DJF Southern Hemisphere, the austral summer has the values of H that are relatively large in the south polar region and the south Indian ocean, with values up to 0.8. Therefore, a persistent climate should commonly occur there. In the austral winter, similar to the boreal winter, the values of H are small in general except in the south Indian ocean.
4. Memory of climate
By summing the the accumulated ACF is obtained in order to account for the entire correlation between different τ years. Trenberth (Citation1984) has proposed a concept of characteristic time, which is the summation of ACF.
(7)
(7)
where Ne is the effective length of the time series, and
is the maximum value of τ. For a finite time series with length N, the effective length is
The Ne is the available length of data in the calculation of
In (Equation7
(7)
(7) ), the factor 2 arises from the self-correlation as τ = 0, and the factor
is the ratio of the number of samples used to calculate the correlation function to the effective number of sample points.
The characteristic time represents the temporal length of memory; a region of larger/smaller Tc has higher/lower interannual persistence and so a longer/shorter climate memory. The characteristic time defined by (7) has seldom been applied to climate pattern studies using the longer time range of monthly data.
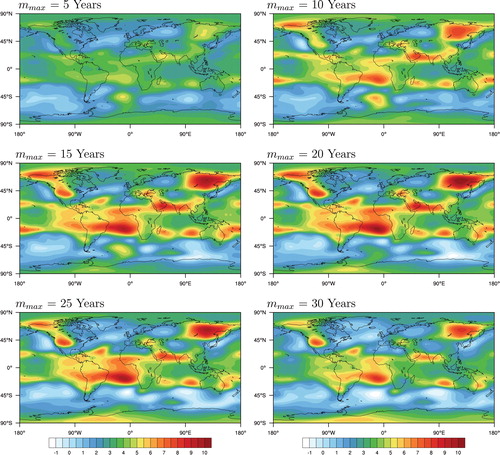
shows the annual mean global distribution of the characteristic time. To understand the reliability of Tc, we choose the value of to be 5, 10, 15, 20, 25, and 30 years with N = 111 years. For these different
the values of Tc are also different though the patterns of Tc are similar, and
year has the largest local values of Tc. The temporal length of memory reaches the maximum when the accumulated
from the near
years. In other words, the climate memorized information is mostly from the past
years. Using the ECHAM5, it is found that for surface temperature the random walk length on land of 24 years and over the ocean of 20 years (Bye et al. Citation2011). Therefore, probably the time length of 20–30 years is necessary to catch the most important climate variability.
Fig. 5. Global distributions of the characteristic time for the six mmax values (5, 10, 15, 20, 25, and 30 years). Based on ECMWF monthly mean data of ERA-20C (1900–2010).
Based on the dominant second term of (EquationA2(A2)
(A2) ), (Equation7
(7)
(7) ) can be written as
(8)
(8)
Thus, we have derived an approximate relation between Tc and the critical exponent H.
Since Tc is an accumulated ACF, for a smaller value of years, the value of Tc does not reach its maximum. Though the values of Tc change for different values of
the patterns of Tc are similar.
The distributions of Tc shown in are very similar to that of the critical exponent H (), as a region of larger H generally corresponds to a larger Tc, which supports the relationship of (8). This can be understood since a large H indicates a stronger scaling in the FA function as the persistence is larger, and also the temporal length of memory is longer.
To comprehend the seasonal patterns, the geographical distribution of Tc for the boreal winter is shown in the upper left plot of . We choose years
In the North Atlantic high latitudes (around 50°N), the value of Tc is relatively small while larger in the lower latitudes. This suggests an NAO pattern which is also seen in the FA analysis. There is also a PNA-type pattern in the eastern Pacific and northern America regions. There is also a persistent Tc pattern near the Mediterranean and northern Sahara desert regions. This latter region always exhibits high geopotential, where the atmosphere tends to suppress the large-scale ascending air. There is also another pronounced pattern in northeastern Asia, with some regions having Tc very close to zero, implying that the climate has no memory there.
Fig. 6. Upper left plot shows the distributions above 20°N of the characteristic time in the DJF Northern Hemisphere above 20°N; the upper right panel is the same but for JJA northern hemisphere. mmax = 25 years. The lower panel shows the results for Southern Hemisphere.
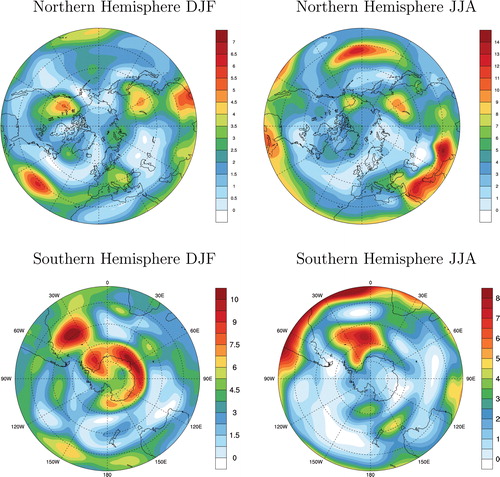
The upper right plot of shows the geographical distribution of Tc for the boreal summer. Again, the distribution of Tc is very similar to that of H shown in ; however, the magnitude of the variation in Tc is much larger than that of H, which is due to the exponential relation shown in (Equation8(8)
(8) ). An interesting feature is that the climate memory is long in the western part of North America and short in the eastern part. The two lower plots of show the geographical distributions of Tc for the austral summer and winter.
In summary, the distribution of the characteristic time as the accumulated ACF provides a unified way to describe climate variance, with several possible climate patterns being shown together. The characteristic time and FA are two complementary approaches that can be used to describe the persistent climate events.
5. Conclusion
ACF, FA functions, and the characteristic time have been discussed for their applications to climate system. Different from most previous studies of the application of the ACF and FA function which focus on short-time scales based on hourly or daily data, the longer timescale, based on seasonal and annual mean, is addressed in this study to explore climate persistence and memory based on the ERA-20C seasonal and annual mean data, which was widely used in study of climate patterns. The following conclusions can be drawn from this study:
The pattern of
represents the persistence climate events, τ years apart. The principal pattern
The scaling feature of ACF based on geopotential height, is not found for both of the monthly mean and daily mean data, as shown in . In contrast, the scaling rule of FA is true in both the spatial average and its geographical distribution. The distributions of the critical exponent of H always show regular patterns and the larger values of H appear in the tropical region, which reflects a larger climate persistence. The critical exponent becomes smaller in the jet stream regions, indicating less climate persistence. The climate persistence emphasizes the relationships in climate between neighbouring years, which is different from the climate variability by addressing the deviation to the multi-year climate mean.
The length of ERA-20C is a concern for this study since all calculations are based on seasonal or annual mean, which makes the length of data short. As it is emphasized that the broader confident interval of ACF is mostly caused by the short length of the data. For FA calculation, the 111-year seasonal or annual mean data seems enough, but further tests are needed by using more extended data.
The characteristic time shows the temporal memory of climate. The distribution of index H is very similar to that of the characteristic time, and the relationship between them is explored in this study. The FA function and characteristic time are two different approaches towards a representation of persistent patterns of climate. In the boreal winter, some highly recognized patterns, like the NAO, can be identified by a corresponding distribution of the accumulated ACF. However, the characteristic time provides a unified way to describe climate events.
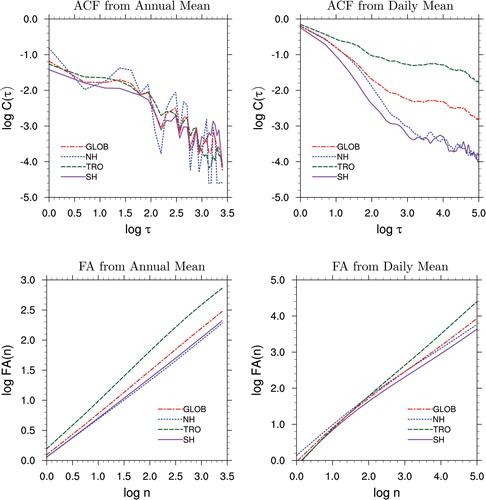
Fig. 7. The top left panel shows the results of ACF for global mean (red), tropical mean (green), northern hemispheric mean (blue) and southern hemispheric mean (purple) of monthly mean geopotential height at 500 hPa from January 1900 to December 2010, τ is in the unit of the year; the top left is the results of daily mean geopotential height at 500 hPa from 1 January 1979 to 31 December 2016, τ is in the unit of the day. The bottom panels show the corresponding results of FA.
Acknowledgement
The authors would like to thank Petr Chylek, Carsten Frederiksen, Steve Lambert, Grey Roff, Kristoffer Rypdal, and two anonymous reviewers for their helpful comments.
Disclosure statement
No potential conflict of interest was reported by the authors.
References
- Bonett, D. and Wright, T. A. 2000. Sample size requirements for estimating Pearson, Kendall and Spearman correlatios. Psychometrika 65, 23–28. doi:10.1007/BF02294183
- Bradley, F. M. and Power, S. B. 2014. The varied impacts of El Nino? Southern oscillation on Pacific Island climates. J. Clim. 27, 4015–4036. doi:10.1175/JCLI–D–13–00130.1.
- Bye, J., Fraedrich, K., Kirk, E., Schubert, S. and Zhu, X. 2011. Random walk lengths of about 30 years in global climate. J. Geophys. Lett. 38. doi:10.1029/2010GL046333.
- Courant, R. and Robbins, H. 1996. The sum of the first n squares. In: What is Mathematics?: an Elementary Approach to Ideas and Methods. Oxford: Oxford University Press, pp. 14–15.
- Diego Rybski, D., Bunde, A. and von Storch, H. 2008. Long-term memory in 1000-year simulated temperature records. J. Geophys. Res. 113. doi:10.10292007JD008568.
- Eichner, J. F., Koscielny-Bunde, E., Bunde, A., Havlin, S. and Schellnhuber, H.-J. 2003. Power-law persistence and trends in the atmosphere: a detailed study of long temperature records. Phys Rev E Stat Nonlin Soft Matter Phys. 68, 046133. doi:10.1103/PhysRevE.68.046133
- Frankignoul, C. 1985. Sea surface temperature anomalies, planetary waves, and air-sea feedback in the middle latitudes. Rev. Geophys. 23, 357–390. doi:10.1029/RG023i004p00357
- Granger, C. W. J. 1980. Long-memory relationships and the aggregation of dynamic models. J. Econom. 14, 227–238. doi:10.1016/0304-4076(80)90092-5
- He, W., Zhao, S., Liu, Q., Jiang, Y. and Deng, B. 2016. Long-range correlation in the drought and flood index from 1470 to 2000 in eastern China. Int. J. Climatol. 36, 1676–1685. doi:10.1002/joc.4450
- Hurrell, J. W. and Loon, H. V. 1997. Decadal variations in climate associated with the north Atlantic oscillation. Clim Change 36, 301–326. doi:10.1023/A:1005314315270
- Hurst, H. E. 1951. Long-term storage capacity of reservoirs. Am Soc Civil Eng. 116, 770–799.
- Koscielny-Bunde, E., Bunde, A., Havlin, S. and Goldreich, Y. 1996. Analysis of daily temperature fluctuations. Physica 231, 393–396. doi:10.1016/0378-4371(96)00187-2
- Koyama, J. and Hara, H. 1992. Scaled Langevin equation to describe the 1/fα spectrum. Phys. Rev, A. 46, 1844–1267. doi:10.1103/PhysRevA.46.1844
- Lin, G., Chena, X. and Fu, Z. 2007. Temporal/spatial diversities of long-range correlation for relative humidity over China. Phys. A. 383,
- Monahan, A. H. 2012. Temporal autocorrelation structure of sea surface winds. J. Clim. 25, 6684–6700. doi:10.1175/JCLI-D-11-00698.1
- Monetti, R. A., Havlin, S. and Bunde, A. 2003. Long-term persistence in the sea surface temperature fluctuations. Phys. A. 320, 581–589. doi:10.1016/S0378-4371(02)01662-X
- Poli, P., Hersbach, H., Dee, D. P., Berrisford, P., Simmons, A. J. and co-authors. 2016. ERA-20C: an atmospheric reanalysis of the twentieth century. J. Clim. 29, 4083–4097. doi:10.1175/JCLI-D-15-0556.1
- Rypdal, K., Vand, L. and Rypdal, M. 2013. Long-range memory in Earth’s surface temperature on time scales from months to centuries. J. Geophys. Res. 118. doi:10.1002/jgrd.50399.
- Schweder, T. and Hjort, N. L. 2016. Confidence, Likelihood, Probability: Statistical Inference with Confidence Distributions. Cambridge: Cambridge University Press, pp 499.
- Stephenson, D. B., Pavan, V. and Bojariu, R. 2000. Is the North Atlantic Oscillation a random walk? Int. J. Climatol. 20, 1–18. doi:10.1002/(SICI)1097-0088(200001)20:1<1::AID-JOC456>3.0.CO;2-P
- Talkner, P. and Weber, R. O. 2000. Power spectrum and detrended fluctuation analysis: application to daily temperatures. Phys. Rev. E Stat. Phys. Plasmas Fluids. Relat. Interdiscip. Topics. 62, 150–160.
- Trenberth, K. T. 1984. Some effects of finite sample size and persistence on meteorological statistics. part I: autocorrelations. Mon. Wea. Rev. 112, 2359–2368. doi:10.1175/1520-0493(1984)112<2359:SEOFSS>2.0.CO;2
- Tsonis, A., Roebber, P. and Elsner, J. 1999. Long-range correlations in the extratropical atmospheric circulation: origins and implications. J. Clim. 12, 1534–1541. doi:10.1175/1520-0442(1999)012<1534:LRCITE>2.0.CO;2
- Vyushin, D. and Kushner, P. 2009. Power-law and long-memory characteristics of the atmospheric general circulation. J. Clim. 22, 2890–2904. doi:10.1175/2008JCLI2528.1
- Weber, R. O. and Talkner, P. 2001. Spectra and correlations of climate data from days to decades. J. Geophys. Res. 106, 20131–20144. doi:10.1029/2001JD000548
- Yuan, N., Ding, M., Huang, Y., Fu, Z., Xoplaki, E., and co-authors. 2015. On the long-term climate memory in the surface air temperature records over antarctica: a nonnegligible factor for trend evaluation. J. Clim. 28, 5922–5934. doi:10.1175/JCLI-D-14-00733.1
- Zhao, S. and He, W. 2015. Evaluation of the performance of the Beijing Climate Centre Climate System Model 1.1(m) to simulate precipitation across China based on long-range correlation characteristics. J. Geophys. Res. Atmos. 120, 12576–12588. doi:10.1002/2015JD024059
Appendix
This appendix contains three parts: (A) relationship between ACF and FA; (B) a discussion of the confidence interval for the ACF; and (C) the results of FA based on shorter range data and shuffled data.
Part (A)
Here, we show the relationship between ACF and FA. Given a fluctuation function,
(A1)
(A1)
and in order to be consistent with (Equation1
(1)
(1) ), then
(A2)
(A2)
The FA function is defined (Hurst Citation1951)
(A3)
(A3)
The first term of (EquationA2(A2)
(A2) ) is linearly proportional to n, with a constant critical exponent of one. In the second term,
dominates. If
following Courant and Robbins (Citation1996),
(A4)
(A4)
where B a quantity related to Bernoulli numbers. Therefore in (EquationA2
(A2)
(A2) ), if
and n is large enough, the second term dominates, thus
(A5)
(A5)
If
(A6)
(A6)
thus
which is called Hurst law (Hurst Citation1951). From (EquationA2
(A2)
(A2) ) and (EquationA3
(A3)
(A3) ), a large value of H corresponds to a larger value of
and a larger value of the accumulated ACF. Thus, a larger H indicates a stronger similarity between physical states at different time described by ACF.
In the article, we do not discuss the scaling rule of since it does not exist in general. The upper left plot of shows the global averaged results of ACF, in the natural logarithm coordinate of
and
for global mean, tropical mean, northern, and southern hemispheric means. However, strong fluctuations happen and it is difficult to determine the critical index, α, since the power-law of requires a linear relationship between the
and
coordinates. The problem is not caused by the length of data. In the right column of , the results of daily global mean, tropical mean, northern and southern Hemispheric means of potential height at 500 hPa are shown covering 13,880 days (1 January 1979–31 December 2016) with the seasonal cycle removed. It is shown the scaling relation does not appear as well satisfied. We also have checked the local geographical points, and found the power-law is not held either.
The bottom plots of show the corresponding results of FA, and unlike ACF the power-law scaling holds for both monthly mean data and daily data.
Part (B)
In statistics, a confidence interval is a type of interval estimate for the mean. Interval estimates are often required since the estimate of the mean varies from sample to sample. The confidence interval provides a lower and upper limits for the mean. The narrower the confidence interval, the deviation to the mean result is smaller.
Since we can consider
and
are a pair of time series.
is the correlation coefficient. We first perform a Fisher transformation to r, which is an approximate variance-stabilizing transformation for r. After Fisher transformation, the variance becomes approximately constant for all values of the population correlation coefficient. Thus, the confidence interval can be calculated, since the confidence interval is dependent on variance (or standard deviation).
Following Bonett and Wright (Citation2000) and Schweder and Hjort (Citation2016), by Fisher transformation,
(B1)
(B1)
The upper and lower confidence limits can be calculated by zU and zL as
(B2)
(B2)
where α is the confidence level and N is the length of the data. The confidence interval is
(B3)
(B3)
EquationEquation (B3)(B3)
(B3) show that the confidence interval depends on three factors: the selected confidence level, the values of the correlation coefficients, and the length of the dataset. Note that the wider the confidence interval, the lower the likelihood of reaching the selected confidence level. For example, if the confidence level is set to 0.9, then the result has 90% probability to appear in the range of (mean − 0.5 interval, mean + 0.5 interval).
Part (C)
is the same as but using the shuffled surrogate time series. It is interesting to find that the slopes for all cases reduce considerably compared to those in . Also, the differences between the different regions decrease, as all the curves are much more convergent. The values of H are very close 0.5 by fitting the curves for till For the large values of tau, the slopes deviate from 0.5. We fund that the deviation is mostly caused by the length of the data. Since the shuffled data are random, we have done a test by double the length of data and found that all the lines become straight and H = 0.5 is exactly followed. The results of 0.5 means that the results are in the white noise range. Therefore, climate persistence is lost in the surrogate time series. The results of the surrogate data prove there does exist the persistence in climate, i.e. the relationships in climate between neighbouring years.
Fig. A1. The FA calculated using the surrogate time series for global, tropical, and north/south hemisphere means. Three time series are considered for annual, DJF, and JJA means. Based on ECMWF monthly mean data of ERA-20C (1900–2010). τ is in unit of year.
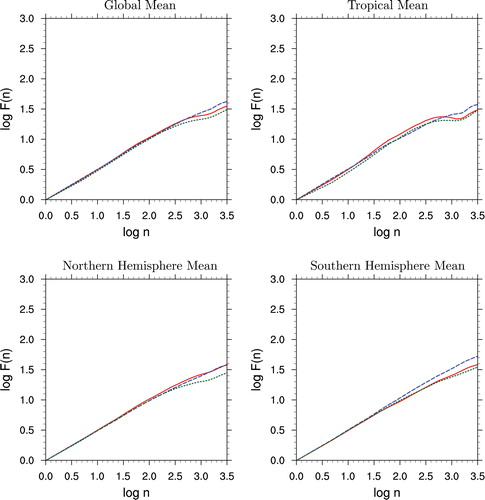
Fig. A2. Annual mean distribution of the critical exponents H of FA using the data of EAR-20C in periods of 1911–2010, 1951–2010, and 1971–2010.
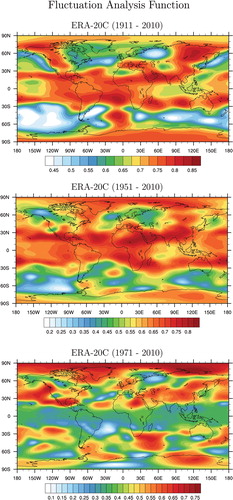
In , the results of the global distribution of the critical exponent of FA are presented for different lengths of ERA-20C. It is shown that the result of is very robust if we use the data for the last 100 years from 1911 to 2010. Even with data of 60 years (1951–2010), the changes are small compared with . However, if the data are too short, like using the data of the last 40 years from 1971 to 2010, the result becomes very different from , which means that a certain length in time series is required to obtain a correct FA.