
 ?Mathematical formulae have been encoded as MathML and are displayed in this HTML version using MathJax in order to improve their display. Uncheck the box to turn MathJax off. This feature requires Javascript. Click on a formula to zoom.
Abstract
This study investigated interdecadal variations in summer rainfall in central eastern China before and after the mid-1990s. The mean difference in rainfall between the two epochs (average rainfall in the 1981–1995 period: 5.0 mm day−1; average rainfall in the 1996–2010 period: 6.0 mm day−1) was significant at the 95% confidence level. This study explored the cause of the recent increase in summer rainfall in central eastern China by analyzing the difference in average rainfall between 1996–2010 (hereafter, Epoch II) and 1981–1995 (hereafter, Epoch I). Analysis of rainfall revealed that positive anomalies were observed in a southwest–northeast direction across the south-central region of eastern China, Korea, and Japan, while negative anomalies were observed at latitudes of 40–50°N and in most areas in the western North Pacific region. These findings suggest that summer rainfall in central eastern China is part of East Asian summer monsoons and have an out-of-phase relationship with western North Pacific monsoons. To identify the cause of the recent increase in summer rainfall in central eastern China, the difference in 850 hPa stream functions between Epoch II and Epoch I was analyzed. This study found that anomalous huge anticyclonic circulations were strengthened in the western North Pacific region and anomalous cyclonic circulations were strengthened in the south-central region of eastern China. As a result, anomalous northeasterlies originating from anomalous cyclones centered on Lake Baikal and anomalous southerlies originating from anomalous cyclones in the south-central area of eastern China joined in central eastern China. The typical anomalous atmospheric circulations in the negative Pacific Decadal Oscillation (PDO) phase and the average PDO index and summer rainfall in central eastern China from June to August exhibited a high negative correlation, which was presumed to have been present since the previous winter.
1. Introduction
Recently, many researchers have studied decadal and interdecadal variations in rainfall in China and East Asia (Simmonds et al., Citation1996, Citation1999; Huang et al., Citation1999; Zhai et al., Citation1999; Chang et al., Citation2000; Gong and Ho, Citation2002; Ding and Sun, Citation2003; Sun and Chen, Citation2003; Zhang et al., Citation2003; Zhou and Huang, Citation2003; Yang and Lau, Citation2004; Yu et al., Citation2004; Ha et al., Citation2005; Yu and Zhou, Citation2007; Zhou et al., Citation2009; Li et al., Citation2010; Qian and Zhou, Citation2014; Song et al., Citation2014; Yang et al., Citation2017a, Citation2017b), finding clear interdecadal variations in summer rainfall in China over the past 50 years. These variations exhibit the following two important features: (1) the occurrence of severe droughts in north China and frequent flooding of the Yangtze River Basin and south China from the late 1970s to the beginning of the 21st century and (2) abrupt shifts in the rainfall regime in the mid to late 1970s. These rainfall regime shifts are consistent with not only other variables but also significant and abrupt climate changes in other regions (Gerald et al., Citation2009). (3) increase of the summer rainfall along the Yangtze River valley but decreas in North China around the late 1970s, featuring a "south-flooding-north-drought" pattern. (4) the decadal change of the summer rainfall associated with the weakening of East Asian summer monsoon circulation. (5) the direct circulation system of the southwestward extension of the western Pacific subtropical high. (6) the interdecadal change of the East Asian summer monsoon dominated by the phase change of Pacific Decadal Oscillation (PDO) but compensated by the increased aerosol forcing. (7) the warming tropical Indian Ocean and western Pacific that is favorable for the westward extension of the western Pacific subtropical high.
Some studies have suggested that Asian summer monsoons have become weaker since the late 1970s (e.g., Wang, Citation2001). In connection with these changes, summer rainfall was reduced in the lower reaches of the Yellow River and the Huaihe River, but increased in the low and middle reaches of the Yangtze River. Wu (Citation2005) discovered that the Indian summer monsoon circulations underwent two epochs of weakening in the last 50 years, one in the mid-1960s and one in the late 1970s. The latter period matches the rainfall regime shift observed in eastern China.
However, how the weakening of East Asian summer monsoons affected the significant southward shift of the rainfall pattern in eastern China and what caused the weakening of East Asian summer monsoons remain unclear. So far, a few different physical explanations have been proposed, including one based on interannual and interdecadal variations in sea surface temperature in the Pacific and Indian Oceans (Ju and Slingo, Citation1995; Hu, Citation1997; Weng et al., Citation1999; Chang et al., Citation2000). Yang and Lau (Citation2004) showed that, in China, interannual and interdecadal variations in rainfall can be explained by the same mode observed in the sea surface temperature variations. Specifically, they showed statistical evidence of a very high negative correlation between sea surface temperature in the tropical central and eastern Pacific regions and rainfall in northern China and a very high positive correlation between interannual variations in rainfall in central eastern China and the north–south dipole mode of sea surface temperature anomalies in the western North Pacific, tropical Indian Ocean and warm pools. In the last two decades, there was apparent evidence of warm events contrasted with lowered sea level pressure and cold events in the tropical Pacific region. This phenomenon may have been caused by a long-term trend, an in-phase relationship between decadal and interannual variabilities, or increases in the overall sea surface temperature (Weng et al., Citation1999). In this respect, Yang and Lau (Citation2004) demonstrated that the warming trend of the El Niño-Southern Oscillation (ENSO)-like mode caused a downward trend of summertime rainfall in northern China and that the frequent summer floods in central-eastern China in recent years are linked with the trend of increased sea surface temperature in warm pools and the Indian Ocean. Yun et al. (Citation2010) investigated interdecadal variability in the relationships between the northward-propagating intraseasonal oscillation (NPISO) and ENSO. They found that before the late 1970s, the preceding winter ENSO influenced the early summer (i.e., May to June) NPISO activity, whereas after the late 1970s a strong relationship appeared during the later summertime (i.e., July to August). Wu and Wang (Citation2002) examined changes in the interannual relationship between the East Asian summer monsoon (EASM) and ENSO in the late 1970s, concurrent with the Pacific climate shift. They found that remarkable changes are found in the summer rainfall anomaly in northern China and Japan. From pre- to post shift period, the summer rainfall anomaly in eastern north China during decaying phases of El Niño changed from above to below normal, whereas that in central Japan changed from negative to normal.
In East Asia, the variability of rainfall has a significant impact on the development of the economy. It is influenced by many factors, including changes in the lower boundaries, such as sea surface temperature, snow, and soil moisture (Charney and Shukla, Citation1981). Previous studies have proposed that ENSO also affects the variability of seasonal rainfall in China (e.g. Huang and Wu, Citation1989; Zhang et al., Citation1999; Wang et al., Citation2000; Lau and Weng, Citation2001; Wu et al., Citation2003). For example, in the summer following a year with a mature warm ENSO phase, rainfall in the Yangtze River region tends to be above normal. On the other hand, Simmonds et al. (Citation1996) stressed that the associated west Pacific SSTs may be more influential in this link than the ENSO itself. Other studies have proposed that snow on the Tibetan Plateau affects the variability of China’s rainfall (e.g., Chen, Citation1991; Chen and Wu, Citation2000; Wu and Qian, Citation2003; Wu and Kirtman, Citation2007; Zhao et al., Citation2007). Specifically, excessive snow cover on the Tibetan Plateau during the winter and spring tends to result in above-normal rainfall in the Yangtze River region during the summer and in southern China during the late spring and early summer. Warming of the Tibetan Plateau is also associated with a change in summer rainfall in eastern China.
This study aims to investigate whether there are interdecadal variations in summer rainfall in central eastern China before and after the mid-1990s and examines the cause of interdecadal variability in summer rainfall in central eastern China. After that, this study demonstrates whether such variations, if any, are associated with PDO.
Section 2 introduces the data and analysis methods employed in this study. Section 3 presents the time series analysis of summer rainfall in central eastern China. Section 4 investigates the cause of interdecadal variability in summer rainfall in central eastern China, and the results of this study are summarized in Section 5.
2. Data and methods
2.1. Data
This study used data concerning geopotential height, zonal and meridional winds, and specific humidity obtained from the National Centers for Environmental Prediction-National Center for Atmospheric Research (NCEP-NCAR) reanalysis performed from 1981 to 2010 (Kalnay et al., Citation1996; Kistler et al., Citation2001). This dataset has a spatial resolution of 2.5° × 2.5° (latitude and longitude) and 17 vertical levels (specific humidity has 16 vertical levels). The velocity potential has a grid box of 192 × 94 (latitude and longitude, respectively) and 5 sigma levels. Guo et al. (Citation2019) pointed out that the NCEP product has much lower 3 D spatial resolution but current study uses NCEP product because results of rainfall variation in China are already verified in previous studies using NCEP product (Huang and Wu, Citation1989; Zhang et al., Citation1999; Wang et al., Citation2000; Lau and Weng, Citation2001; Wu et al., Citation2003).
The National Oceanic and Atmospheric Administration (NOAA) Extended Reconstructed Monthly Sea Surface Temperature (SST) (Reynolds et al., Citation2002) dataset, available from the same organization, was also used. The data have a horizontal resolution of 2.0° × 2.0° (latitude and longitude) and are available from 1854 to the present day.
This study also employed the NOAA Interpolated Outgoing Longwave Radiation (OLR) dataset, which was retrieved from the NOAA satellite series and is available at the NOAA’s Climate Diagnosis Center (CDC). This dataset includes data from June 1974 onwards. However, it is incomplete, as it is missing data from March to December of 1978. Detailed information about this dataset can be found on the CDC website (http://www.cdc.noaa.gov) and in Liebmann and Smith’s (Citation1996) study.
In addition, data was obtained from the Climate Prediction Center (CPC) Merged Analysis of Precipitation (CMAP) (Xie and Arkin, Citation1997). The horizontal spatial resolution of this dataset is the same as that of the NCEP-NCAR reanalysis dataset. The data is based on monthly averages, and it is available from 1979 to the present day. It concerns global rainfall over the ocean, which is measured by merging rain gauge observations, five different satellite estimates, and numerical model outputs.
The TC data in this study were obtained from the best track of TC provided by the Regional Specialized Meteorological Center (RSMC) and Tokyo Typhoon Center. This dataset includes TCs’ name, latitude and longitude location, central pressure, and maximum sustained wind speed (MSWS). Measurements were taken every 6 hours for 35 years (from 1978 to 2012). TCs are generally classified into one of four classes based on MSWS criteria: tropical depression (TD; MSWS < 17 m s−1), tropical storm (TS; 17 m s−1 ≤ MSWS ≤ 24 m s−1), severe tropical storm (STS; 25 m s−1 ≤ MSWS ≤ 32 m s−1), or typhoon (TY; MSWS ≥ 33 m s−1). Along with these four classes, this study included extratropical cyclone for analysis because these cyclones have greatly damaged property and human life in mid-latitude regions in East Asia.
In this study, the PDO index (Mantua et al., Citation1997) was obtained from the website of the University of Washington (http://jisao.washington.edu/pdo).
2.2. Methods
This study used the Student’s t-test to determine significance (Wilks, Citation1995). If two independent time series follow a t distribution and their time averages are denoted as and
the test statistic is given by the following equation:
where
and
are standard deviations and
and
are the numbers of time series. Based on the above formula, if the absolute value of t is significantly greater than the threshold values, the null hypothesis would be rejected at the
(×100)% significance level. The variables under consideration here possess a considerable amount of autocorrelation, which may decrease the 'effective degrees of freedom' for which the test should be conducted. For this, refer to the studies of Robert and Chen (Citation1983) and Wilks (Citation2011).
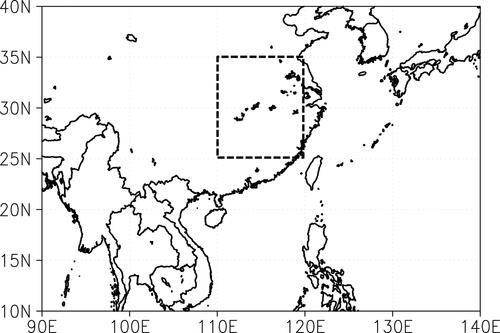
Central eastern China is defined as the area within 25–35°N, 110–120°E (). Summer rainfall is defined as the average rainfall from June to August.
Fig. 1. The definition of central eastern China area (25°-35°N, 110°-120°E).
2.3. Definition of Western North pacific monsoon index
shows the definition of the western North Pacific monsoon index (WNPMI). The WNPMI was calculated according to the following equation (Wang and Fan, Citation1999):
where UWND850 refers to the zonal wind at 850 hPa and (1) and (2) represent the area covering the Philippines from the southern region of the Indochinese Peninsula past the southern part of the South China Sea and the area from southern China to the sea off the eastern coast of Taiwan, respectively.
If the value of UWND850(1) is positive (i.e., there is stronger westerly wind) and the value of UWND850(2) is negative (i.e., there is stronger easterly wind), the WNPMI will be a positive value, indicating that the monsoon trough in the subtropical western North Pacific will be deepened. In contrast, if the value of UWND850(1) is negative (i.e., there is weaker westerly wind) and the value of UWND850(2) is positive (i.e., there is weaker easterly wind), the WNPMI will be a negative value, indicating that the monsoon trough in the subtropical western North Pacific will be weakened. In other words, if the value of WNPMI is positive (negative), anomalous cyclonic (anticyclonic) circulations will be strengthened in the subtropical western North Pacific. Similarly, through an OLR analysis, Wang and Fan (Citation1999) showed that strong (weak) western North Pacific monsoons are the result of greater (weaker) convection in the subtropical western North Pacific.
2.4. Definition of the East Asian summer monsoon index
In the present study, the EASM index (EASMI) is defined using the dynamical normalized seasonality (DNS) index developed by Li and Zeng (Citation2002, Citation2003, Citation2005). The DNS index is based on the intensity of the normalized seasonality of wind fields. Since monsoons have very strong seasonal variations in wind directions, it is valid to define strong and weak monsoons using the magnitude of the seasonality of wind fields. Applying this basic concept of monsoons, the DNS index can be explained with the following equation:
where
and
refer to the January climatological wind vector and the mean of January and July climatological wind vectors, respectively, and
refers to the monthly wind vector for month m in year n. The double vertical bars indicate normalization. On the right side of the formula, 2 is subtracted because the critical value of significance of the quantity
is 2 (Li and Zeng, Citation2000). Hereafter, the EASMI is defined as the area-averaged seasonal (June through August) DNS at 850 hPa in the East Asian monsoon domain (10–40°N, 110–140°E). Li and Zeng (Citation2000) showed clear negative correlations between the EASMI calculated with the above equation and rainfall from June to August in the middle and lower reaches of the Yangtze River in China, proving that the definition of EASMs presented above is valid. That is, when the EASMI is higher (lower), EASMs are weaker (stronger).
3. Time series analysis of summer rainfall in Central Eastern China
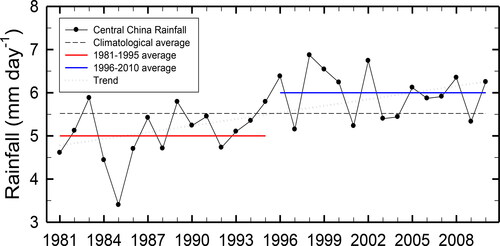
shows the time series of summer rainfall in central eastern China. In general, pronounced interannual and interdecadal variations are observed to increase. This trend was significant at the 90% confidence level. The mean difference in rainfall between the two epochs (average rainfall in the Epoch I: 5.0 mm day−1; average rainfall in the Epoch II: 6.0 mm day−1) was significant at the 95% confidence level.
Fig. 2. Time series of central eastern China rainfall in summer (June to August).
4. Differences between epoch II and epoch I
4.1. Large-scale environments
The spatial distribution of the differences in rainfall and OLR between Epoch II and Epoch I is presented in . The results of the rainfall analysis showed that positive anomalies were observed from southwest to northeast across the south-central region of eastern China, Korea, and Japan (). Negative anomalies were observed in East Asia between latitudes of 40°N and 50°N and most of the western North Pacific regions.
Fig. 3. Differences in (a) outgoing longwave radiation (OLR) and (b) rainfall between Epoch II and Epoch I.
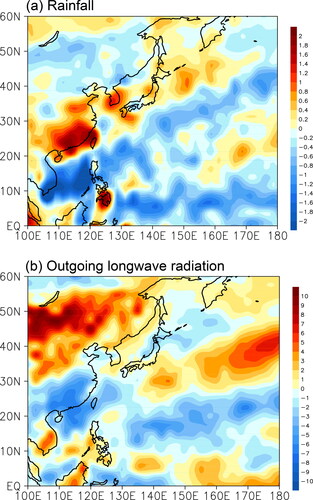
The OLR analysis revealed negative anomalies in the south-central region of eastern China that continued from southwest to northeast up to the sea of Northeast Japan (). Lower OLR values indicate higher convective activity. Therefore, the results of the analysis showed that convection was strengthened in these areas during the Epoch II. In contrast, the region of East Asia between latitudes of 40°N and 50°N exhibited positive anomalies.
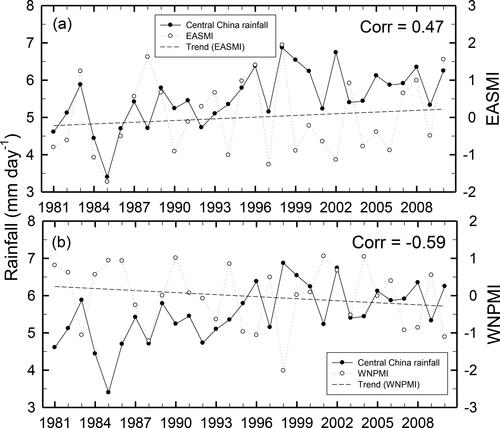
In short, during the Epoch II, summer rainfall increased in East Asian regions located at middle latitudes but decreased in the western North Pacific region. Next, a time series analysis of summer rainfall in central eastern China was performed in connection with EASMI and WNPMI (). The time series analysis of summer rainfall in central eastern China and EASMI showed that EASMI seemed to increase until recently, but no statistical significance was found (). Also, a distinct in-phase relationship and a positive correlation (0.47) were observed for the two variables. There is no large difference in correlation (0.45) even though time series are detrended. This correlation was significant at the 99% confidence level. This means that summer rainfall in central eastern China is part of EASM. The time series of summer rainfall in central eastern China and WNPMI showed that WNPMI seemed to decrease until recently, but again, no statistical significance was found (). In addition, a distinct out-of-phase relationship and a high negative correlation (0.59) were observed for the two variables. There is no large difference in correlation (0.58) even though time series are detrended. This means that as the summer rainfall in central eastern China increases (decreases), WNPM becomes weaker (stronger).
Fig. 4. Time series of (a) central eastern China rainfall (solid line with a closed circle) and western North Pacific monsoon index (WNPMI) (dotted line with an open circle) and (b) central eastern China rainfall (solid line with a closed circle) and East Asian summer monsoon index (EASMI) (dotted line with an open circle) in summer (June to August).
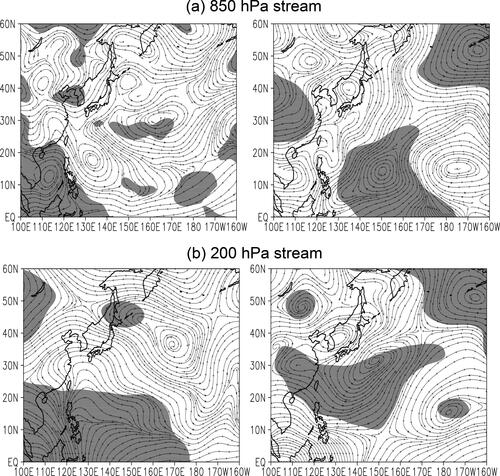
To identify the cause of the recent increase in summer rainfall in central eastern China, the difference in 850 hPa stream functions between the two epochs was analyzed (). The analysis revealed that large anomalous anticyclonic circulations were strengthened in the western North Pacific region and anomalous cyclonic circulations were strengthened in the south-central region of eastern China. As a result, anomalous northeasterlies originating from anomalous cyclones centered on Lake Baikal and anomalous southerlies originating from anomalous cyclones located in the south-central area of eastern China were joined in central eastern China. Due to these anomalous atmospheric circulations, summer rainfall in the south-central region of eastern China increased in the Epoch II. Analysis of the difference in 200 hPa stream functions between the two epochs revealed that anomalous cyclonic circulations were strengthened in southern China and anomalous anticyclonic circulations were strengthened in northern China (). The mid-northern part of China is characterized by the joining of anomalous flows originating from the two anomalous circulations.
Fig. 5. Same as in , but for (a) 850 hPa stream functions and (b) 200 hPa stream functions. Shaded areas are significant at the 95% confidence level.
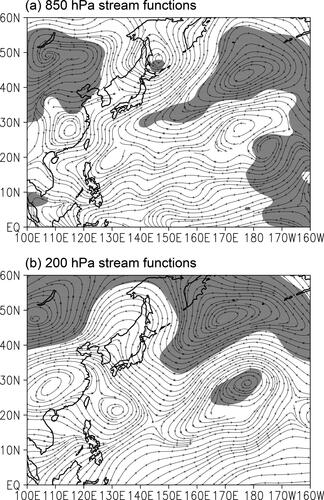
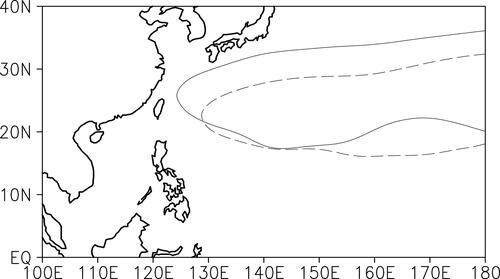
In the above analysis of the difference in 850 hPa stream function between Epoch II and Epoch I, the strengthened anomalous anticyclonic circulation in the western North Pacific region may be interpreted as further strengthening of the western North Pacific subtropical high (WNPSH) in the Epoch II. Therefore, the degree of development of the WNPSH in the Epoch I and Epoch II was analyzed (). At this time, the WNPSH has a value greater than 5,875 gpm. As shown in , the WNPSH developed more in the northwest direction, towards the Eastern China Sea, in the Epoch II (solid line) compared to the Epoch I (dashed line). In terms of climatological aspects, since a large amount of water vapor travels along the western margin of the WNPSH, it is likely that the WNPSH was able to supply more water vapor to this region in the Epoch II, when it was closer to central eastern China (Yu and Zhou, Citation2005). Guo et al. (Citation2019) showed that due to differences in regional atmospheric circulation and in hydrological and topographic features, the mean moisture sources vary among East Asia subregions. The tropical oceanic source dominates southeastern East Asia, while the extratropical continental source dominates other East Asia subregions.
Fig. 6. Western North Pacific subtropical highs (WNPSHs) in Epoch II (solid line) and Epoch I (dashed line).
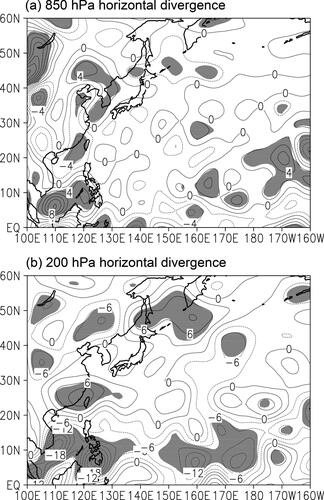
To characterize the vertical atmospheric circulation between the two epochs, the differences in 850 hPa and 200 hPa horizontal divergence in the two epochs were analyzed (). First, regarding the 850 hPa horizontal divergence, negative anomalies were observed in eastern China (). This means that anomalous convergence was strengthened in this region during the Epoch II. Second, regarding the 200 HPa horizontal divergence, positive anomalies were observed in the same region, indicating that anomalous divergence was strengthened in this region (). Therefore, it can be presumed that anomalous upward flows were strengthened both in the upper and lower layers of the troposphere in eastern China in the Epoch II. Additionally, in many areas of the western north Pacific region, negative anomalies and positive anomalies were strengthened in terms of 850 hPa and 200 hPa horizontal divergence, respectively, indicating that anomalous downward flows were strengthened in this region in the Epoch II.
Fig. 7. Same as in , but for (a) 850 hPa horizontal divergence and (b) 200 hPa horizontal divergence. Shaded areas are significant at the 95% confidence level. Contour interval is 2 s−1*107 for 850 hPa horizontal divergence and 3 s−1*107 for 200 hPa horizontal divergence.
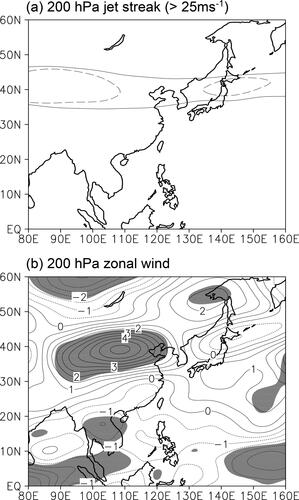
The upper troposphere jet stream is the main factor that strengthens upward flows. The upper-level jet can strengthen convergence to form upward flows, which can thereby induce precipitation (Liang and Wang, Citation1998; Lau and Nath, Citation2000). Therefore, the degree of development of the jet stream in the Epoch I and Epoch II was analyzed (). The jet stream is defined as an area with zonal wind greater than 25 m/s−1. As shown in , the jet stream was more strongly developed in the east–west direction in the Epoch II than in the Epoch I, suggesting that a favorable environment to strengthen anomalous upward flows was created in central eastern China in the Epoch II. The strengthened jet stream in the Epoch II was confirmed by analysis of the difference in 200 hPa zonal wind between the Epoch I and Epoch II (). This analysis found strong positive anomalies at 30–40°N, 90–120°E, indicating that the zonal wind in this region was more reinforced in the Epoch II compared to the Epoch I.
Fig. 8. (a) 200 hPa jet streaks of Epoch II (solid line) and Epoch I (dashed line) and (b) difference in 200 hPa zonal wind between Epoch II and Epoch I. Here, jet streak is an area that zonal wind at 200 hPa is greater than 25 ms−1. In (b), contour interval is 0.5 ms−1 and shaded areas are significant at the 95% confidence level.
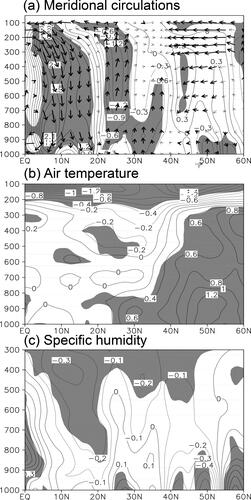
To examine whether anomalous upward flows were actually strengthened in central eastern China during the Epoch II period, the difference between Epoch II and Epoch I in terms of mean meridional atmospheric circulation at longitudes of 110–120°E was analyzed (). The analysis found that while anomalous upward flows were strengthened at latitudes of 20–40°N, which includes central eastern China, anomalous downward flows were strengthened in the South China Sea. This means that anomalous meridional atmospheric circulations, in which the air rising from the eastern part of China was descending, were strengthened in the Epoch II. The difference in air temperature between the two epochs revealed that, at latitudes of 20-40°N, warm anomalies appeared in the lower part of the troposphere while cooling has taken place in the upper part of the troposphere (). Such vertical distribution of air temperature can cause thermal instability and form rainfall. Analysis of the difference in specific humidity between the two epochs revealed that positive anomalies were strengthened in the lower part of the troposphere at latitudes of 20–40°N, which includes eastern China (). Due to the increase in anomalous warm, humid air in the lower part of the troposphere, which leads to thermal instability, an environment favorable for increasing rainfall was created in this area during the Epoch II.
Fig. 9. Composite differences of latitude–pressure cross section of (a) vertical velocity (contours) and meridional circulations (vectors), (b) air temperature, and (c) specific humidity averaged along 110°-120°E between Epoch II and Epoch I in June to August. The values of vertical velocity are multiplied by −100. Bold arrows and shaded areas are significant at the 90% confidence level. Contour intervals are 0.3−2hPa s−1 for vertical velocity, 0.2 °C for air temperature, and 0.1 g kg−1 for specific humidity, respectively.
4.2. Tropical cyclone activity
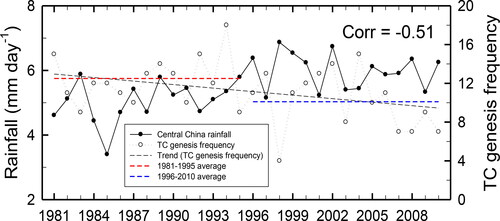
As previously found, in the Epoch II, anomalous downward flows were strengthened in the South China Sea and convection was weakened in the western North Pacific region. The weakened convection in the western North Pacific region may be associated with low TC genesis frequency in this region. Therefore, a time series analysis of summer rainfall in central eastern China and TC genesis frequency in the western North Pacific region from June to August was conducted (). TC genesis frequency showed an overall decreasing trend that was significant at the 90% confidence level. While the mean TC genesis frequency in the Epoch I was 12.5TCs, that in the Epoch II was 10.1 TCs. The difference in TC genesis frequency between the two epochs was significant at the 90% confidence level. There was also a pronounced out-of-phase relationship between the two variables and a high negative correlation (-0.51), which was significant at the 99% confidence level. In other words, as summer rainfall in East Asia, including central eastern China, increases (decreases), TC genesis frequency decreases (increases) in the western North Pacific.
Fig. 10. Time series of central eastern China rainfall (solid line with a closed circle) and western North Pacific TC genesis frequency (dotted line with an open circle) in June to August.
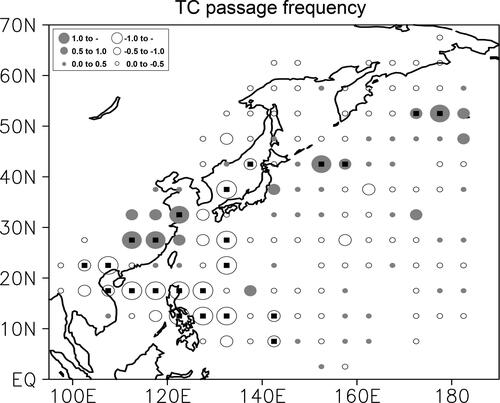
TC frequency is one of the main causes of increased or decreased summer rainfall in central eastern China. Therefore, the difference in TC passage frequency between Epoch II and Epoch I was analyzed (). In the Epoch I, there was a strong tendency towards westward movement across the east coast of the Philippines and the South China Sea towards the Indochina Peninsula or northward movement toward Korea and Japan. In the Epoch II, TC passage frequency was higher in eastern China. This suggests that TCs played a role in the increased summer rainfall in central eastern China during the Epoch II. Rudeva and Simmonds (Citation2015) showed that a global analysis of frontal activity variability derived from ERA-Interim data over the 34-yr period of January 1979–March 2013 using a state-of-the-art frontal tracking scheme. In December–February over that epoch, there is a northward shift of frontal activity in the Pacific in the Northern Hemisphere (NH). In the Southern Hemisphere (SH), the largest trends are identified in the austral summer and are manifested by a southward shift of frontal activity over the Southern Ocean. The difference in TC passage frequency between the two epochs is associated with the degree of development of WNPSH in both periods (); during the Epoch II, when WNPSH developed more to the west, TCs moved toward the eastern part of China, whereas during the Epoch I, when WNPSH failed to develop westward, TCs moved east towards Korea and Japan. In addition, in the Epoch I, TCs were directed towards the Indochina Peninsula; due to the failure of the WNPSH to develop, TCs moved west with the anomalous trade winds that developed at low latitudes.
Fig. 11. Difference in TC passage frequency between Epoch II and Epoch I. Small squares inside the circles indicate that the differences are significant at the 95% confidence level.
4.3. Association with PDO
showed that anomalous anticyclonic circulations are developed in most areas of the western North Pacific. These are typical anomalous atmospheric circulations that appear in the negative PDO phase. Therefore, in this study, a time series analysis of the mean PDO index and summer rainfall in central eastern China from June to August was conducted (). The PDO index showed a decreasing trend, which was significant at the 90% confidence level. It also showed pronounced negative indices in terms of interdecadal change in summer rainfall in central eastern China since the late 1990s. Moreover, there was a distinct out-of-phase relationship between the two variables and a high negative correlation (-0.52), which was significant at the 99% confidence level.
Fig. 12. Time series of central eastern China rainfall (solid line with a closed circle) and Pacific Decadal Oscillation (PDO) index (dotted line with an open circle) (a) in June to August and (b) in December to February.
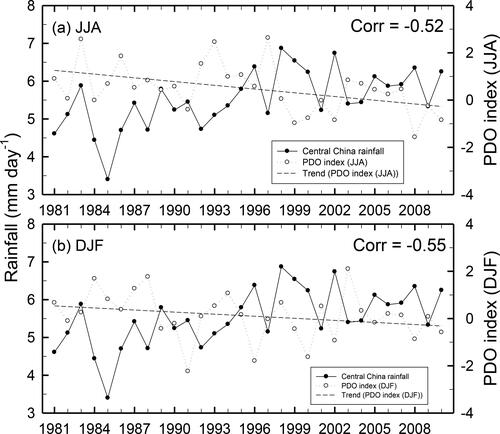
Since PDO tends to be evident during the winter months, the negative correlation between rainfall in central eastern China and PDO in the summer is likely to have been present since the winter. Therefore, in this study, a time series analysis of the PDO index from December to February and summer rainfall in central eastern China was conducted (). The PDO index showed a decreasing trend, but no statistical significance was found. There was a pronounced out-of-phase relationship between the two variables and a high negative correlation (-0.55), which was significant at the 99% confidence level.
The difference in 850 hPa stream functions in the winter during Epoch I and Epoch II was analyzed (upper left panel in ). The analysis revealed that anomalous anticyclonic circulations centered at 60°N were connected in the northeast–southeast direction across Korea and south China and anomalous cyclonic circulations were strengthened in the subtropical Western Pacific. Due to the nature of these anomalous atmospheric circulations, anomalous easterlies and anomalous southerlies joined in central eastern China. The difference between the two epochs in terms of 200 hPa stream functions in winter confirmed that anomalous southerlies in central eastern China were strengthened (lower left panel in ).
Fig. 13. Same as in , but for (a) 850 hPa stream functions and (b) 200 hPa stream functions. Left and right panels denote the average of December to February (DJF) and the average of March to May (MAM), respectively. Shaded areas are significant at the 95% confidence level.
The difference between Epoch II and Epoch I in terms of 850 hPa stream functions in spring (March to May) showed a spatial distribution similar to that of the difference in summer. Anomalous anticyclonic circulations centered in the Bering Sea were extended in the southwest–northeast direction to the east coast of the Philippines. In addition, anomalous northeasterlies and southerlies were joined in central eastern China (upper right panel in ). The difference between the two epochs in terms of 200 hPa stream functions in winter confirmed that central eastern China was influenced by anomalous southeasterlies (lower right panel in ).
5. Summary and conclusion
This study explored interdecadal variations in summer rainfall in central eastern China before and after the mid-1990s. In most years from 1981 to 1995, the annual rainfall was below the 30-year average (5.5 mm day−1), and in most years from 1996 to 2010, the annual rainfall was above the 30-year average. To determine the cause of the recent increase in summer rainfall in central eastern China, this study analyzed the difference in average rainfall between Epoch II and Epoch I.
The analysis of rainfall revealed that positive anomalies were observed from the southwest to northeast across the south-central region of eastern China, Korea, and Japan and negative anomalies were observed at latitudes of 40–50°N and in most areas in the western North Pacific region.
To identify the cause of the recent increase in summer rainfall in central eastern China, the difference in 850 hPa stream functions between Epoch II and Epoch I was analyzed. It was found that anomalous large anticyclonic circulations were strengthened in the western North Pacific region and anomalous cyclonic circulations were strengthened in the south-central region of eastern China. As a result, anomalous northeasterlies originating from anomalous cyclones centered on Lake Baikal and anomalous southerlies originating from anomalous cyclones located in the south-central area of eastern China were joined in the central eastern China region. Due to these anomalous atmospheric circulations, summer rainfall in the south-central region of eastern China increased in the Epoch II.
The finding that anomalous anticyclonic circulation was strengthened in the western North Pacific region may indicate that the WNPSH was strengthened in the Epoch II. Therefore, the degree of development of the WNPSH in Epoch I and Epoch II was analyzed. The analysis found that the WNPSH developed more in the northwest direction, towards the Eastern China Sea, in the Epoch II than in the Epoch I. This suggests that the WNPSH was likely to supply more water vapor to this region in the Epoch II, when it was closer to central eastern China.
Analysis of the degree of the development of the jet stream found stronger development in the east–west direction in the Epoch II than in the Epoch I. This suggests that during the Epoch II, an environment favorable for strengthening anomalous upward flows was formed in central eastern China.
To examine whether anomalous upward flows were actually strengthened in central eastern China during the Epoch II, the difference in mean meridional atmospheric circulation across the areas located at longitudes of 110–120°E between the two epochs was analyzed. It was found that while anomalous upward flows were strengthened at latitudes of 20–40°N, including in central eastern China, anomalous downward flows were strengthened in the South China Sea. This means that anomalous meridional atmospheric circulations, in which the air rising from the eastern part of China descended, were strengthened in the Epoch II. In addition, the difference in air temperature between the two epochs revealed that at latitudes of 20–40°N, warm anomalies were strengthened in the upper part of the troposphere and cold anomalies were strengthened in the lower part. This vertical distribution of air temperature resulted in thermal instability, forming rainfall.
Because anomalous downward flows were strengthened in the South China Sea and convection was weakened in the western North Pacific in the Epoch II, a time series analysis of summer rainfall in central eastern China and the western north Pacific TC genesis frequency was performed. The two variables exhibited a high negative correlation (-0.51).
TC frequency is one of the main causes of increases and decreases in summer rainfall in central eastern China. Therefore, the difference in TC passage frequency between Epoch II and Epoch I was analyzed. In the Epoch I, there was a strong trend of westward movement across the east coast of the Philippines and South China Sea towards the Indochina Peninsula or northward movement toward Korea and Japan. In the Epoch II, the TC passage frequency was higher in eastern China, suggesting that TC played a role in the increase in summer rainfall in central eastern China during the Epoch II.
As mentioned before, anomalous anticyclonic circulations developed in most areas in the western North Pacific. These were typical anomalous atmospheric circulations that appear in the negative PDO phase. Therefore, a time series analysis of the mean PDO index and summer rainfall in central eastern China from was conducted. Consistent with the interdecadal change in summer rainfall in central eastern China, there were pronounced negative indices after the late 1990s. In addition, the two variables showed a high negative correlation (-0.52).
Since PDO tended to be evident during the winter months, the negative correlation between rainfall in central eastern China and PDO in summer is likely to have been present since winter. Therefore, in this study, a time series analysis of the PDO index from December to February and summer rainfall in central eastern China was conducted. Because the analysis found a high negative correlation between the two variables, the difference in 850 hPa stream functions in winter between Epoch II and Epoch I was analyzed. The results showed that anomalous anticyclonic circulations centered at 60°N were connected from the northeast to southeast across Korea and southern China and the anomalous cyclonic circulations were strengthened in the subtropical western Pacific. Due to the nature of these anomalous atmospheric circulations, anomalous easterlies and southerlies joined in central eastern China. The difference in 850 hPa stream functions in spring (March to May) between the two epochs showed a spatial distribution similar to that of the difference in the summer.
A short paragraph on what the impact of Arctic sea ice reduction might have been. It has been shown by Simmonds (Citation2015) that the (late) summer sea ice decrease essentially started after 1996 (their ), so the sea ice cover was very different in Epochs I and II. The reduction of sea ice is important for driving teleconnection patterns from the Arctic into the high and midlatitudes (Luo and Yao, 2017a, 2017b). While current study have stressed the role of changing SST, it is also quite likely that Arctic sea change in Epoch II is influencing the circulation changes.
Disclosure statement
No potential conflict of interest was reported by the author(s).
Additional information
Funding
References
- Chang, C. P., Chang, Y. and Li, T. 2000. Interannual and inter-decadal variations of the East Asian summer monsoon and tropical pacific SSTs. Part I: role of the subtropical ridge. J. Clim. 13, 4310–4325. doi:https://doi.org/10.1175/1520-0442(2000)013<4310:IAIVOT>2.0.CO;2
- Charney, J. and Shukla, J. 1981. Predictability of monsoons. In: Monsoon Dynamics (eds. J. Lighthill and R. P. Pearce). Cambridge University Press, pp. 99–109.
- Chen, L. T. 1991. Lag association between snow cover over Qinghai-Xizang Plateau and monsoon rainfall in south China applied to long-range weather forecasting. In: Proceedings of the ICTP/WMO Int. Technical Conf. on Long-Range Weather Forecasting Research, Trieste, Italy, Wmo, Wmo/Td, Vol. 395, pp. 39–43.
- Chen, L. T. and Wu, R. 2000. Interannual and decadal variations of snow cover over Qinghai-Xizang Plateau and their relationships to summer monsoon rainfall in China. Adv. Atmos. Sci. 17, 18–30.
- Ding, Y. H. and Sun, Y. 2003. Inter-decadal variation of the temperature and rainfall patterns in East Asian monsoon region. In Proceedings of the International Symposium on Climate Change (ISCC). Beijing, China, 31 March–3 April, 2003. WMO/TD-No. 1172, 66–71.
- Gerald, A. M., Hu, A. and Benjamin, D. S. 2009. The mid-1970s climate shift in the Pacific and the relative roles of forced versus inherent decadal variability. J. Clim. 22, 780–792.
- Gong, D. Y. and Ho, C. H. 2002. Shift in the summer rainfall over the Yangtze River valley in the late 1970s. Geophys. Res. Lett. 29, 78–1–78-4.
- Guo, L., van der Ent, R. J., Klingaman, N. P., Demory, M.-E., Vidale, P. L. and co-authors. 2019. Moisture sources for East Asian precipitation: mean seasonal cycle and interannual variability. J. Hydrometeor 20, 657–672. doi:https://doi.org/10.1175/JHM-D-18-0188.1
- Ha, K. J., Park, S. K. and Kim, K. Y. 2005. On interannual characteristics of climate prediction center merged analysis precipitation over the Korean peninsula during the summer monsoon season. Int. J. Climatol. 25, 99–116. doi:https://doi.org/10.1002/joc.1116
- Hu, Z. Z. 1997. Inter-decadal variability of summer climate over East Asia and its association with 500 hPa height and global sea surface temperature. J. Geophys. Res. 102, 19403–19412. doi:https://doi.org/10.1029/97JD01052
- Huang, R. H. and Wu, Y. F. 1989. The influence of ENSO on the summer climate change in China and its mechanism. Adv. Atmos. Sci. 6, 21–32.
- Huang, R. H., Xu, Y. H. and Zhu, L. T. 1999. Inter-decadal variation and dry trend of summer precipitation in China. J. Plateau Meteorol. 18, 465–476.
- Ju, J. H. and Slingo, J. 1995. The Asian summer monsoon and ENSO. Q. J. Royal Meteorol. Soc. 121, 1133–1168. doi:https://doi.org/10.1002/qj.49712152509
- Kalnay, E., Kanamitsu, M., Kistler, R., Collins, W., Deaven, D. and co-authors. 1996. The NCEP/NCAR 40-year reanalysis project. Bull. Am. Meteorol. Soc. 77, 437–471. doi:https://doi.org/10.1175/1520-0477(1996)077<0437:TNYRP>2.0.CO;2
- Kistler, R., Collins, W., Saha, S., White, G., Woollen, J. and co-authors. 2001. The NCEP/NCAR 50-year reanalysis. Bull. Am. Meteorol. Soc. 82, 247–267. doi:https://doi.org/10.1175/1520-0477(2001)082<0247:TNNYRM>2.3.CO;2
- Lau, K. M. and Weng, H. 2001. Coherent modes of global SST and summer rainfall over China: an assessment of the regional impacts of the 1997–98 El Niño. J. Clim. 14, 1294–1308. doi:https://doi.org/10.1175/1520-0442(2001)014<1294:CMOGSA>2.0.CO;2
- Lau, N. C. and Nath, M. J. 2000. Impact of ENSO on the variability of the Asian-Australian monsoons as simulated in GCM experiments. J. Clim. 13, 4287–4309. doi:https://doi.org/10.1175/1520-0442(2000)013<4287:IOEOTV>2.0.CO;2
- Li, H., Dai, A., Zhou, T. and Lu, J. 2010. Responses of East Asian summer monsoon to historical SST and atmospheric forcing during 1950-2000. Clim. Dyn. 34, 501–514. doi:https://doi.org/10.1007/s00382-008-0482-7
- Li, J. P. and Zeng, Q. C. 2000. Significance of the normalized seasonality of wind field and its nationality for characterizing the monsoon. Sci. China Ser. D-Earth. Sci. 43, 646–653. doi:https://doi.org/10.1007/BF02879509
- Li, J. P. and Zeng, Q. C. 2002. A unified monsoon index. Geophys. Res. Lett. 29, 115–1–115-4.
- Li, J. P. and Zeng, Q. C. 2003. A new monsoon index and the geographical distribution of the global monsoons. Adv. Atmos. Sci. 20, 299–302.
- Li, J. P. and Zeng, Q. C. 2005. A new monsoon index, its interannual variability and relation with monsoon precipitation. Clim. Environ. Res. 10, 351–365.
- Liang, X. Z. and Wang, W. C. 1998. Association between China monsoon rainfall and tropospheric jets. Q. J. R. Meteorol. Soc. 124, 2597–2623. doi:https://doi.org/10.1002/qj.49712455204
- Liebmann, B. and Smith, C. A. 1996. Description of a complete (interpolated) outgoing longwave radiation dataset. Bull. Am. Meteorol. Soc 77, 1275–1277.
- Luo, D., Yao, Y., Dai, A., Simmonds, I. and Zhong, L. 2017b. Increased quasi-stationarity and persistence of winter Ural Blocking and Eurasian extreme cold events in response to Arctic warming. Part II: A theoretical explanation. J. Clim. 30, 3569–3587. doi:https://doi.org/10.1175/JCLI-D-16-0262.1
- Mantua, N. J., Hare, S. R., Zhang, Y., Wallace, J. M. and Francis, R. C. 1997. A Pacific interdecadal climate oscillation with impacts on salmon production. Bull. Am. Meteorol. Soc. 78, 1069–1079. doi:https://doi.org/10.1175/1520-0477(1997)078<1069:APICOW>2.0.CO;2
- Qian, C. and Zhou, T. 2014. Multidecadal variability of North China aridity and its relationship to PDO during 1900–2010. J. Clim. 27, 1210–1222. doi:https://doi.org/10.1175/JCLI-D-13-00235.1
- Reynolds, R. W., Rayner, N. A., Smith, T. M., Stokes, D. C. and Wang, W. 2002. An improved in situ and satellite SST analysis for climate. J. Clim. 15, 1609–1625. doi:https://doi.org/10.1175/1520-0442(2002)015<1609:AIISAS>2.0.CO;2
- Robert, E. L. and Chen, W. Y. 1983. Statistical field significance and its determination by Monte Carlo techniques. Mon. Weather Rev. 111, 46–59.
- Rudeva, I. and Simmonds, I. 2015. Variability and trends of global atmospheric frontal activity and links with large-scale modes of variability. J. Clim. 28, 3311–3330. doi:https://doi.org/10.1175/JCLI-D-14-00458.1
- Simmonds, I. 2015. Comparing and contrasting the behaviour of Arctic and Antarctic sea ice over the 35-year period 1979-2013. Ann. Glaciol. 56, 18–28. doi:https://doi.org/10.3189/2015AoG69A909
- Simmonds, I., Bi, D. and Hope, P. 1999. Atmospheric water vapor flux and its association with rainfall over China in summer. J. Clim. 12, 1353–1367. doi:https://doi.org/10.1175/1520-0442(1999)012<1353:AWVFAI>2.0.CO;2
- Simmonds, I., Bi, D. and Yan, B. 1996. Relationships between summer rainfall over China and ocean temperatures in the tropical western Pacific. J. Meteorol. Soc. Jpn. 74, 273–279. doi:https://doi.org/10.2151/jmsj1965.74.2_273
- Song, F., Zhou, T. and Qian, Y. 2014. Responses of East Asian summer monsoon to natural and anthropogenic forcings in the 17 latest CMIP5 models. Geophys. Res. Lett. 41, 596–603. doi:https://doi.org/10.1002/2013GL058705
- Sun, L. H. and Chen, X. F. 2003. Decadal climate characters and formation condition of flooding in south and drought in north in China. J. Appl. Meteorol. 14, 641–647.
- Wang, B. and Fan, Z. 1999. Choice of South Asian summer monsoon indices. Bull. Am. Meteorol. Soc. 80, 629–638. doi:https://doi.org/10.1175/1520-0477(1999)080<0629:COSASM>2.0.CO;2
- Wang, B., Wu, W. and Fu, X. 2000. Pacific–East Asian teleconnection: How does ENSO affect East Asian climate? J. Clim. 13, 1517–1536. doi:https://doi.org/10.1175/1520-0442(2000)013<1517:PEATHD>2.0.CO;2
- Wang, H. J. 2001. The weakening of the Asian monsoon circulation after the end of 1970’s. Adv. Atmos. Sci. 18, 376–386.
- Weng, H., Lau, K. M. and Xue, Y. 1999. Multi-scale summer rainfall variability over China and its long-term link to global sea surface temperature variability. J. Meteorol. Soc. Jpn. 77, 845–857. doi:https://doi.org/10.2151/jmsj1965.77.4_845
- Wilks, D. S. 1995. Statistical Methods in the Atmospheric Sciences. Academic Press, 467 pp.
- Wilks, D. S. 2011. Statistical Methods in the Atmospheric Sciences. 3rd ed. Academic Press, 504 pp.
- Wu, B. Y. 2005. Weakening of Indian summer monsoon in recent decades. Adv. Atmos. Sci. 22, 21–29.
- Wu, R. and Kirtman, B. P. 2007. Observed relationship of spring and summer East Asian rainfall with winter and spring Eurasian snow. J. Clim. 20, 1285–1304. doi:https://doi.org/10.1175/JCLI4068.1
- Wu, R. and Wang, B. 2002. Contrast of the East Asian summer monsoon-ENSO relationship between 1962–77 and 1978–93. J. Clim. 15, 3266–3279. doi:https://doi.org/10.1175/1520-0442(2002)015<3266:ACOTEA>2.0.CO;2
- Wu, R., Hu, Z. Z. and Kirtman, B. P. 2003. Evolution of ENSO-related rainfall anomalies in East Asia. J. Clim. 16, 3742–3758. doi:https://doi.org/10.1175/1520-0442(2003)016<3742:EOERAI>2.0.CO;2
- Wu, T. W. and Qian, Z. A. 2003. The relation between the Tibetan winter snow and the Asian summer monsoon and rainfall: An observational investigation. J. Clim. 16, 2038–2051. doi:https://doi.org/10.1175/1520-0442(2003)016<2038:TRBTTW>2.0.CO;2
- Xie, P. and Arkin, P. A. 1997. Global precipitation: A 17-year monthly analysis based on gauge observations, satellite estimates, and numerical model outputs. Bull. Am. Meteorol. Soc. 78, 2539–2558. doi:https://doi.org/10.1175/1520-0477(1997)078<2539:GPAYMA>2.0.CO;2
- Yang, F. L. and Lau, K. M. 2004. Trend and variability of China precipitation in spring and summer: Linkage to sea-surface temperatures. Int. J. Climatol. 24, 1625–1644. doi:https://doi.org/10.1002/joc.1094
- Yang, Q., Ma, Z. and Xu, B. 2017a. Modulation of monthly precipitation patterns over East China by the Pacific decadal oscillation. Clim. Change 144, 405–417. doi:https://doi.org/10.1007/s10584-016-1662-9
- Yang, Q., Ma, Z., Fan, X., Yang, Z. L., Xu, Z. and co-authors. 2017b. Decadal modulation of precipitation patterns over eastern China by sea surface temperature anomalies. J. Clim. 30, 7017–7033. doi:https://doi.org/10.1175/JCLI-D-16-0793.1
- Yao, Y., Luo, D., Dai, A. and Simmonds, I. 2017a. Increased quasi-stationarity and persistence of winter Ural Blocking and Eurasian extreme cold events in response to Arctic warming. Part I: Insights from observational analyses. J. Clim. 30, 3549–3568. doi:https://doi.org/10.1175/JCLI-D-16-0261.1
- Yu, R. C. and Zhou, T. 2005. Atmospheric water vapor transport associated with typical anomalous summer rainfall patterns in China. J. Geophys. Res. 110, D08104.
- Yu, R. C. and Zhou, T. 2007. Seasonality and three-dimensional structure of the interdecadal change in East Asian monsoon. J. Clim. 20, 5344–5355. doi:https://doi.org/10.1175/2007JCLI1559.1
- Yu, R. C., Wang, B. and Zhou, T. 2004. Tropospheric cooling and summer monsoon weakening trend over East Asia. Geophys. Res. Lett. 31, L22212.
- Yun, K. S., Seo, K. H. and Ha, K. J. 2010. Interdecadal change in the relationship between ENSO and the intraseasonal oscillation in East Asia. J. Clim. 23, 3599–3612. doi:https://doi.org/10.1175/2010JCLI3431.1
- Zhai, P. M., Ren, F. M. and Zhang, Q. 1999. Detection of trends in China’s precipitation extremes. Acta Meteorol. Sin. 57, 208–216.
- Zhang, Q. Y., Wang, J. and Tao, S. Y. 2003. The decadal and internannual variations of drought in the northern China and association with the circulations. Clim. Environ. Res. 8, 274–290.
- Zhang, R. H., Sumi, A. and Kimoto, M. 1999. Adiagnostic study of the impact of El Niño on the precipitation in China. Adv. Atmos. Sci. 16, 229–241. doi:https://doi.org/10.1007/BF02973084
- Zhao, P., Zhou, Z. J. and Liu, J. P. 2007. Variability of Tibetan spring snow and its associations with the hemispheric extratropical circulation and East Asian summer monsoon rainfall: An observational investigation. J. Clim. 20, 3942–3955. doi:https://doi.org/10.1175/JCLI4205.1
- Zhou, L. T. and Huang, R. H. 2003. Research on the characteristics of interdecadal variability of summer climate in China and its possible cause. Clim. Environ. Res. 8, 274–290.
- Zhou, T., Yu, R., Zhang, J., Drange, H., Cassou, C. and co-authors. 2009. Why the western Pacific subtropical high has extended westward since the Late 1970s. J. Clim. 22, 2199–2215. doi:https://doi.org/10.1175/2008JCLI2527.1