
 ?Mathematical formulae have been encoded as MathML and are displayed in this HTML version using MathJax in order to improve their display. Uncheck the box to turn MathJax off. This feature requires Javascript. Click on a formula to zoom.
Abstract
Drought monitoring and forecasting play a vital role in making drought mitigation policies. In previous research, several drought monitoring tools based on the probabilistic models have been developed for precise and accurate inferences of drought severity and its effects. However, the risk of inaccurate determination of drought classes always exists in probabilistic models. The aim of this paper is to reconnaissance the advantage of the weighted Markov chain (WMC) model to accommodate the erroneous drought classes in the monthly classifications of drought. It was assumed that to increase the precision in drought prediction, the role of standardised self-correlation coefficients as weight may incorporate to establish and restructure the accurate probabilities of risk for incoming expected drought classes in the WMC framework. Consequently, the current research is based on the experimental findings of seventeen meteorological stations located in the Northern Areas of Pakistan. In this study, the standardised precipitation evapotranspiration index (SPEI) at a 1-month time scale based drought monitoring approach is applied to quantify the historical classification of drought conditions. The exploratory analysis shows that the proportion of each drought class varies from zone to zone. However, a high proportion of near-normal drought classes has been observed in all the stations. For the prediction of future drought classes, transition probability matrices have been computed using R statistical software. Our findings show that the probability of occurrences of near-normal is very high. Overall, the results associated with this study show that the WMC method for drought forecasting is sufficiently flexible to incorporate the change of drought conditions; it may change both the transition probability matrix and the autocorrelation structure.
1. Introduction
Drought, the highest-ranked natural hazard, is the primary source of severe destructive effects on the planet (White, Citation1974). Its sustained consequences lead to the sterilisation of agricultural land and the initiation of diseases. Factors associated with a higher risk of drought are the long duration of rainfall, high rate of evapotranspiration, low relative humidity, high temperature, and high wind speed (Edwards et al., Citation2009). Moreover, many other environmental and ecological factors are also responsible for the recurrent occurrences of drought hazard. However, drought intensity, duration, and severity may vary from region to region. In recent decades, almost all the developing countries are facing water shortage due to continued expansion in agriculture, industrial, and energy sectors. Consequently, a perpetual increase in the difference between water demand and renewable freshwater resources will lead to significant social and economic issues.
However, to overcome the severe effect of the frequent occurrence of drought, forecasting plays a significant role in drought mitigation policies. In previous research, several forecasting and assessment tools for the characterisation of drought regions and the quantification of drought risk have been established. Several studies have been conducted in the field of hydrology and climatology for the assessment and modelling of drought classes for different regions in the world. Drought indices are one of the most used tools for the assessment and quantification of drought risk. A range of different drought indices involving different climatic parameters has been developed to detect dry and wet categories of a region for a specified time. Details on the list of drought indices corresponding with their variable requirement can be found in Svoboda et al. (2016).
Besides drought monitoring and assessment tools, several probabilistic and deterministic forecasting models have been developed and used to predict and forecast drought classes for various climatological regions. In recent decades, the rapid increase in the development of theories associated with the stochastic process is found for modelling many real-life uncertain phenomena. An example includes, stock market and exchange rate fluctuations; signals such as speech; audio and video; medical data such as a patient's EKG, EEG, blood pressure or temperature; and random movements, such as Brownian motion or random walks. Among several other stochastic models, the theory of Markov chains is a promising approach to dynamic model activities that have a stochastic factor (Lange, Citation2010). To model uncertain events, especially in the field of engineering (Takahashi et al., Citation2007), economics (Lee and Chen, Citation2006), and physics (Crommelin and Vanden-Eijnden, Citation2006), Markov chain models play a significant role in the prediction and forecasting of the probabilities associated with such events. Markov chain models can be useful for forecasting future drought classes due to their multifaceted nature to enumerate uncertainties connected with hydro-meteorological variables causing droughts.
Sen (Citation1990) derived stationary second-order Markov chains for finite sample lengths for exact probability distribution functions (PDF) for three representative annual flow series from various regions of the globe. Lohani and Loganathan (Citation1997) used non-homogeneous Markov chain models to characterise the random behaviour of droughts using the Palmer Drought Severity Index. Paulo and Pereira (Citation2007) used Markov Chain models on the drought classes determined by the SPI drought index to characterise the stochasticity of drought and predict three months of drought class. Bacanli et al. (Citation2009) used the SPI drought index based on an Adaptive Neuro-Fuzzy Inference System (ANFIS) forecasting drought. Ali et al. (Citation2017b) used a multilayer perceptron model and SPEI drought index for drought forecasting in the Northern Area and KPK.
However, it is difficult to adjust the transition probability matrix and the precision of the forecast that is affected by objective factors. To overcome this problem, in many applications Weighted Markov Chain (WMC) method have been employed in several disciplines, including hydrology and environmental sciences (Benoit, Citation2005; Le-Tian, Citation2005; De-di and Chen, Citation2006; Peng et al., Citation2010; Kaliakatsos-Papakostas et al., Citation2011; Zhou et al., Citation2011; Chen and Yang, Citation2012; Gong et al., Citation2014; Gui and Shao, Citation2017). Chen and Yang (Citation2012) proposed a drought prediction model for SPI with different time scales under the weighted Markov chain framework for Anhui Province of Huaihe River in China. Outcomes associated with this model show that the weighted Markov Chain method is a useful approach for drought prediction, and it can be helpful for decision-making in regional drought management. In recent years, we have proposed a new weighting scheme of WMC for ordinal data (see Ali et al., Citation2018). In this article, the Standardised Precipitation Temperature Index (SPTI) (Ali et al., Citation2017) has been used to evaluate the proposed scheme.
However, analysing droughts by using a single variable is not enough to distinguish different regions because drought hazards relate to multiple variables. A comprehensive analysis of the characterisation of drought classes is required that make a joint analysis of rainfall, runoff, and soil moisture conditions (Vicente-Serrano et al., Citation2005). The SPI is the simplest and commonly used drought index that is based on accumulated precipitation (McKee et al., Citation1993). Vicente-Serrano et al. (Citation2010) developed a new multi-scaler drought index, the standardised precipitation evapotranspiration index (SPEI). The methodological structure of SPEI is like SPI. However, in SPEI, instead of only precipitation, the mean monthly temperature is also used in the estimation of drought classes.
The objective of this research is to handle all the difficulties in formulating a mathematical model for forecasting SPEI drought index at a one-month time scale under the WMC framework in various regions of Pakistan. We use autocorrelations from the historical series of SPEI drought index with a one-month time scale as a weight in first-order Markov chain transition probability matrices to forecast the next incidence of drought categories for seventeen meteorological stations located in the Northern Areas and KPK (Pakistan). The drought has become a recurrent phenomenon in the country. In the recent decade, due to severe drought hazards, the economic system of the country was severely disturbed. In recent decades, several authors had been working to explore the geographical and hydrological importance of this region. Awan (Citation2002) and Archer and Fowler (Citation2004) explored and inferred different climatic variables in terms of regression, spatial correlation, and temporal variation. Ahmad et al. (Citation2012) evaluated the significance of these mountainous areas that have substantial potential in hydro-power production and water resources. Ali et al. (Citation2017a) have compared the performance of SPTI with SPI and SPEI using time series data on precipitation and temperature of these stations.
In this research considered seventeen meteorological stations having different climatology and estimated historical time series data on SPEI drought index for a one-month time scale. Time series data on precipitation and temperature are used to estimate SPEI values for these stations.
The organisation of this paper is as follows. A brief description of the study area, the estimation method of SPEI, and the mathematical formulation of WMC method is presented in Section 1. Section 2 consists of temporal representations of SPEI drought classes and results associated with WMC based forecasting. Section 3 is based on the results of this paper. In contrast, discussion and conclusion have been presented in Sections 4 and 5, respectively.
2. Materials and methods
2.1. Study area and data
We consider seventeen meteorological stations located in different climatic regions of Northern Areas of Pakistan. These stations have high variability in rainfall throughout the season. Concerning the climatological statistics (see ), the behaviour of all stations varies from zone to zone.
Table 1. Summary statistics of the selected stations.
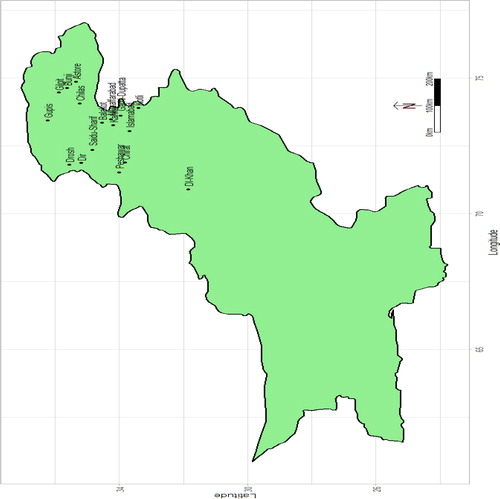
In each season, some of the stations are continuing to bear extremely vulnerable drought conditions. In the current research, twelve meteorological stations exhibiting cold and humid climate and five meteorological stations having mild cold and arid climate are included to check the efficiency of SPEI drought index from the global warming perspective. Primary data on monthly total rainfall, mean minimum temperature, and mean maximum temperature of each station for the period 1976–2017 were collected from the Karachi data processing center through Pakistan Meteorological Department (PMD), Islamabad. shows the geographical distribution of the study area located in different climatological zones.
Figure 1. Study area: meteorological stations of Northern Area and KPK (Pakistan).
2.2. Standardised precipitation evapotranspiration Index-SPEI
There are several procedures to report drought severity using a multiscalar drought index (Ali et al., Citation2017a). McKee et al. (Citation1993) developed an SPI drought index, which is based on long-term precipitation records to quantify precipitation scarcity for different time scales. One of the significant advantage of using the SPI index is that it can be used to monitor drought for various time scales. Vicente-Serrano et al. (Citation2010) developed the standardised precipitation evapotranspiration index (SPEI): a multiscalar drought index. In SPEI, the water balance model based on the difference between precipitation and potential evapotranspiration (PET) is used with a similar estimation procedure of SPI. One significant advantage of SPEI over SPI is to include the effect of evaporation in rainfall data to characterise the regions under study. The method employed in SPEI drought index for the determination of drought classes is a little bit different from SPI. SPEI uses both temperature and precipitation for the characterisation of drought classes, whereas, in the SPI drought index, only monthly cumulative precipitation data is used. In SPEI drought index, monthly time series data on drought classes is obtained by standardising the distribution of the difference between precipitation and Potential Evapotranspiration (PET). Several methods are available in the literature for the estimation of PET. The choice of the method for the estimation of PET depends on the availability of data and the sensitivity of the PET values. In their original paper, Vicente-Serrano et al. (Citation2010) had chosen the simplest approach to calculate PET by using Thornthwait (TH) equation (Thornthwaite Citation1948).
However, this method underestimates PET values at arid regions in cold climatic regions, whereas overestimates PET values in humid regions (Ali et al., Citation2017a). The Hargreaves method for the estimation of PET overcomes this issue. However, it needs additional climatic parameters (i.e. mean minimum and mean maximum temperature etc.) (Hargreaves, Citation1994). In this research, we use the Hargreaves method for the estimation of PET based on minimum mean and minimum-maximum temperature using SPEI package in R. Further detailed procedures on computation, temporal behaviour, and normality test on SPEI time series data can be found in Ali et al. (Citation2019).
2.3. Markov chain
A stochastic process, or random process {Z = Z(t), t ε T} is a set of random variables indexed by time. That is, for all t in the index set T, Z(t) is a random variable. If the index set T is a countable set, we call Z(t) a discrete-time stochastic process. If T is a straight-set, we call Z(t) a continuous-time stochastic process. All possible values that Z(t) can assume, are called its state space (Chiang, Citation1968). A Markov chain is a stochastic process having the property that the value of the process at time t, Zt depends only on its previous value Zt−1 at time t − 1, but does not depend on the past values of the process (Haan, Citation1977).
2.3.1. Drought conditions as a Markov chain process
A discrete Markov chain is a random process that describes a sequence of events from a set of finite possible states. In contrast, the current event depends only on the preceding event. It has been commonly used to model uncertain events in various disciplines. Each discrete Markov chain is characterised by a transition probability matrix that represents the probability of transition from one state to another. Shatanawi et al. (Citation2013) reported that the exact prediction of Drought Index (DI) values is impossible with ARIMA models. However, early warning of drought can be detected from monthly Markov transition probabilities. Therefore, in drought modelling context, time-series data SPTI drought classes for a single station can be considered as a sequence of ordinal drought classes.
Consequently, a historical series of drought classification states for a specified station can be embodied as a discrete Markov chain process. Here, we assume that any single class of drought in time series of SPEI depends on its previous class and then proceed to the construction of the transition probability matrix. It is just statistical compliance that allows us to consider each drought class as a first-order Markov chain. However, one can also use a second-order Markov chain, where if each class is assumed to depend on its previous two classes.
2.3.2. Configuration of weighted Markov chain (WMC) for observed drought classes
In this scenario, time-series data on drought classes determined by SPEI drought index can be assumed as a series of correlated random variables. Various empirical studies show that self-correlation coefficients in the historical data of drought classes for all the study regions have significant importance for the prediction of future drought classes. This confirms that previous drought classes (on a monthly or yearly basis) can be considered in advance to predict the present drought class. So, in our case, the basic idea behind using WMC is that weighted averages can be made according to the incidence behaviour in the past month. Hence, the probability of present or next drought classes can be inferred and predicted in advance by appropriate configuration of weights to each drought class in WMC framework.
The fundamental steps involved in the proposed method for prediction of drought classes using SPEI drought index under the WMC model are given below.
2.3.2.1. Classification quantitative values of SPEI for transition probability matrix
Let D1, D2, …, Dn be the time series of drought classes. Where D can assume the nominal value droughts classes depending on the classification criteria of SPEI drought index (see ). As in each drought class, we can find the transition probability matrix in the following form:
Drought Classes
where, c1, c2,…, cn are the drought classes, i.e. too wet, very wet,…, extremely dry.
Table 2. Classification criteria SPEI.
In this step, we classify SPEI drought index estimated with a one-month time scale according to the classification criteria provided in . Descriptions on the classification states for drought classes determined by SPEI drought index were shown in .
Transition probability matrices for each station are computed using the Markovchain package to predict the future drought classes (Spedicato et al., Citation2016) package of R.
2.3.2.2. Construction of the transition probability matrix
Let the number of transitions from the state Si to state Sj through t steps in time series length of drought classes Xk calculated from a one-month time scale. Here, the transition probabilities for various time steps and various drought classes are computed using the following equation.
(6)
(6)
where
is the total number of individual drought classes, t represents the order of Markov chain. Further, the transition probability matrix for various drought classes can be obtained as;
(7)
(7)
Transition probability matrices for Astore and Balakot stations from the time series data on drought classes determined by SPEI drought index are shown in .
Table 3. One step transition probability matrix.
2.3.2.3. Computation weights using autocorrelations
The weights () for the weighted Markov chain model can be computed by standardising the self-correlation coefficient (
). The formula for weights (
) and self-correlation coefficient (
) are provided in EquationEqs. (8)
(8)
(8) and Equation(9)
(9)
(9) , respectively.
(8)
(8)
(9)
(9)
2.3.2.4. Prediction of the probability of the occurrence of a drought class using weighted Markov chain
In this step, we assume the occurrence of drought classification states in the very last month as an initial drought class Ψi and combine it with the row vectors of their corresponding transition probability matrix. Here, we assumed that the inaccurate drought class is probable due to the estimation of SPEI time series data. Hence, weighting the drought classes according to EquationEq. (10)(10)
(10) , we arrive at the prediction probabilities Pi for the next drought classes.
(10)
(10)
In the above equation are the weighted probabilities for incoming drought events. However, the predicted drought class is the drought class having max {Pi, i ε S} under the weighted Markov Chain method.
3. Results
For exploratory analysis, the percentage of occurrences of various drought classes in the historical time series data on SPEI-1 with a one-month time scale of the selected study regions are presented in . A high proportion of near-normal drought classes were found in most of the stations. Moreover, the test of equality of proportions, as suggested in Marden (Citation1996), is performed using easyanova Arnhold (Citation2014) package in R.
Table 4. Percentage frequencies of drought class.
Additionally, multiple comparison tests show that the near-normal drought class has a significantly high proportion as compared to other drought classes. However, the severely dry drought class has a significant difference from the severely wet class. Besides, the proportion of the moderate dry class is significantly greater than for moderate wet.
Here, transition probability matrices are used for further prediction of future drought classes using Equationequation 10(10)
(10) . Weights from step one to step five associated with each station are shown in . These weights are calculated by normalising autocorrelation coefficients (see EquationEq. (7)
(7)
(7) ). shows the predicted probabilities for each drought class in December 2017 for Astore station. For the near-normal drought class, the predicted probability of this class using the weighted Markov chain is 0.712, which is very high concerning other drought classes. The actual drought condition is also near to normal, which indicates that the prediction is correct, and the chance of errors is very low. On the same line, the interpretation can be made for the rest of the months and stations as well. One month ahead prediction probabilities of the drought classes for the rest of the stations are shown in . Except for Drosh and Peshawar, the probabilities of near-normal drought categories are very high in all the stations. It is due to the high frequency of near-normal drought classes in the qualitative vectors of drought classes in all stations.
Table 5. Standardised weights of transition from one state to another stat.
Table 6. Predicted probabilities for the month of December 2017 at Astore.
Table 7. One month ahead forecast probabilities of various drought classes.
4. Discussion
Results associated with this test show that there is a significant difference in the proportion of each drought class. These results are consistent from the ecological and climatological point of view since, in these areas, most of the stations bear longer Moonsoon and precipitation periods. In most stations, near-normal drought class found a high probability of occurrences. However, the moderate wet drought class has a low probability as compared to a severely dry drought class. However, the near-normal drought class has a high probability in most of the study region. However, predicted probabilities for each drought class in Peshawar, Bunji, and Drosh have somehow different behaviour. In Peshawar, drought classes have almost equal probabilities except for the Severely dry class. Bunji shows a 0.533 probability of occurrence for the severely dry class. In Drosh station, almost equivalent probabilities are found for near normal and moderate wet.
5. Conclusion
Prediction and forecasting play a vital role, especially in early warning situations. Consequently, accurate and precise techniques of drought forecasting may reduce their severe effect by making effective drought mitigation policies. In this article, the SPEI-1 drought index being a more comprehensive drought monitoring procedure is used to classify historical monthly drought profile for seventeen meteorological stations of Pakistan. To predict the future drought classes, the standardised self-correlation coefficient in the time series data of SPEI-1 index is used as weights in WMC method (see ). Outcomes associated with the WMC method for prediction of drought classes show that this forecasting method is flexible enough to incorporate change of drought condition, just by changing the transition probability matrix and the autocorrelation structure. It is observed that the probability of the near-normal drought class is higher in most stations of the study area (see ). Further, in a global warming context, the situation of a significant increase in trend from wet drought classes to dry drought classes should be alarming for water resources and management authorities.
The limitation of the study includes:
The current study is based on SPEI index. Other indices such as SPI and SPEI can be incorporated. Further, their comparative assessment should be made for better understanding.
In this manuscript, we have used quantitative time-series data. Consequently, our weights are based on autocorrelation. In the future, the qualitative time series of drought can be used with our novel weighting scheme for WMC (see Ali et al. Citation2018).
Additional information
Funding
References
- Ali, Z., Hussain, I., Faisal, M., Nazir, H. M., Hussain, T. and co-authors. 2017. Forecasting drought using multilayer perceptron artificial neural network model. Adv. Meteorol. 2017, 1–9. doi:10.1155/2017/5681308
- Ahmad, Z., Hafeez, M. and Ahmad, I. 2012. Hydrology of mountainous areas in the Upper Indus Basin, Northern Pakistan with the perspective of climate change. Environ. Monit. Assess. 184, 5255–5274. doi:10.1007/s10661-011-2337-7
- Ali, Z., Hussain, I., Faisal, M., Almanjahie, I. M., Ahmad, I. and co-authors. 2019. A probabilistic weighted joint aggregative drought index (PWJADI) criterion for drought monitoring systems. Tellus. Dyn. Meteorol. Oceanogr. 1–21.
- Ali, Z., Hussain, I., Faisal, M., Almanjahie, I. M., Ismail, M. and co-authors. 2018. A new weighting scheme in weighted Markov model for predicting the probability of drought episodes. Adv. Meteorol. 2018, 1–10. doi:10.1155/2018/8954656
- Ali, Z., Hussain, I., Faisal, M., Nazir, H. M., Abd-el Moemen, M. and co-authors. 2017. A novel multiscalar drought index for monitoring drought: the standardized precipitation temperature index. Water Resour. Manage. 31, 4957–4969. doi:10.1007/s11269-017-1788-1
- Archer, D. R. and Fowler, H. J. 2004. Spatial and temporal variations in precipitation in the Upper Indus Basin, global teleconnections and hydrological implications. Hydrol. Earth Syst. Sci. 8, 47–61. doi:10.5194/hess-8-47-2004
- Arnhold, E. 2014. Easyanova: analysis of variance and other important complementary analyzes. R package version, 4.
- Awan, S. A. 2002. The climate and flood risk potential of northern areas of Pakistan. Science Vision 7, 100–109.
- Bacanli, U. G., Firat, M. and Dikbas, F. 2009. Adaptive neuro-fuzzy inference system for drought forecasting. Stoch. Environ. Res. Risk Assess. 23, 1143–1154. doi:10.1007/s00477-008-0288-5
- Benoit, G. 2005. Weighted Markov chains and graphic state nodes for information retrieval. Proc. Am. Soc. Info. Sci. Tech. 39, 115–123. doi:10.1002/meet.1450390113
- Chen, J. and Yang, Y. 2012. SPI-based regional drought prediction using weighted Markov chain model. Res. J. Appl. Sci. Eng. Technol. 4, 4293–4298.
- Chiang, C. L. 1968. Introduction to Stochastic Processes in Biostatistics, Vol. 95. Wiley, New York.
- Crommelin, D. and Vanden-Eijnden, E. 2006. Fitting timeseries by continuous-time Markov chains: a quadratic programming approach. Comput. Phys. 217, 782–805. doi:10.1016/j.jcp.2006.01.045
- De-di, L. and Chen X.-H. 2006. Annual precipitation forecasting based on the weighted Markov chain in Beijing River Basin. Journal of China Hydrology 6, 006.
- Edwards, B., Gray, M. and Hunter, B. 2009. A sunburnt country: the economic and financial impact of drought on rural and regional families in Australia in an era of climate change. Aust J Labour Econ. 12, 109.
- Gong, Z., Chen, C. and Ge, X. 2014. Risk prediction of low temperature in Nanjing city based on grey weighted Markov model. Nat. Hazards 71, 1159–1180. doi:10.1007/s11069-013-0690-2
- Gui, Y. and Shao, J. 2017. Prediction of precipitation based on weighted Markov chain in Dangshan. In Proceedings of the International Conference on High Performance Compilation, Computing and Communications, ACM, 81–85.
- Haan, C. T. 1977. Statistical Methods in Hydrology. The Iowa State University Press, Iowa.
- Hargreaves, G. H. 1994. Defining and using reference evapotranspiration. J. Irrig. Drain. Eng. 120, 1132–1139. doi:10.1061/(ASCE)0733-9437(1994)120:6(1132)
- Kaliakatsos-Papakostas, M. A., Epitropakis, M. G. and Vrahatis, M. N. 2011. Weighted Markov chain model for musical composer identification. In European Conference on the Applications of Evolutionary Computation, Springer, 334–343.
- Lange, K. 2010. Numerical Analysis for Statisticians. Springer, Berlin.
- Lee, H.-Y. and Chen, S.-L. 2006. Why use Markov-switching models in exchange rate prediction? Econ. Model. 23, 662–668. doi:10.1016/j.econmod.2006.03.007
- Le-Tian, X. 2005. Prediction of plum rain intensity based on index weighted Markov chain. J. Hydraul. Eng. 8, 988–993.
- Lohani, V. K. and Loganathan, G. 1997. An early warning system for drought management using the palmer drought index1. JAWRA Journal of the American Water Resources Association, 33, 1375–1386.
- Marden, J. I. 1996. Analyzing and Modeling Rank Data. CRC Press, Boca Raton.
- McKee, T. B., Doesken, N. J. and Kleist, J. 1993. The relationship of drought frequency and duration to time scales. In Proceedings of the 8th Conference on Applied Climatology, Vol. 17, American Meteorological Society Boston, MA, pp. 179–183.
- Paulo, A. A. and Pereira, L. S. 2007. Prediction of SPI drought class transitions using Markov chains. Water Resour. Manage. 21, 1813–1827. doi:10.1007/s11269-006-9129-9
- Peng, Z., Bao, C., Zhao, Y., Yi, H., Xia, L. and co-authors. 2010. Weighted Markov chains for forecasting and analysis in incidence of infectious diseases in Jiangsu Province. J. Biomed. Res. 24, 207–214. doi:10.1016/S1674-8301(10)60030-9
- Sen, Z. 1990. Critical drought analysis by second-order Markov chain. J. Hydrol. (Amsterdam) 120, 183–202. doi:10.1016/0022-1694(90)90149-R
- Shatanawi, K., Rahbeh, M. and Shatanawi, M. 2013. Characterizing, monitoring and forecasting of drought in Jordan River Basin. JWARP. 05, 1192–1202. doi:10.4236/jwarp.2013.512127
- Spedicato, G. A., Kang, T. S., Yalamanchi, S. B. and Yadav, D. 2016. The Markovchain package: package for easily handling discrete Markov chains in r. Accessed Dec.
- Svoboda, M. and Fuchs, B. 2016. Handbook of Drought Indicators and Indices. Integrated Drought Management Tools and Guidelines Series. World Meteorological Organization, National Drought Mitigation Center, University of Nebraska-Lincoln, Nebraska-Lincoln.
- Takahashi, K., Morikawa, K., Takeda, D., Mizuno, A. 2007. Inventory control for a Markovian remanufacturing system with stochastic decomposition process. Int. J. Prod. Econ. 108, 416–425. doi:10.1016/j.ijpe.2006.12.023
- Thornthwaite, C. W. 1948. An approach toward a rational classification of climate. Geogr. Rev. 38, 55–94. doi:10.2307/210739
- Vicente-Serrano, S. M., Beguería, S. and López-Moreno, J. I. 2010. A multiscalar drought index sensitive to global warming: the standardized precipitation evapotranspiration index. J Clim. 23, 1696–1718. doi:10.1175/2009JCLI2909.1
- Vicente-Serrano, S. M., Lo'pez-Moreno, J. I. and Van der Hurk, B. 2005. Hydrological response to different time scales of climatological drought: an evaluation of the standardized precipitation index in a mountainous Mediterranean basin. Hydrol. Earth Syst. Sci. 9, 523–533.
- White, G. F. 1974. Natural Hazards, Local, National, Global. Oxford University Press, Oxford.
- Zhou, P., Zhou, Y., Jin, J., Liu, L., Wang, Z. and co-authors. 2011. An improved Markov chain model based on autocorrelation and entropy techniques and its application to state prediction of water resources. Chin. Geogr. Sci. 21, 176–184. doi:10.1007/s11769-011-0447-3