
 ?Mathematical formulae have been encoded as MathML and are displayed in this HTML version using MathJax in order to improve their display. Uncheck the box to turn MathJax off. This feature requires Javascript. Click on a formula to zoom.
Abstract
Iran and Iraq face a water shortage crisis especially in the recent decade. Hence, the regions with high potential water resources are highly important to these countries. Precipitation sampling for 18O and 2H analyses was conducted in 10 stations in the west of Iran and 2 stations in the east of Iraq during this study. Studying precipitation and its moisture sources using the backward trajectories of the HYSPLIT model, developing seasonal meteoric water lines (MWLs), and simulating the spatial variations of stable isotopes in precipitation using stepwise regression yielded valuable results regarding the hydrometeorology of the study region. The precipitation moisture sources in the study region were determined using the backward trajectories of the HYSPLIT model. These backward trajectories demonstrated the domination of various moisture sources including the Mediterranean Sea, the Black Sea, the Red Sea, and also the Persian Gulf in different seasons as reflected in the seasonal MWLs. In addition to moisture sources, the effects of meteorological parameters (temperature and precipitation amount) on the stable isotope content of precipitation also showed a notable correlation (with R2 = 0.58 and 0.46, respectively). Surface water resources were also plotted on the developed seasonal MWLs, while some samples deviated from seasonal MWLs due to the evaporation effect.
1. Introduction
Since 1961 when Harmon Craig stated that 18O and 2H in the water molecules of fresh water resources have a close correlation (Craig, Citation1961), the stable isotope technique has been increasingly used as a reliable tracer in hydrological, hydrogeological, and hydro-meteorological studies (Clark and Fritz, Citation1997; Kurita et al., Citation2004; Kohn and Welker, Citation2005; Lachniet and Patterson, Citation2009; Kumar et al., Citation2010; Soderberg et al., Citation2013; Huang and Wen, Citation2014; Wei et al., Citation2016; Xu et al., Citation2018; Mohammadzadeh and Heydarizad, Citation2019). The application of the stable isotope technique in precipitation, as one of the most important parts of water resources studies, is influenced by different parameters. Moisture origin (Sjostrom and Welker, Citation2009; Breitenbach et al., Citation2010; Liu et al., Citation2010; Lykoudis et al., Citation2010; Crawford et al., Citation2013; Krklec et al., Citation2018; Rao et al., Citation2018; Tanoue et al., Citation2018; Boschetti et al., Citation2019; Juhlke et al., Citation2019; Kong et al., Citation2019; Mohammadzadeh and Heydarizad, Citation2019) precipitation amount (Kurita et al., Citation2004; Lachniet and Patterson, Citation2009), latitude (Dotsika et al., Citation2010), altitude (Gonfiantini et al., Citation2001; Guan et al., Citation2009; Kumar et al., Citation2010; Windhorst et al., Citation2013; Vespasiano et al., Citation2015), and temperature (Kohn and Welker, Citation2005; Lachniet and Patterson, Citation2009) mainly control the 18O and 2H contents in precipitation. Among these parameters, the moisture sources of precipitation affect the stable isotopes in precipitation much more than the other parameters (Mohammadzadeh and Heydarizad, Citation2019).
Developing the local meteoric water line (LMWL) is the first step in isotope studies as it is needed for comparing water resources (groundwater and surface water resources) with the local precipitation (Heydarizad, Citation2018). In Iran, a few studies (including Mohammadi et al., Citation2007; Faroughi, Citation2008; Heydarizad, Citation2011; Mohammadzadeh and Ebrahimpour, Citation2012; Jahanshahi, Citation2013; Osati et al., Citation2014; Kazemi et al., Citation2015; Mohammadzadeh and Heydarizad, Citation2019) have been done to develop the LMWL of Fars Province, Tehran, Sirjan, Shahroud, Khersan, Mashhad, Marivan, and the west of Zagros, respectively. These MWLs are only applicable to a small part of Iran. The moisture sources of the precipitation events and also the seasonal effect were not considered in any of these studies. To study the moisture sources of precipitation events, the backward trajectories developed by the Hybrid Single Particle Lagrangian Integrated Trajectory (HYSPLIT) model is mainly used (Mohammadzadeh and Heydarizad, Citation2019).
In addition to MWLs, the spatial distribution maps of stable isotopes in precipitation also have a great role in isotope studies. The initial maps of isotopes in precipitation used inverse distance-weighted (IDW) approaches, however, later on, multiple regression and more sophisticated interpolation models were presented (Terzer et al., 2013). The Bowen and Wilkinson model (BW) is the most important multiple regression model which uses the fixed predictive variables of absolute latitude, squared latitude, and altitude optimized by an interpolation parameter so as to obtain the best fitting model (Terzer et al., 2013). In recent studies on developing isotope maps, multiple regression and GIS-based interpolation methods have been used as predictive indicators in both global (Bowen and Revenaugh, Citation2003; Van der Veer et al., Citation2009; Terzer et al., Citation2013) and regional (Longinelli and Selmo, Citation2003; Delavau et al., Citation2015; Sánchez-Murillo et al., Citation2013) scales.
Iran and Iraq are semi-arid and arid countries and have faced water shortage crisis from early times. The water shortage crisis has increased in the recent decade due to the population growth and the recent long droughts. Therefore, water resources studies are very crucial for these regions. The study region is one of the most important water zones for both Iran and Iraq. Iran and Iraq have a special view toward this region due to its higher annual precipitation compared to the average annual precipitation in these countries. This region is the origin for some of the main rivers in Iran and Iraq such as Karkheh, Dez, Diyala, Upper Zab, Lower Zab, and Karoun. Although this region has a great role in providing water supply for both countries, few studies have been done on it (the west of Iran (Osati et al., Citation2014) and the east of Iraq (Ali et al., Citation2015)). Comprehensive stable isotope studies on water resources are highly crucial for further meteorological and hydrological studies in this region. This study aims to determine the main moisture sources for precipitation in the west of Iran and the east of Iraq and to investigate the stable isotopes of local precipitation including developing the seasonal MWLs and the distribution maps of stable isotopes in this region. Finally, the stable isotopes in the main surface water resources in this region have been plotted on and compared with the developed seasonal MWLs.
2. The study area
The study area, the locations of the sampling stations, and the trajectories of the main air masses influencing the study region are shown in . Nine meteorological stations including Eslam Abad Gharb (EAG), Ghasr-e-Shrin (GSh), Kangavar (Kan), Krend (Krd), Kermanshah (KSh), Paveh (PV), Ravansar (RS), Sarpol-e-Zehab (SPZ), and Sumar (Sum) in Kermanshah province, one station in Marivan (MAR) in Kurdistan province (Mohammadzadeh and Ebrahimpour, Citation2012), and two stations in the neighboring regions in Diyala (DYL) and Sulmaniyia (SOL) in Iraq (Ali et al., Citation2015) were selected to study the stable isotope (18O and 2H) characteristics of precipitation in the west of Iran and the east of Iraq. Zagros mountain ranges cover most of the study area making its climate milder with a higher amount of annual precipitation compared to the average annual precipitation of Iran (Alijani, Citation2000). The amount of annual average precipitation according to the meteorological stations in Sanadaj, Kermanshah, Ilam, Marivan, Paveh, Ghasreh Shirin, and Dareh Shahr in the west of Iran is around 570 mm. The mean monthly temperatures vary from about 30.3 °C in August to about 5.3 °C in December (Mohammadzadeh and Eskandari, Citation2018). presents a summary of the climatic parameters in the stations in the west of Iran. According to previous studies (Alijani, Citation2000; Barati and Heydari, Citation2003), the Mediterranean and the continental tropical (also known as the Sudan) air masses are the dominant air masses and the Mediterranean and the Arabian Seas are the main moisture uptake sources for the west of Iran and the east of Iraq. In addition, the land use map of the study region is presented in . The land use map shows large variations across the study area. Agricultural lands and forests cover large parts of the study area. Local forests cover the west, southwest, and northwest parts of the study area. On the other hand, pastures and dry farms also cover large parts of the study region. In addition to these dominant land use types, rock coverage, urban areas, bare lands, and water bodies (streams and wet lands) cover small parts of the study region.
Fig. 1. The main air masses influencing Iran and Iraq and their directions (a) and the precipitation sampling points in the study region (b).
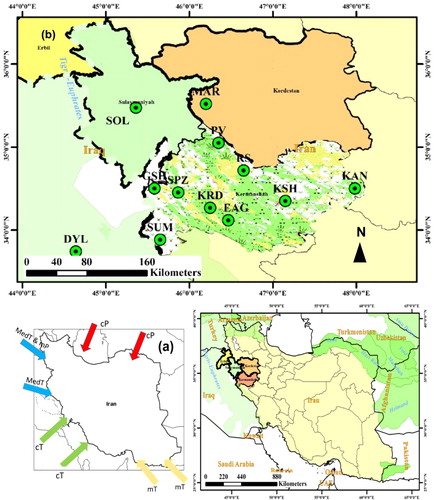
Fig. 2. The land use map of the study region.
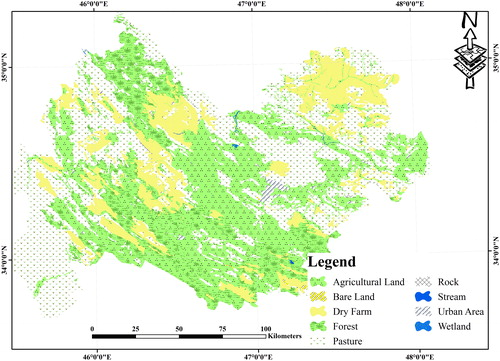
Table 1. The meteorological characteristics of the west of Iran (based on the data of the meteorological stations in Sanadaj, Kermanshah, Ilam, Marivan, Paveh, Ghasreh Shirin, and Dareh Shahr).
3. Materials and methodology
The moisture sources of precipitation in the study region were determined using the backward trajectories of the HYSPLIT model (NOAA, Citation2018a, Citation2018b, Citation2018c). Temperature, wind speed, pressure, and solar radiation are the main inputs of the HYSPLIT model (Stein et al., Citation2015). In this study, the web-based version of the HYSPLIT model (READY) which is free of charge was used. In this study, the backward trajectories of the HYSPLIT model have been developed from December 2011 to March 2012 and from March 2015 to December 2015 in three different elevations of 500, 1500, and 2500 masl. According to previous studies (Karimi and Farajzadeh, Citation2011; Heydarizad, Citation2018), most of Iran’s precipitation moisture enters the country at these elevations. The backward trajectories developed by the HYSPLIT model were run for 240 hours/10 days which is the average residence time of moisture in the atmosphere (Numaguti, Citation1999). The regions where humidity decreased were considered as moisture sinks, while the zones where humidity increased at each elevation were considered as moisture source regions.
The GNIP procedure was used to sample precipitation for stable isotope analyses. Precipitation sampling was done in several meteorological stations in the west of Iran and the east of Iraq from 2011 to 2015 (). The precipitation sampling sites were synoptic weather stations run by the personnel 24 h/7d. To collect precipitation samples, after each precipitation event, the rain gauges were emptied immediately into monthly bottles (1 L air-tight high-density polyethylene bottles capable of minimizing the influence of evaporation). As the water content of the collectors was directly emptied into the monthly bottles right after the precipitation, no additional substances such as paraffin were used. In addition, the rain gauges were also highly resistant to evaporation and were also capable of measuring the amount of precipitation (). At the end of each month, 30 mL isotope bottles for each sampling station were filled with precipitation water from the monthly bottles.
Fig. 3. The schematic picture of a rainwater collector and the procedure for sampling the stable isotopes.
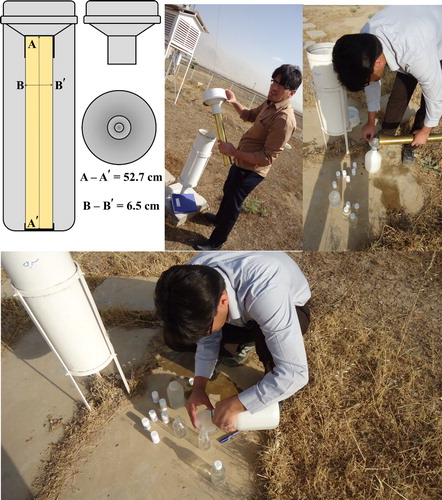
Table 2. The variations of precipitation, temperature, δ18O, δ2H, and d-excess in the studied stations in Iran and Iraq.
The stable isotopes (18O and 2H) in the precipitation samples in the west of Iran were analyzed in the University of Waterloo-Environmental Isotope Laboratory (UW-EIL) and G.G. Hatch Stable Isotope Laboratory of Ottawa University in Canada using a Los Gatos Research (LGR) and a Delta-Plus XP isotope ratio mass spectrometer (IRMS) (Thermo Finnigan, Germany). All the data were reported as δ values on the VSMOW standard scale and were given as parts per thousand (per mil, ‰) with the analytical standard uncertainties of ±0.1‰ and ±1‰ for δ18O and δ2H, respectively. The stable isotopes were used to develop seasonal and total MWLs for the study region. To investigate the effects of the seasonal variations of precipitation amount on feeding surface water resources, the δ18O and δ2H contents in Zarivar lake and some of the rivers in the study region were also used.
To investigate the effects of the meteorological parameters (temperature and precipitation amount) on the stable isotope content of precipitation, the ANCOVA test has been used. The ANCOVA test is very similar to the ANOVA test, however, the ANCOVA test also takes the effect of covariate variables into account (a covariate is a variable which has an influence on the dependent variable/variables). Each parameter in the ANCOVA test should meet two conditions. First, it should have the needed requirements to be considered as a covariate variable. Second, it should have homogeneity of regression.
To simulate the spatial variations of δ18O and δ2H in the study region, geographical parameters (including longitude, latitude, and altitude) and meteorological parameters (including the amount of monthly precipitation and temperature data) were considered as independent variables. Then, the correlation of the independent variables with the monthly values of δ18O and δ2H in each station was evaluated using multiple stepwise regression. This is a statistical technique applied in order to fit a linear equation between a dependent variable and several predicted variables (Lachniet and Patterson, Citation2006) as described in Equationequation 1(1)
(1) :
(1)
(1)
where Y is the predicted variable, β0 to βn are partial regression coefficients, X1 to Xn are independent variables, and ε is the error term that describes the variations of Y which cannot be explained by a linear model. In this model, the independent variables are gradually entered into the equation in order to determine their significance in the regression model and to decide whether they should be removed from the model based on the calculated F statistics and p-values for each independent variable (Unland et al., Citation2013). In order to find the main independent factors in the regression models, the variables with the p-values of less than 0.05 were selected and the other variables were removed. The total procedure is shown in Supplementary Fig. 1 (McNeese, Citation2015).
4. Results and discussion
4.1. Determination of the moisture sources of precipitation by the HYSPLIT model
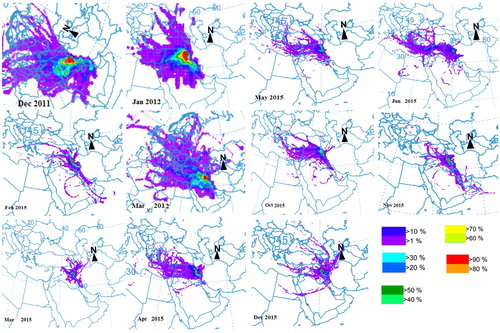
Studying the moisture sources of precipitation in the study region showed that during the winter months (January, February, and March), the precipitation moisture largely originated from the Mediterranean Sea, the Black Sea, and the Persian Gulf (). These sources of moisture were mainly transferred by the Mediterranean and continental tropical air masses and to a lower extent by the continental polar air mass in this region. During the spring months (April, May, and June), precipitation largely originated from the Mediterranean Sea and transferred via the Mediterranean air mass. During the fall months, precipitation moisture in October largely originated from the Mediterranean Sea, while in November and December besides the Mediterranean Sea, moisture was also provided by the Red Sea and the Persian Gulf (). This shows the role of the Mediterranean and continental tropical air masses in transferring moisture in this season. The moisture sources for the monthly precipitation obtained by the outputs of the HYSPLIT model for this region were in close agreement with those of the other studies (Heydarizad, Citation2018; Heydarizad et al., Citation2018a).
Fig. 4. The moisture sources of precipitation from December 2011 to March 2012 and from March 2015 to December 2015 in the study region detected using the backward trajectories of the HYSPLIT model (% demonstrates the frequency of the trajectories).
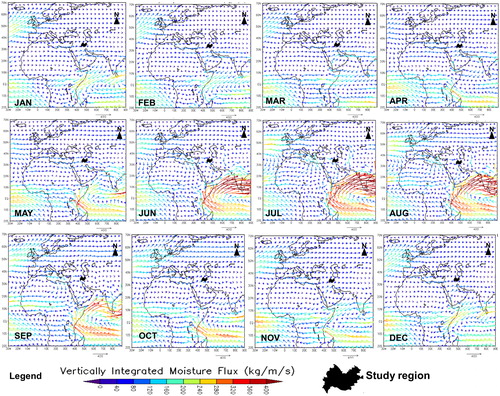
The monthly moisture fluxes over the water bodies which provide moisture for Iran were also studied for the period 1981–2015 (). In January, dominant moisture fluxes were observed from the Mediterranean Sea, the Persian Gulf, and the Red Sea. The moisture fluxes in January were almost the same as those in February, March, and April. In May, the role of moisture from the Persian Gulf and the Red Sea significantly decreased. In late spring and summer (June, July, August, and September), a very strong monsoon regime was observed over the Arabian Sea and the Indian Ocean which caused a huge precipitation over India and Pakistan. Meanwhile, in the study region, besides the moisture of the Persian Gulf and the Red Sea, the role of the moisture fluxes from the Mediterranean Sea in Iran and Iraq was largely decreased. This is due to the fact that the Azores high pressure system is reinforced over Iran and Iraq and causes a stable atmospheric condition preventing the transfer of moisture fluxes to this region (Heydarizad, Citation2018; Heydarizad et al., Citation2018a, Citation2018b). Due to the weakness of the Azores high pressure system in fall (October, November, and December), moisture fluxes were observed again from the Mediterranean Sea in October, while from November to December, moisture fluxes were also observed from the Red Sea and the Persian Gulf besides the Mediterranean Sea ().
Fig. 5. The spatial distribution of the vertically integrated moisture flux over the water bodies which provide moisture for precipitation in Iran and Iraq (from 1981 to 2015).
4.2. Isotopic variations of 18O and 2H in precipitation and developing seasonal LMWLs
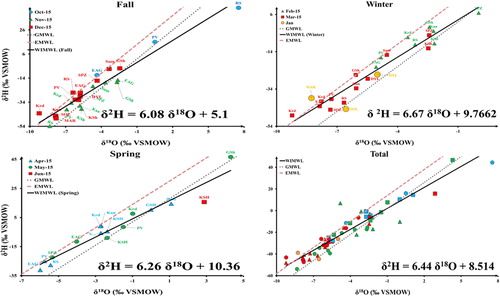
The seasonal variations of stable isotopes in precipitation were considerable in the study region (). Developing seasonal MWLs for the study region showed various slopes and intercepts. The variations observed in slope and intercept are because of moisture sources and meteorological variations due to seasonal changes.
The seasonal and total MWLs in the study region had lower slopes and intercepts than GMWL (Craig, Citation1961) and EMMWL (Gat and Carmi, Citation1970) (). The winter MWL (δ2H = 6.67 δ18O + 9.76) showed the highest slope compared to the other seasons due to the higher relative humidity and the lower evaporation effect in winter (). The spring MWL (δ2H = 6.26 δ18O + 10.36) showed a lower slope due to the evaporation effect, however, it had the highest intercept compared to the MWLs of the other seasons due to the stronger role of the Mediterranean Sea moisture in this season. Most of the samples (mainly in April and May) were plotted on or in the vicinity of the EMMWL which showed the important role of the Mediterranean Sea moisture. Nevertheless, the precipitation samples in June demonstrated the most intense deviation from all the samples and MWLs due to the huge evaporation effect (). The fall MWL (δ2H = 6.08 δ18O + 5.10) showed the lowest slope and intercept perhaps due to the intense evaporation effect and/or the role of the Caspian Sea moisture in the precipitation of this season. According to some previous studies (Heydarizad, Citation2018; Mohammadzadeh and Heydarizad, Citation2019), the MWL of precipitations originating from the moisture of the Caspian Sea showed a low slope and a very low intercept (δ2H = 5.48 δ18O − 8.59). No MWL was developed for summer since no considerable precipitation occurred during this season in the study region. The total MWL developed for the study region (δ2H = 6.44 δ18O + 8.51) showed a lower slope and intercept compared to the Zagros MWL (δ2H = 6.80 δ18O + 10.1) developed by Osati et al. (Citation2014). This is perhaps due to the fact that the current study covers a larger area including some warmer and drier regions in Iraq.
Fig. 6. The seasonal and total developed MWLs for the study region and comparing them with GMWL and EMMWL.
4.3. The effect of temperature and precipitation on precipitation isotopes
To study the effect of meteorological parameters on the stable isotope content of precipitation, the ANCOVA test has been used. The results of the ANCOVA test showed that both temperature and precipitation amount met the needed requirements to be considered as covariate variables (Supplementary Table 1). However, only precipitation also met the second condition of the ANCOVA test, i.e. the homogeneity of regression.
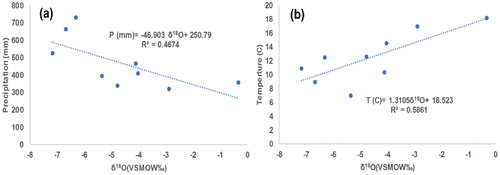
Studying the effects of the variations of the precipitation amount on the δ18O content in precipitation showed a notable negative correlation (R2 = 0.46) between the δ18O content in precipitation and the precipitation amount. The δ18O content was depleted 1‰ per approximately 47 mm precipitation increase in the study region (). This gradient is much lower than that of the Tehran region in north-central Iran which showed a depletion of 1‰ per approximately 10 mm increase in precipitation and that of the Mashhad region in the northeast of Iran which demonstrated a depletion of 1‰ per approximately 23 mm of increase in precipitation (Heydarizad, Citation2011). The low R2 = 0.46 observed in the correlation of the precipitation amount vs the δ18O content in precipitation is due to the fact that numerous local parameters influence the climate of the study region such as the moisture of Zarivar lake and also the existence of several cyclones and anti-cyclones in Zagros mountain ranges. On the other hand, air temperature also influences the δ18O content in precipitation and there is a positive correlation (R2 = 0.58) between them. The depletion of 1‰ of δ18O content in precipitation per 1.3 °C decrease in temperature is observed in the precipitation samples (). This is a high gradient compared to those of the other regions of the world such as the Black Forest in Germany and the central parts of Switzerland with a gradient of 1‰ depletion per 2.63 °C and 1.78 °C decrease in temperature (Clark and Fritz, Citation1997), respectively. The gradient is even milder in some stations inside Iran such as Tehran and Mashhad where the 1‰ depletion of the δ18O content occurs with a temperature decrease of 3.21 °C and 2.75 °C (Heydarizad, Citation2011), respectively.
Fig. 7. The correlation of the content of δ18O in precipitation with the variations of the precipitation amount (a) and temperature (b) in the study region.
4.4. The simulation of the spatial distribution of stable isotopes in the study region using the stepwise regression technique
The stepwise regression technique was used to determine which meteorological (precipitation amount, evaporation, and temperature) and non-meteorological parameters (latitude, longitude, and elevation characteristics of the observation points) as the independent variables were statistically significant in predicting the isotopic compositions of precipitation as the dependent variables in the study region. In addition, the stepwise regression technique was used to develop the δ18O and δ2H spatial distribution map in the study region.
As shown in Supplementary Fig. 1, the meteorological and geographical data (independent variables) in the study region were first entered into the stepwise regression model and the insignificant data were omitted (). In addition, the spatial distribution map of the predicated δ18O and δ2H and the error map (the differences between the real and predicted isotopic values) were produced for the study region. The predicated δ18O and δ2H showed an acceptable match with the real data except for those of Ravansar station in the northern part of the study region. The spatial distribution map of the errors represents the local effects on the isotopic composition of precipitation ().
Fig. 8. The predicted values of δ2H and δ18O (A and C) and their corresponding error values (B and D) for the study region.
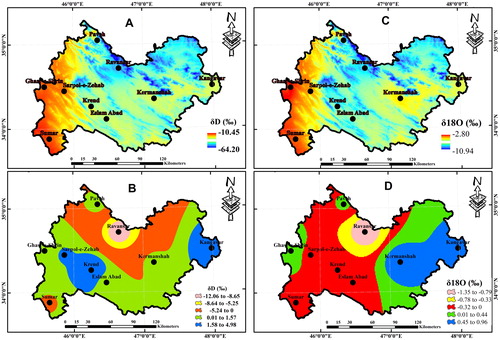
Table 3. δ18O and δ2H of precipitation in the study region based on the outputs of the predictive model.
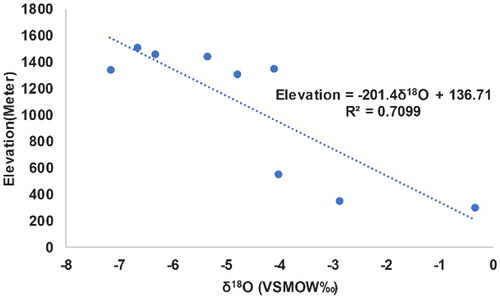
Studying the effect of the elevation of the sampling stations on the variations of δ18O in precipitation showed a significant correlation. The content of δ18O in precipitation depleted 0.5‰ per approximately 100-meter increase in elevation (). This is a high gradient compared to the other mountainous regions in the world such as Jura Mountains in Switzerland, Mount Blanc in France, and Mount Cameroun in West Africa (Clark and Fritz, Citation1997).
Fig. 9. The correlation between the δ18O content in precipitation and the elevation variations of the sampling stations in the study region.
4.5. The seasonal effect of precipitation on feeding surface water resources in the study region
Studying the seasonal effect of precipitation on feeding surface water resources (several rivers and Zarivar lake) in the study area yielded very valuable results (). The surface water resources (mainly rivers) were plotted on or near the developed seasonal MWLs, while the samples from Zarivar lake showed a larger deviation due to the evaporation effect (). Among the developed seasonal MWLs, the surface water resources showed a considerable deviation from the spring MWL due to intense secondary evaporation influencing spring precipitation. Among the studied surface water resources, the samples from Zarivar lake showed a huge deviation from all the developed seasonal MWLs and also from the river water samples. This is due to the fact that Zarivar lake has a large evaporation from its surface.
Fig. 10. Plotting the surface water resources in the study region on the developed seasonal and total MWLs.
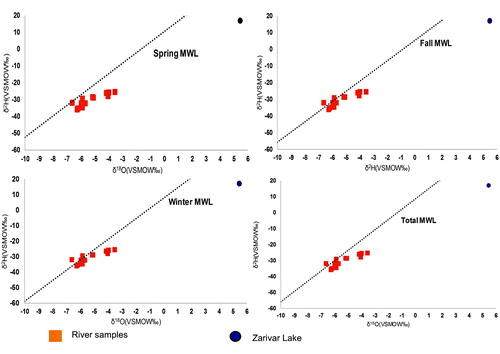
Table 4. The δ18O and δ2H contents of surface water resources in the study region.
5. Conclusions
The moisture sources of precipitation were determined by the backward trajectories of the HYSPLIT model in the west of Iran and the east of Iraq. Spring precipitation was mainly provided by the moisture of the Mediterranean and the Black Seas, while in the other seasons, the role of the moisture of the Persian Gulf, the Red Sea, and the Arabian Sea also increased. The developed seasonal MWLs showed variations in the slope and intercept which confirmed the seasonal effects on the precipitation characteristics in the study region. In addition to the moisture sources, stable isotopes in precipitation had a noteworthy relationship with monthly temperature and precipitation amount with R2 = 0.58 and R2 = 0.46, respectively, as investigated by the ANCOVA test. The spatial distribution map of the stable isotopes (δ18O and δ2H) in precipitation was also simulated using the stepwise regression method in the study region and showed a good match with the real data except for the northern part of the study region. Surface water resources in the study region were influenced by seasonal variations in precipitation as well as the evaporation effect mainly in Zarivar lake.
Acknowledgments
Our special thanks to the Meteorological Organizations of the western provinces of Iran, namely Kermanshah, Kurdestan, and Ilam for their help in providing meteorological data and sampling stable isotopes. We gratefully acknowledge Dr. Ramon Aravena for his partial financial support and Mr. R. Elgood and J. Harbin for their help with the geochemical and isotope analyses at the University of Waterloo-Environmental Isotope Laboratory (UW-EIL), Canada.
Disclosure statement
No potential conflict of interest was reported by the authors.
Supplemental data
Supplemental data for this article can be accessed here.
References
- Ali, K. K., Al-Kubaisi, Q. Y. and Al-Paruany, K. B. 2015. Isotopic study of water resources in a semi-arid region, western Iraq. Environ. Earth Sci. 74, 1671–1686. doi:10.1007/s12665-015-4172-6
- Alijani, B. 2000. Iran Climatology, 5th ed. Payam Nour Publication, Tehran.
- Barati, G. R. and Heydari, I. 2003. Classification of Iran western Precipitation. In: The First Iran National Climate Change Conference. Iran Meteorological Organization, Tehran, pp. 16–23.
- Boschetti, T., José, C., Iacumin, P. and Selmo, E. 2019. Local meteoric water line of Northern Chile (18° S–30° S): an application of error-in-variables regression to the oxygen and hydrogen stable isotope ratio of precipitation. Water 11, 791. doi:10.3390/w11040791
- Bowen, G. J., Revenaugh, J. 2003. Interpolating the isotopic composition of modern meteoric precipitation. Water Resour. Res. 39(10), 1299. doi:10.1029/2003WR002086
- Breitenbach, S. F. M., Adkins, J. F., Meyer, H., Marwan, N., Kumar, K. K. and co-authors. 2010. Strong influence of water vapor source dynamics on stable isotopes in precipitation observed in Southern Meghalaya, NE India. Earth Planet. Sci. Lett. 292, 212–220. doi:10.1016/j.epsl.2010.01.038
- Clark, I. D. and Fritz, P. 1997. Environmental Isotopes in Hydrogeology. CRC Press/Lewis Publishers, Boca Raton, FL.
- Crawford, J., Hughes, C. E. and Parkes, S. D. 2013. Is the isotopic composition of event based precipitation driven by moisture source or synoptic scale weather in the Sydney Basin, Australia? J. Hydrol. 507, 213–226. doi:10.1016/j.jhydrol.2013.10.031
- Craig, H. 1961. Isotopic variations in meteoric waters. Science 133, 1702–1703. doi:10.1126/science.133.3465.1702
- Delavau, C., Chun, K. P., Stadnyk, T., Birks, S. J., Welker, J. M. 2015. North American precipitation isotope (δ18O) zones revealed in time-series modelling across Canada and northern United States. Water Resour. Res. 51, 1284–1299.
- Dotsika, E., Lykoudis, S. and Poutoukis, D. 2010. Spatial distribution of the isotopic composition of precipitation and spring water in Greece. Glob. Planet. Change 71, 141–149. doi:10.1016/j.gloplacha.2009.10.007
- Faroughi, A. 2008. Characterizing isotopic signature of precipitation in Fars Province, Iran. Shiraz University, Iran.
- Gat, J. R. and Carmi, I. 1970. Evolution of the isotopic composition of atmospheric waters in the Mediterranean Sea area. J. Geophys. Res. 75, 3039–3048. doi:10.1029/JC075i015p03039
- Gonfiantini, R., Roche, M.-A., Olivry, J.-C., Fontes, J.-C. and Zuppi, G. M. 2001. The altitude effect on the isotopic composition of tropical rains. Chem. Geol. 181, 147–167. doi:10.1016/S0009-2541(01)00279-0
- Guan, H., Simmons, C. T. and Love, A. J. 2009. Orographic controls on rain water isotope distribution in the Mount Lofty Ranges of South Australia. J. Hydrol. 374, 255–264. doi:10.1016/j.jhydrol.2009.06.018
- Heydarizad, M. 2011. Investigation of hydrochemistry of karde dam and its hydraulically connection with downstream water resources. Ferdowsi University of Mashhad, Iran.
- Heydarizad, M. 2018. Meteoric water lines of Iran for various precipitation sources. Shiraz University, Iran.
- Heydarizad, M., Raeisi, E., Sori, R. and Gimeno, L. 2018a. The identification of Iran’s moisture sources using a Lagrangian particle dispersion model. Atmosphere (Basel) 9, 408. doi:10.3390/atmos9100408
- Heydarizad, M., Raeisi, E., Sori, R., Gimeno, L. and Nieto, R. 2018b. The role of moisture sources and climatic teleconnections in Northeastern and South-Central Iran’s hydro-climatology. Water 10, 1550. doi:10.3390/w10111550
- Huang, L. and Wen, X. 2014. Temporal variations of atmospheric water vapor δD and δ18O above an arid artificial oasis cropland in the Heihe River Basin. J. Geophys. Res. Atmos. 119, 11, 411–456,476.
- Jahanshahi, R. 2013. Environmental effects of GoleGohar Iron ore mine on groundwater of the area. Shiraz university, Iran.
- Juhlke, T. R., Meier, C., van Geldern, R., Vanselow, K. A., Wernicke, J. and co-authors. 2019. Assessing moisture sources of precipitation in the Western Pamir Mountains (Tajikistan, Central Asia) using deuterium excess. Tellus B Chem. Phys. Meteorol. 71, 1–16.
- Karimi, M. and Farajzadeh, M. 2011. Spatial and temporal distribution of Iran’s precipitation moisture. J. Geogr. Sci. Stud. 19, 109–127.
- Kazemi, G. A., Ichiyanagi, K. and Shimada, J. 2015. Isotopic characteristics, chemical composition and salinization of atmospheric precipitation in Shahrood, northeastern Iran. Environ. Earth Sci. 73, 361–374. doi:10.1007/s12665-014-3430-3
- Khalaj Amirhosseini, Y. 2011. Application of isotopes and dye tracing methods in hydrology (case study:Havasan dam construction). In: Proceedings of an International Symposium of Isotopes in Hydrology, Marine Ecosystems and Climate Change Studies, Monaco.
- Kohn, M. J. and Welker, J. M. 2005. On the temperature correlation of δ18O in modern precipitation. Earth Planet. Sci. Lett. 231, 87–96. doi:10.1016/j.epsl.2004.12.004
- Kong, Y., Wang, K., Li, J. and Pang, Z. 2019. Stable isotopes of precipitation in China: a consideration of moisture sources. Water 11, 1239. doi:10.3390/w11061239
- Krklec, K., Domínguez-Villar, D. and Lojen, S. 2018. The impact of moisture sources on the oxygen isotope composition of precipitation at a continental site in central. Europe. J. Hydrol. 561, 810–821. doi:10.1016/j.jhydrol.2018.04.045
- Kumar, U. S., Kumar, B., Rai, S. P. and Sharma, S. 2010. Stable isotope ratios in precipitation and their relationship with meteorological conditions in the Kumaon Himalayas, India. J. Hydrol. 391, 1–8. doi:10.1016/j.jhydrol.2010.06.019
- Kurita, N., Yoshida, N., Inoue, G. and Chayanova, E. A. 2004. Modern isotope climatology of Russia: a first assessment. J. Geophys. Res. Atmos. 109, 1–15. doi:10.1029/2003JD003404
- Lachniet, M. S. and Patterson, W. P. 2009. Oxygen isotope values of precipitation and surface waters in northern Central America (Belize and Guatemala) are dominated by temperature and amount effects. Earth Planet. Sci. Lett. 284, 435–446. doi:10.1016/j.epsl.2009.05.010
- Lachniet, M. S. and Patterson, W. P. 2006. Use of correlation and stepwise regression to evaluate physical controls on the stable isotope values of Panamanian rain and surface waters. J. Hydrol. 324, 115–140. doi:10.1016/j.jhydrol.2005.09.018
- Liu, Z., Bowen, G. J. and Welker, J. M. 2010. Atmospheric circulation is reflected in precipitation isotope gradients over the conterminous United States. J. Geophys. Res. 115, D2.
- Longinelli, A., Selmo, E. 2003. Isotopic composition of precipitation in Italy: a first overall map. J. Hydrol. 270, 75–88.
- Lykoudis, S. P., Kostopoulou, E. and Argiriou, A. A. 2010. Stable isotopic signature of precipitation under various synoptic classifications. Phys. Chem. Earth, Parts A/B/C 35, 530–535. doi:10.1016/j.pce.2009.09.002
- Masjedi, M., Jahani, H., Khalaj Amir Hosseini, Y., Hatami, F. and Kooh Pour, E. 1995. Tracer studies in Seymareh dam site in Ilam province. Report of Iran ministry of energy, No. 256213, 40–46.
- McNeese, B. 2015. Stepwise regression. Online at: https://www.spcforexcel.com/knowledge/root-cause-analysis/stepwise-regression
- Mohammadi, Z., Raeisi, E. and Bakalowicz, M. 2007. Method of leakage study at the karst dam site. A case study: Khersan 3 Dam, Iran. Environ. Geol. 52, 1053–1065. doi:10.1007/s00254-006-0545-1
- Mohammadzadeh, H. and Ebrahimpour, S. 2012. Application of stable isotopes and hydrochemistry to investigate sources and quality exchange Zarivar catchment area. J. Water Soil 26, 1018–1031.
- Mohammadzadeh, H. and Eskandari, E. 2018. Application of hydrogeochemical and isotopic techniques for better understanding of water resources characteristics in Paveh and Javanrud Study areas, Kermanshah. J. Local Hydrogeol. 3, 80–98.
- Mohammadzadeh, H. and Heydarizad, M. 2019. δ18O and δ2H characteristics of moisture sources and their role in surface water recharge in the north-east of Iran. Isotopes Environ. Health Stud. 55(6), 550–565. doi:10.1080/10256016.2019.1680552
- NOAA. 2018a. https://www.ncdc.noaa.gov [WWW Document].
- NOAA. 2018b. http://www.cpc.ncep.noaa.gov [WWW Document].
- NOAA. 2018c. https://www.esrl.noaa.gov [WWW Document].
- Numaguti, A. 1999. Origin and recycling processes of precipitating water over the Eurasian continent: Experiments using an atmospheric general circulation model. J. Geophys. Res. Atmos. 104, 1957–1972. doi:10.1029/1998JD200026
- Osati, K., Koeniger, P., Salajegheh, A., Mahdavi, M., Chapi, K. and co-authors. 2014. Spatiotemporal patterns of stable isotopes and hydrochemistry in springs and river flow of the upper Karkheh River Basin. Iran. Isotopes Environ. Health Stud. 50, 169–183. doi:10.1080/10256016.2014.857317
- Rao, W., Zhang, W., Yong, B., Tan, H., Meredith, K. T. and co-authors. 2018. Identifying the source of atmospheric moisture over arid deserts using stable isotopes (2H and 18O) in precipitation. Hydrol. Process 32, 436–449. doi:10.1002/hyp.11431
- Sánchez Murillo, R., Esquivel Hernández, G., Welsh, K. S., Brooks, E., Boll, J. and co-authors. 2013. Spatial and temporal variation of stable isotopes in precipitation across Costa Rica: an analysis of historic GNIP records. Open J. Mod. Hydrol. 3, 226–240. doi:10.4236/ojmh.2013.34027
- Sjostrom, D. J. and Welker, J. M. 2009. The influence of air mass source on the seasonal isotopic composition of precipitation, eastern USA. J. Geochemical Explor. 102, 103–112. doi:10.1016/j.gexplo.2009.03.001
- Soderberg, K., Good, S. P., O'Connor, M., Wang, L., Ryan, K. and co-authors. 2013. Using atmospheric trajectories to model the isotopic composition of rainfall in central Kenya. Ecosphere 4, art33–18.
- Stein, A. F., Draxler, R. R., Rolph, G. D., Stunder, B. J. B., Cohen, M. D. and co-authors. 2015. NOAA’s HYSPLIT atmospheric transport and dispersion modeling system. Bull. Amer. Meteor. Soc. 96, 2059–2077. doi:10.1175/BAMS-D-14-00110.1
- Tanoue, M., Ichiyanagi, K., Yoshimura, K., Kiguchi, M., Terao, T. and co-authors. 2018. Seasonal variation in isotopic composition and the origin of precipitation over Bangladesh. Prog. Earth Planet. Sci. 5, 77. doi:10.1186/s40645-018-0231-4
- Terzer, S., Wassenaar, L., Aragu´s-Aragu´s, L., Aggarwal, P. 2013. Global isoscapes for δ18O and δ2H in precipitation: improved prediction using regionalized climatic regression models. Hydrol. Earth Syst. Sci. 17, 1–16.
- Unland, N. P., Cartwright, I., Andersen, M. S., Rau, G. C., Reed, J. and co-authors. 2013. Investigating the spatio-temporal variability in groundwater and surface water interactions: a multi-technique approach. Hydrol. Earth Syst. Sci. 17, 3437–3453. doi:10.5194/hess-17-3437-2013
- Van der Veer, G., Voerkelius, S., Lorentz, G., Heiss, G., Hoogewerff, J. 2009. Spatial interpolation of the deuterium and oxygen-18 composition of global precipitation using temperature as ancillary variable. J. Geochemical Explor. 101, 175–184.
- Vespasiano, G., Apollaro, C., Rosa, R. D., Muto, F., Larosa, S. and co-authors. 2015. The Small Spring Method (SSM) for the definition of stable isotope–elevation relationships in Northern Calabria (Southern Italy). Appl. Geochem. 63, 333–346. doi:10.1016/j.apgeochem.2015.10.001
- Wei, Z., Yoshimura, K., Okazaki, A., Ono, K., Kim, W. and co-authors. 2016. Understanding the variability of water isotopologues in near-surface atmospheric moisture over a humid subtropical rice paddy in Tsukuba, Japan. J. Hydrol. 533, 91–102. doi:10.1016/j.jhydrol.2015.11.044
- Windhorst, D., Waltz, T., Timbe, E., Frede, H.-G. and Breuer, L. 2013. Impact of elevation and weather patterns on the isotopic composition of precipitation in a tropical montane rainforest. Hydrol. Earth Syst. Sci. 17, 409–419. doi:10.5194/hess-17-409-2013
- Xu, N., Gong, J. and Yang, G. 2018. Using environmental isotopes along with major hydro-geochemical compositions to assess deep groundwater formation and evolution in eastern coastal China. J. Contam. Hydrol. 208, 1–9. doi:10.1016/j.jconhyd.2017.11.003