
 ?Mathematical formulae have been encoded as MathML and are displayed in this HTML version using MathJax in order to improve their display. Uncheck the box to turn MathJax off. This feature requires Javascript. Click on a formula to zoom.
Abstract
Tree-ring stable oxygen isotope (δ18OTR) demonstrates the enormous potential for revealing hydrological climate changes and large-scale atmospheric circulations. Here, we established the 210-year δ18OTR chronology of Pinus tabulaeformis Carr. in Baotou, southwest Inner Mongolia, North China. The regional precipitation δ18O (δ18OP) and June-July-August relative humidity (RHJJA) were the two dominant environmental factors controlling the δ18OTR changes. Since the 1930s, the increasing δ18OTR values in the study region reflected the drying trend due to reducing precipitation and increasing temperature. The δ18OTR series in Baotou generally exhibited stronger correlations with three Indian summer monsoon (ISM) indexes than three East Asian summer monsoon (EASM) indexes during 1948–2009 AD. However, the δ18OTR record also significantly correlated with one EASM index. These results indicated that the Asian summer monsoon played an essential role in modifying the δ18OTR values, and the ISM possibly had more considerable influence compared with the EASM. We also found that the δ18OTR record had a higher correlation with the central-Pacific El Niño-Southern Oscillation (ENSO) than that with eastern-Pacific ENSO, probably because of the more substantial impact of the central-Pacific ENSO on the ISM.
1. Introduction
Monsoon circulations are crucial for globally transporting energy and moisture, and they have profound societal and economic impacts on monsoon regions (An et al., Citation2015). The Asian monsoon (AM) is an essential member of the global monsoon system (Wang and Ding, Citation2006, Citation2008), and could be divided into two sub-systems, i.e. the South Asian/Indian monsoon and the East Asian monsoon (Wang, Citation2006). Approximately 60% of the global population inhabits the AM region, and the economy, culture, and lifestyles are tightly connected with the AM intensity (Wang, Citation2006). Therefore, studying the AM is of vital significance. Given the short meteorological data, finding suitable natural archives that can represent monsoon changes, such as stalagmites (Cheng et al., Citation2016), lake sediments (Xiao et al., Citation2018), and tree rings (Cook et al., Citation2010; D’Arrigo et al., Citation2011), could help us comprehend the variations of the AM on a longer timescale. Among these natural records, tree rings have unique advantages, such as accurate dating and wide geographical distributions (Cook and Anchukaitis, Citation1990), and have played an important role in understanding the climate change in the past centuries and millennia.
In recent years, tree-ring stable oxygen isotope (δ18OTR) has shown great potential for revealing hydrological climate change and large-scale atmospheric circulations (Liu et al., Citation2009; Liu, An et al., Citation2012; Brienen et al., Citation2012; Sano et al., Citation2012, Citation2013; Zhu et al., Citation2012; Rinne et al., Citation2013; Young et al., Citation2015; Labotka et al., Citation2016; Labuhn et al., Citation2016; Liu, Cobb et al., Citation2017; Wernicke et al., Citation2017; Nagavciuc et al., Citation2019; Xu et al., Citation2018; Brunello et al., Citation2019). δ18OTR is mainly controlled by three factors, (a) the δ18O composition of source water, which mainly comes from atmospheric precipitation (McCarroll and Loader, Citation2004); (b) evaporative enrichment of leaf water, which depends on relative humidity (RH); and (c) biochemical fractionation during photosynthesis (Barbour et al., Citation2001). Therefore, δ18OTR can contain precipitation δ18O (δ18OP) and RH signals (Waterhouse et al., Citation2002), thus indicating the changes in hydrological cycles and large-scale circulations (Saurer et al., Citation2002).
In China, many δ18OTR studies have revealed the history of the AM and highlighted the impact of El Niño-Southern Oscillation (ENSO) on the AM on the interannual timescale (Xu et al., Citation2013, Citation2016; Zeng et al., Citation2016; Liu, Liu et al., Citation2017; Liu, Fang et al., Citation2019; Liu, Wang et al., Citation2019). In the Yaoshan region of Central China (Liu, Liu et al., Citation2017) and the Ordos Plateau of North China (Liu, Wang et al., Citation2019), the δ18OTR-based RH reconstructions reflected the weakening trend of the Asian summer monsoon (ASM) since the 1930s. More evidence about the weakening trend of ASM is needed. In addition, a positive correlation between the precipitation in North China and the Indian summer monsoon (ISM) was found in numerous meteorological studies (Kripalani and Singh, Citation1993; Kripalani and Kulkarni, Citation2001; Greatbatch et al., Citation2013). Some studies suggested that ENSO might regulate the teleconnection of rainfall in North China and India (Hu et al., Citation2005). Others believed that the ISM regulated the relationship between the summer rainfall in North China and ENSO (Feng and Hu, Citation2004). To explore whether ENSO or the ISM has played the regulatory roles, more palaeoclimatological evidence is required (Li et al., Citation2015).
Based on the two issues above, we conducted research on the δ18OTR record in Baotou, Inner Mongolia. Baotou is located in the semi-arid region of North China, which is a transition zone between the arid inland region and the humid southeast region and very sensitive to climate change and land use (Huang et al., Citation2017). To date, only a few tree-ring width studies have been carried out in Baotou (Liu et al., Citation2007; Liu, Zhang et al., Citation2017; Zhang et al., Citation2017), and tree-ring isotopes remain unstudied in the area. We assumed that the δ18OTR sequence in Baotou would be strongly linked to the hydroclimatic conditions and the atmospheric circulations. We hoped to (a) discuss the phenomenon of the weakening ASM after the 1930s and (b) investigate the relationship between the δ18OTR record and ENSO and the ISM. The study would fill the gap in the δ18OTR research in Baotou and deepen our understanding of δ18OTR and large-scale circulations.
2. Materials and methods
2.1. Sampling information
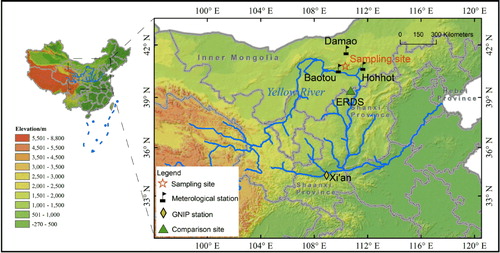
The sampling site, Wudangzhao (WD) (40°50′ N, 110°20′ E, 1500 m a.s.l., ), is on the southern slope of Yinshan Mountains, which is 30 km from the main urban districts of Baotou City (Zhang et al., Citation2017). According to the records of the Baotou meteorological station (1067.2 m a.s.l., 1951–2009 AD), the annual precipitation is 307 mm, and summer (June-July-August, JJA) precipitation accounts for 64% of the annual precipitation. The annual average temperature is 7.1 °C. The warmest month is July (23.2 °C), while the coldest month is January (−11.5 °C). The annual average RH is 51.2%. In terms of monthly variations, RH is lowest in May (36.9%) and highest in August (63.7%). In the summer of 2013, 60 cores from 30 trees were collected from the eastern (named WDE) and western (named WDW) sides of WD. The tree species collected was Pinus tabulaeformis Carr.
Fig. 1. Geographical locations of the sampling site, three meteorological stations and one site for δ18O comparison (ERDS, Liu, Wang et al. Citation2019). The δ18OP site in Xi’an from the Global Network of Isotopes in Precipitation project (GNIP) was denoted and the δ18OP site in Baotou was at the same location of the Baotou meteorological station.
2.2. Oxygen isotope analysis
Before conducting the isotope experiment, we measured the tree-ring width and used the COFECHA programme for cross-dating. In general, annual rings can occasionally be missing due to the dry growing conditions in arid or semi-arid areas (Fritts, Citation1976). Baotou is located in a semi-arid area, and the average rate of missing rings was as high as 3.13% in the sampling site WD (Liu et al., Citation2007). In addition to missing rings, tree rings grew in narrow or distorted shapes in many time intervals, which created certain obstacles for sample cutting. We chose 8 segments with relatively straight and wide rings and few missing rings, namely, WDW12 B (1800–1950 AD), WDW15A (1800–1902 AD), WDW10B (1800–1902 AD), WDE 9A (1800–1900 AD), WDE5B (1800–1990 AD), WDE 13 A (1917–2009 AD), WDW 7B (1929–2009 AD), WDW5B (1901–2009 AD). Note that the chronology ended in the year of 2009 because the rings for the next three years (2010–2012) were unclear and distorted. Besides, rings of the first 40–50 years close to the pith were not used to avoid possible ‘juvenile effect’ (Duffy et al., Citation2017).
The rings for each year of these eight cores were peeled off under a microscope with a scalpel. Then, the samples of annual rings were independently transferred into the tubes for chemical reactions. We extracted α-cellulose using the Jayme-Wise method (Green, Citation1963), and the more detailed chemical reaction process could be found in Liu et al. (Citation2018). The α-cellulose experienced a complete homogenising and drying, and then 0.12–0.16 mg of each sample was wrapped in a silver capsule for isotope measurement. The δ18O values were measured by the Delta V Advantage elemental mass spectrometer. The oxygen isotope ratio was expressed as the deviation of δ18O from the Vienna Standard Mean Ocean Water (VSMOW) standard. The formula for calculating the δ18O value is as follows:
(1)
(1)
where Rsample and Rstandard represent the ratios of 18O/16O in the sample and the standard, respectively.
Merck microcrystalline with a known δ18O value (27.7 ‰) was chosen as the laboratory standard. A Merck sample was inserted into every eight tree-ring samples to evaluate the measurement quality and correct the isotope values. The oxygen isotope measurement accuracy was ±0.3 ‰ (N = 116).
2.3. Meteorological data
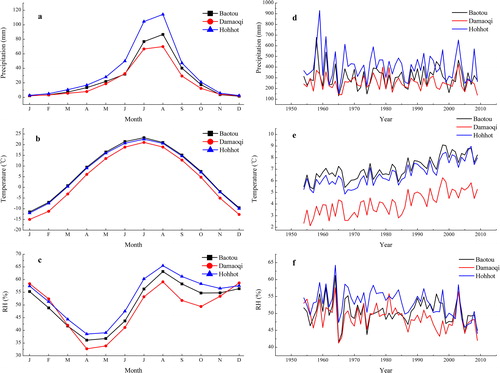
The three closest meteorological stations to the sampling site are the Baotou (40.67° N, 109.85° E, 1067.2 m a.s.l.), Damaoqi (41.7° N, 110.43° E, 1376.6 m a.s.l.), and Hohhot stations (40.82° N, 111.68° E, 1063.0 m a.s.l.). According to rough calculations according to their latitudes and longitudes, the stations are approximately 44 km, 97 km, 114 km from the sampling site, respectively. The selected climate factors were temperature, precipitation, and RH. As shown in , the monthly variation patterns of the three climate factors at the three meteorological stations during the common period 1954–2009 AD were almost identical. The annual values of the climatic factors from 1954 to 2009 AD had differences, especially in terms of temperature, but they exhibited synchronous changes (). They are located in different directions from the WD sampling site (). Therefore, we used the arithmetic mean of the selected climate factors at the three stations to represent the climate in WD.
Fig. 2. The monthly variations of (a) precipitation, (b) temperature and (c) relative humidity and the annual variations of (d) precipitation, (e) temperature and (f) relative humidity at the Baotou, Damaoqi and Hohhot stations during 1954–2009 AD.
2.4. Statistical analysis
Since each core covered a different time span, we first standardised each core. The mean interseries correlations (Rbar) and expressed population signal (EPS) were calculated according to the 30-year window from the period of 1815–1995 AD (Wigley et al., Citation1984). The formula for EPS is as follows:
(2)
(2)
where N refers to the number of cores, and
is the average correlation between the tree cores.
The numerical mixing method (Liu, Liu et al., Citation2012) was used to synthesise a master δ18OTR sequence. The relationship between the δ18OTR sequence and the climate factors was examined using Person correlation (r). Because of the autocorrelation between the sequences, we calculated the effective degree of freedom (EDOF, Bretherton et al., Citation1999) as follows:
(3)
(3)
where N is the length of the time series, and r1, r2 is the first-order autocorrelation of each sequence.
To prove that the δ18OTR record inherits the signal of δ18OP, we compared the δ18OTR series and two surrounding δ18OP sites (Xi’an and Baotou) from the Global Network of Isotopes in Precipitation project (GNIP, http://www-naweb.iaea.org). The periodicity analysis of the δ18OTR sequence was obtained with the multitaper method (MTM). We used the Royal Netherlands Meteorological Institute Climate Explorer (http://climexp.knmi.nl/) to carry out a spatial correlation analysis of between the δ18OTR sequence and sea surface temperature (ERSST dataset) from 1854–2009 AD, as well as the hydroclimate factors, namely, precipitation (CRU TS4.03), PDSI (UCAR), and water vapour pressure (CRU TS4.03) from 1950 to 2009 AD. In addition, we calculated correlation coefficients between the δ18OTR sequence and the Niño 4 (5° S–5° N, 160° E–150° W), Niño 3.4 (160° E–150° W, 5° S–5° N), Niño 3 (5° S–5° N, 150°–90° W), and Niño 1 + 2 (0°–10° S, 80°–90° W) SST indexes from ERSST dataset during 1854–2009 AD. The ERSST dataset was also retrieved from http://climexp.knmi.nl/.
We used the National Centers for Environmental Prediction/National Center for Atmospheric Research (NCEP/NCAR) reanalysis data to calculate three East Asian summer monsoon (EASM) indexes and three ISM indexes (Webster and Yang, Citation1992; Lau et al., Citation2000; Li and Zeng, Citation2002, Citation2003; Zhang et al., Citation2003). The NCEP/NCAR data were obtained from https://www.esrl.noaa.gov/psd/data/gridded/data.ncep.reanalysis.html. These indexes were based on different meteorological variables over different regions. Webster and Yang (Citation1992) defined the ISM as the zonal wind shear between 850 and 200 hPa within 5–20° N and 40–110° E. Lau et al. (Citation2000) defined two monsoon indexes, RM1 (ISM) and RM2 (EASM). RM1 was defined as the V850 minus the V200 over the region 10°–30° N and 70°–110° E, where V850 and V200 were the meridional wind at 850 hPa and 200 hPa, respectively. RM2 was defined as the U200 over the region 40°–50° N and 110°–150° E minus U200 over the region 25°–35°N and 110°–150°E, where U200 denotes the zonal wind at 200 hPa. Li and Zeng (Citation2002, Citation2003) defined the EASM index as an area-averaged seasonally (JJA) dynamical normalised seasonality (DNS) at 850 hPa within the East Asian monsoon domain (10°–40° N, 110°–140° E), while the ISM index is defined as an area-averaged seasonally (June-July-August-September, JJAS) dynamical normalised seasonality (DNS) at 850 hPa within the South Asian domain (5°–22.5° N, 35°–97.5° E). Zhang et al. (Citation2003) defined the EASM index using the difference of anomalous wind between the (10°–20° N, 100–150° E) and (25°–35° N, 100°–150° E) at 850 hPa with the averaged JJA. To be consistent, the ISM indexes were all calculated during JJAS, while the EASM indexes were calculated during JJA. The average JJA water vapour flux figure from the ground to 300 hPa during 1948–2009 AD was developed using NCAR Command Language (NCL) software based on the NCEP/NCAR reanalysis data.
The monsoon indexes obtained from the NCEP/NCAR reanalysis data were only 62 years (1948–2009 AD). To compare the δ18OTR series and the ISM on a longer timescale, the all India precipitation data during JJAS from 1871 to 2009 AD from the Indian Institute of Tropical Meteorology (https://tropmet.res.in/) were obtained and used to represent the long-term changes in the ISM intensity. A partial correlation analysis was carried out to test the effect of ENSO and the ISM on the δ18OTR sequence.
3. Results
3.1. The δ18OTR record in Baotou and its relationship with δ18OP
The δ18O values of the eight cores ranged from 27.05‰ to 35.61‰. The time interval, δ18OTR average, and standard deviation of each core were summarised in . The averages and standard deviations of the eight cores varied from 30.50‰ to 32.52‰ and from 1.27‰ to 1.64‰, respectively. The original series of the eight cores were presented in . Since the average and standard deviation of each core were different, we first performed standardisation and then synthesised them to a master δ18OTR sequence, as shown in . The autocorrelation of the master δ18OTR sequence was 0.34. In each time interval, there were 3–5 cores (). The value range of Rbar was 0.53–0.70, and the EPS varied from 0.85 to 0.92 ().
Fig. 3. The δ18OTR series in Baotou. (a) The raw δ18O data of the eight cores. (b) The master δ18OTR series produced by averaging the eight z-scored individual series. (c) Numbers of cores through the chronology interval. (d) Mean interseries correlation (Rbar), the running EPS calculated using 30-year windows and a lag time of 15 years.
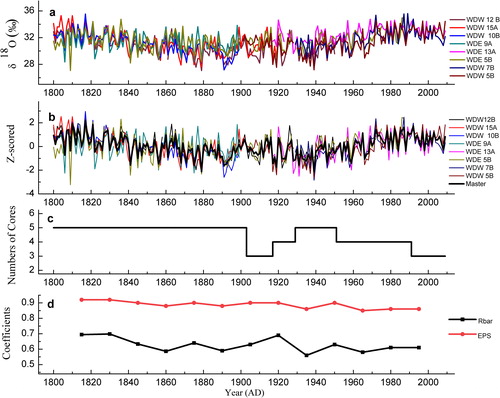
Table 1. Statistical features of the eight individual series.
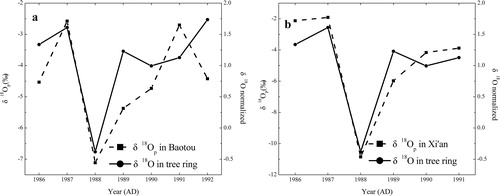
The comparisons between the δ18OTR record and two surrounding δ18OP stations (Xi’an and Baotou) were illustrated in . According to rough calculations based on their latitudes and longitudes, Baotou and Xi’an δ18OP stations are approximately 44 km and 736 km from the sampling site, respectively (). The δ18OTR record was consistent with the δ18OP in most years ().
Fig. 4. Comparisons of the δ18OTR series and δ18OP in (a) Baotou; (b) Xi’an.
3.2. Climate response of the δ18OTR record
The correlations between the δ18OTR record and the monthly precipitation amount, average temperature, and RH (1954–2009 AD) at the three meteorological stations were shown in . Except for the temperatures in January and May, the δ18OTR record was not significantly correlated with any climate factors from October–December of the previous year to January–May of the current year, indicating that the δ18OTR sequence was basically unaffected by the pregrowing season. The highest correlation coefficient was -0.58 between δ18OTR and the RH in JJA (RHJJA), implying RHJJA was the main controlling factor of the δ18OTR series. In addition, the correlation between the δ18OTR series and the temperature and precipitation in JJA was also significant.
Fig. 5. Correlations and comparisons between the δ18OTR record and climate factors. (a) The correlations between the δ18OTR series and the climate factors during 1954–2009 AD; (b) The comparison of the original data between the δ18OTR series and RHJJA. (c) The comparison of the first-order data between the δ18OTR series and RHJJA.
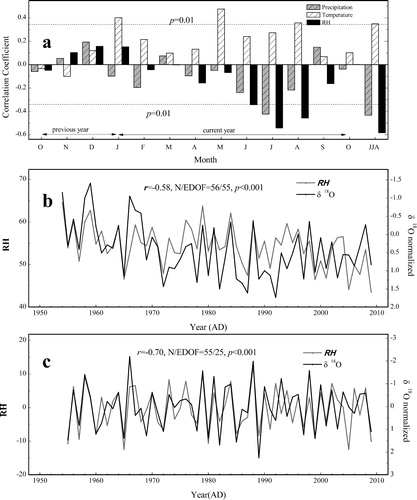
We further compared the δ18OTR record with the RHJJA of the original sequences () and the first-order difference sequences (). In particular, the comparison of the first-order difference sequences showed that the δ18OTR record could effectively capture the high-frequency changes in RHJJA.
3.3. Spatial representativeness of the δ18OTR record and comparison with the surrounding δ18OTR site
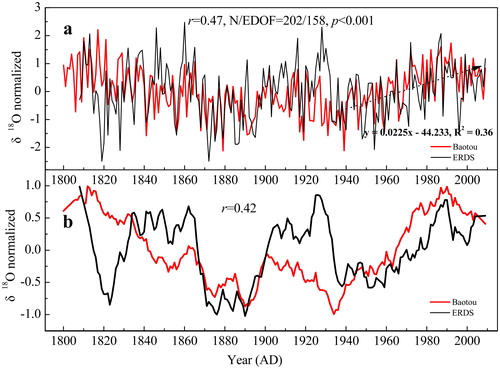
To further demonstrate that the δ18OTR record can represent the regional hydrological conditions, we performed spatial correlation analysis between the δ18OTR sequence and the vapour pressure (CRU TS4.03), precipitation (CRU TS4.03) and scPDSI (UCAR) from 1950 to 2009 AD. As shown in , the results proved that the δ18OTR sequence could represent the large-scale hydroclimatic changes in North China, especially the changes in vapour pressure. In addition, the δ18OTR records in Baotou and Ordos Plateau of Inner Mongolia (Liu, Wang et al., Citation2019) were correlated both on the interannual () and interdecadal () timescales. The interannual correlation coefficient of the two sequences was 0.47 (N/EDOF = 202/158, p < 0.001), demonstrating the spatial representativeness of the δ18OTR record in Baotou. In the interdecadal variation, the δ18OTR values in two records both increased from the 1930s.
Fig. 6. Spatial correlations of the δ18OTR record with (a) the vapour pressure (CRU TS4.03) from 1950 to 2009 AD; (b) precipitation (CRU TS4.03) from 1950 to 2009 AD; (c) scPDSI (UCAR) from 1950 to 2009 AD; (d) SST (ERSST dataset) from 1854 to 2009 AD. The black and grey rectangles denote the Niño 3.4 and Niño 4 regions, respectively, and the correlation coefficients with the δ18OTR record are both indicated. The sampling site is illustrated with a red dot. All with p values < 0.1.
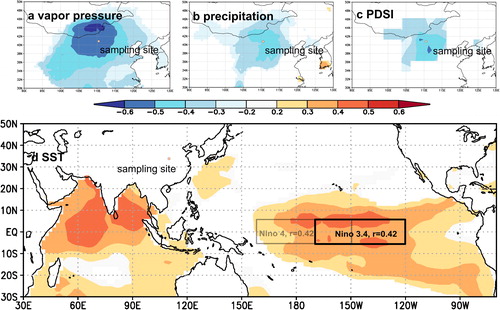
Fig. 7. Comparison of the δ18OTR records from Baotou and ERDS. (a) The original series of the two records. The δ18OTR record in ERDS (Liu, Wang et al. Citation2019) was normalised using the same method. The arrow line indicates the significant increasing trend of δ18OTR in Baotou since 1934 (Liu, Liu et al. Citation2019; Liu, Wang et al. Citation2019). (b) The 11-year moving averaging series of the two records.
3.4. The relationship between the δ18OTR record and the ASM
To explore the relationship between the δ18OTR record and the ASM, we calculated the correlation coefficients between the δ18OTR series with the EASM and the ISM indexes (). The results showed that the correlations of δ18OTR with the ISM indexes were higher than those with the EASM indexes. In addition, the δ18OTR record was significantly correlated with all India precipitation in JJAS (r = −0.23, N = 139, p < 0.01) (). According to the comparison of the 21-year running average () and the 21-year running correlation between the δ18OTR series and India precipitation (), the relationship between the δ18OTR record and all Indian precipitation was unstable, with the strongest correlation during the 1890s–1900s. After the 1990s, their correlation weakened. The 21-year running correlations between the δ18OTR series and JJA Niño 3.4 and between the δ18OTR series and all India precipitation were consistent ().
Fig. 8. The correlations of δ18OTR with the ISM and ENSO. (a) Comparison of the original series between the δ18OTR record in Baotou and all Indian precipitation (JJAS); (b) Comparison of the 21-year moving averaging series between the δ18OTR record in Baotou and the all Indian precipitation (JJAS); (c) The 21-year moving correlations between δ18OTR record in Baotou and the JJA Niño 3.4 index (ERSST), comparing with the 21-year moving correlation of the all Indian precipitation (JJAS). The all Indian precipitation (JJAS) was used to represent the ISM intensity.
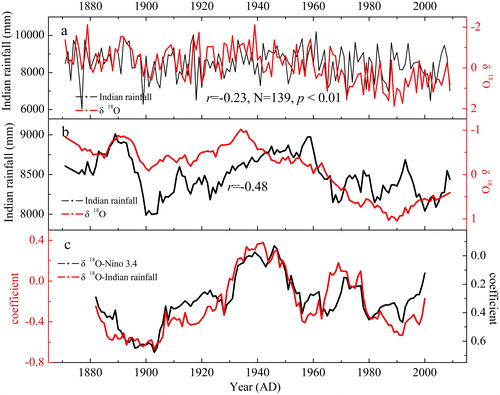
Table 2. Correlations between δ18OTR and different monsoon indexes (1948–2009 AD).
4. Discussion
4.1. Characteristics and environmental factors of the δ18OTR record
Compared with the tree-ring width, a great advantage of δ18OTR is stronger climate signals with much fewer cores (Leavitt, Citation2010). EPS = 0.85 usually serves as a threshold for testing whether the number of cores is sufficient to capture the representative isotope signals (Wigley et al., Citation1984). The EPS in this study varied from 0.85 to 0.92, proving that the cores were sufficient to synthesise a reliable oxygen isotope chronology, although there were only three cores in some short intervals. In addition, the δ18OTR variability between the cores ranged from 0.19 to 4.28 ‰, which was similar to the 1–4 ‰ summarised by Leavitt (Citation2010).
The dominant environmental factors of the δ18OTR series in Baotou were δ18OP and summer RH, which was supported by the δ18OTR fractionation theory (McCarroll and Loader, Citation2004). First, we found that δ18OTR and δ18OP records in Xi’an and Baotou could be well matched (). The soil moisture absorbed by trees mainly came from the atmospheric precipitation, so δ18OTR was likely to contain the δ18OP signal (McCarroll and Loader, Citation2004). Although the δ18OP station in Xi’an is approximately 736 km far from the sampling site, the δ18OP signal was well-reserved. However, the δ18OTR and δ18OP values were slightly inconsistent in 1990 and 1992, which was possibly caused by other fractionation on the pathway from absorption of δ18OP to cellulose synthesis (Roden et al., Citation2000). Unfortunately, the δ18OP data in Baotou and Xi’an from the GNIP dataset were only seven or six years. If a long-term δ18OP observation record had been available, we could have determined the contribution of δ18OP to the δ18OTR record.
Second, the climate response analysis found that RH was the main factor controlling the δ18OTR sequence, while the effects of precipitation and temperature were weaker (). This was because the RH directly controlled the δ18OTR fractionation, while precipitation and temperature could only indirectly influence the δ18OTR through δ18OP and RH (McCarroll and Loader, Citation2004). Lower RH would result in an increasing vapour pressure gradient between the atmosphere and interstitial leaf space, leading to preferred 16O loss and thereby 18O enrichment in leaf water (Sano et al., Citation2011; Liu, Wang et al., Citation2019), and vice versa. Therefore, δ18OTR exhibited a negative correlation with RH. JJA was the main summer monsoonal precipitation season in the sampling site, and the sharply changing RH in JJA () greatly influenced the δ18OTR values. According to the meteorological data, the correlation of the RH with precipitation was 0.69, while the correlation with temperature was merely -0.37 in JJA (1954–2009 AD). This could explain why precipitation had a higher correlation with the δ18OTR record than the temperature in JJA.
Previous studies have shown that δ18OTR can be a good indicator of hydrological climate factors (Lorrey et al., Citation2016; Brunello et al., Citation2019), such as RH (An et al., Citation2014; Grießinger et al., Citation2017; Li et al., Citation2019; Liu, Wang et al., Citation2019), PDSI (Sano et al., Citation2011; Liu, Fang et al., Citation2019), SPEI (Labuhn et al., Citation2016), precipitation (Anchukaitis et al., Citation2008; Baker, Hunt et al., Citation2015; Xu, Shi et al., Citation2019), vapour pressure deficit (Liu, Zhang et al., Citation2017), even cloud cover (Liu et al., Citation2014). The results of the spatial correlation between δ18OTR in Baotou and the vapour pressure, precipitation, and PDSI in this study () also demonstrated that the δ18OTR record could reflect the hydroclimatic conditions in North China.
4.2. Comparison of δ18OTR records
We found that the δ18OTR records in Baotou and Ordos were well correlated (r = 0.47, 1808–2009 AD, ), which indicated that the δ18OTR records were substantially consistent over long distances (Baker, Hunt et al. Citation2015; Wernicke et al., Citation2019; Xu, Shi et al., Citation2019). The δ18OTR averages and standard deviations in Baotou () and Ordos (32.38‰ ± 1.24‰, Liu, Wang et al., Citation2019) were similar. Since δ18OTR was mainly controlled by δ18OP and RH (Waterhouse et al., Citation2002), we assumed that two main reasons contributed to the consistency of the two δ18OTR records. First, the RHJJA in Baotou and Ordos were approaching the same value, which resulted in similar oxygen isotope evaporation enrichment in the two sites. According to Dongsheng station, RHJJA in Ordos was 55.2% (1957–2009 AD), while RHJJA in Baotou was 54.1% (1957–2009 AD) according to the three stations used in the study. Secondly, we speculated thatδ18OTR sequences in Baotou and Ordos probably inherited the same or similar δ18OP, as Liu, Wang et al. (Citation2019) also reported the consistency of δ18OTR with δ18OP in Xi’an and Baotou. Nevertheless, in addition to the δ18OP and RH, biochemical fractionation could also change the δ18OTR values (Barbour et al., Citation2001). Therefore, the two records were not exactly the same.
Since the 1930s, the δ18OTR values have increased contemporaneously in both Baotou and Ordos (), indicating the climate has become drier (Liu, Wang et al., Citation2019). Liu, Cai et al. (Citation2019) found that the precipitation in Loess Plateau had unprecedentedly decreased from 1934 to 2013. Furthermore, the temperature in North China began to rise after the 1930s (Cai et al., Citation2018), which has also partly led to the drier climate. Declining precipitation, rising temperature and thus the drier climate, combined with a rapidly growing population, would result in land degradation and desertification in the semi-arid area (Huang et al., Citation2017). It deserves attention from the local government and the public.
4.3. The impact of the ASM on the δ18OTR record
The ASM could have an impact on the RHJJA and δ18OP, thus influencing the δ18OTR record. First of all, the local RHJJA was closely related to summer monsoonal precipitation (r = 0.69, p < 0.001, 1954–2009 AD) that was controlled by the ASM intensity (Wang, Citation2006; Liu, Cai et al., Citation2019). Besides, δ18OP was modulated by many factors, such as its source region, temperature, cloud physics, and the condensation history of atmospheric water vapour (Brienen et al., Citation2013). Some studies believed the δ18OP in the AM region was a proxy of AM intensity since it integrated all aspects of atmospheric transport from source to sink (Vuille et al., Citation2005; Yang et al., Citation2016). Moreover, Li et al. (Citation2011) reconstructed the δ18OP variation in North China based on δ18OTR and found the δ18OP was well correlated with ASM intensity.
The ASM contains two sub-systems, namely the EASM and ISM, which dynamically interact with each other (Lau et al., Citation2000). Modern observation showed that the ISM and associated moisture could penetrate northeastward and influence the precipitation in East Asia (Cheng et al., Citation2012). And in the north fringe of ASM, it was found that both EASM and ISM could influence the precipitation (Liu, Cai et al., Citation2019). As demonstrated in , the δ18OTR record in Baotou generally had stronger correlations with all three ISM indexes than the three EASM indexes, indicating that the ISM had a stronger impact on the δ18OTR record. Besides, illustrated a significant correlation between the δ18OTR record and the Indian Ocean SST. These results implied that water vapour in Baotou was possibly derived from the Indian Ocean (Baker, Sodemann et al., Citation2015). In addition, the water vapour flux map from the ground to 300 hPa (Supplementary material, Figure S1) also implied that the water vapour in Baotou was originated from the Indian Ocean during JJA.
Moreover, we found that the relationship between the ISM and the δ18OTR record was still significant during 1871–2009 AD (). Furthermore, their decadal changes were generally consistent (). These results implied the impact of ISM on the δ18OTR record existed over a long timescale (Li et al., Citation2015).
4.4. The impact of ENSO
MTM analysis demonstrated that the δ18OTR sequence had an interannual cycle of 2.1 a, 2.5 a, 3.8 a, and 5.3 a (Supplementary material, Figure S2), which might relate to the 2–7 a cycle of ENSO (Capotondi et al., Citation2015). Furthermore, the spatial correlation of δ18OTR with SST () indicated that the tropical Pacific SST had an impact on the climate. Although ENSO is only a natural fluctuation of the tropical Pacific SST on an interannual scale, it can affect the global moisture cycle through the sea-air coupling, which was described as the atmospheric bridge in Alexander et al. (Citation2002). During an El Niño event, the SST in the eastern Pacific increased abnormally, and the western Pacific convection shifted to the central and eastern Pacific, suppressing the convection of the West Pacific Warm Pool and the AM region, resulting in a weakening AM (Li and Ting, Citation2015) and thereby an increasing δ18OTR value. Therefore ENSO and the δ18OTR series displayed a positive correlation. As shown in , when the correlation between the δ18OTR record and Niño 3.4 was strong (weak), the correlation between the δ18OTR record and the ISM was also strong (weak). It indicated the δ18OTR series recorded the ENSO signal through the influence of ISM.
ENSO can be further divided into the Eastern Pacific (EP) ENSO and Central Pacific (CP) ENSO (Kao and Yu, Citation2009) or El Niño Modoki (Ashok et al., Citation2007), and both types of ENSO will have a global climate effect (Hu et al., Citation2016). Usually, the Niño 4 and Niño 3.4 indexes represent the CP SST changes, and the Niño 3 index and the Niño 1 + 2 index represent the EP SST changes (Yu and Kao, Citation2007). We found that δ18OTR and Niño 3.4 (r = 0.42, N = 155, p < 0.001) and Niño 4 (r = 0.42, N = 155, p < 0.001) were more correlated than Niño 3 (r = 0.36, N = 155, p < 0.001) and Niño 1 + 2 indexes (r = 0.19, N = 155, p < 0.05) during JJA, indicating that the CP SST had a greater impact on the δ18OTR in Baotou. Although the concept of the CP ENSO has only been proposed in the last decade (Capotondi et al., Citation2015), it has been found that the intensity of CP El Niño events has almost doubled over the past three decades (Lee and McPhaden, Citation2010). The greater impact of CP SST on δ18OTR records in China has also been found in other studies (Liu, Cobb et al., Citation2017; Liu, Wang et al., Citation2019).
CP ENSO probably had a stronger impact on the ISM than the EP ENSO and thereby exerted more influence on the δ18OTR record. For example, Kumar et al. (Citation2006) found that CP El Niño events could more effectively suppress ISM rainfall than EP El Niño events by shifting the descending arm of the Walker circulation over the eastern equatorial Indian ocean and driving anomalous regional Hadley circulation. A sub-annual δ18O record of stalagmite also pointed out that the ISM was more correlated with CP El Niño events than EP El Niño events (Myers et al., Citation2015).
5. Conclusions and future prospects
In Baotou, North China, we established a 210-year δ18OTR chronology (1800–2009 AD). The chronology was mainly controlled by the δ18OP and RHJJA. It was well-correlated with the δ18OTR record in Ordos Plateau. Since the 1930s, the contemporaneously increasing δ18OTR values in the two records indicated the drier climate thereafter, which could further exacerbate the ecologic environment in the semi-arid region. The consistency of the two records laid a basis for the regional climate reconstruction in the future.
We found that the ISM had a stronger influence on the δ18OTR record than the EASM, and the impact of the ISM existed over a long timescale (1871–2009 AD). Besides, CP ENSO probably had a more substantial impact on the ISM than the EP ENSO and thereby exerted more influence on the δ18OTR record.
Supplemental Material
Download MS Word (399.4 KB)Acknowledgement
We thank two anonymous reviewers for their helpful comments and suggestions.
Declaration of interest
No potential conflict of interest was reported by the authors.
Data availability statement
Data that have contributed to the reported results are available from the corresponding author on request.
Additional information
Funding
References
- Alexander, M. A., Bladé, I., Newman, M., Lanzante, J. R., Lau, N.-C. and co-authors. 2002. The atmospheric bridge: the influence of ENSO teleconnections on air–sea interaction over the global oceans. J. Clim. 15, 2205–2231. doi:10.1175/1520-0442(2002)015<2205:TABTIO>2.0.CO;2
- An, Z., Wu, G., Li, J., Sun, Y., Liu, Y. and co-authors. 2015. Global Monsoon Dynamics and Climate Change. Annu. Rev. Earth Planet. Sci. 43, 29–77. doi:10.1146/annurev-earth-060313-054623
- An, W., Liu, X., Leavitt, S. W., Xu, G., Zeng, X. and co-authors. 2014. Relative humidity history on the Batang-Litang Plateau of western China since 1755 reconstructed from tree-ring δ18O and δD. Clim. Dyn. 42, 2639–2654. doi:10.1007/s00382-013-1937-z
- Anchukaitis, K. J., Evans, M. N., Wheelwright, N. T. and Schrag, D. P. 2008. Stable isotope chronology and climate signal calibration in neotropical montane cloud forest trees. J. Geophys. Res. 113, G03030.
- Ashok, K., Behera, S. K., Rao, S. A., Weng, H. and Yamagata, T. 2007. El Niño Modoki and its possible teleconnection. J. Geophys. Res. 112, C11007. doi:10.1029/2006JC003798
- Baker, A. J., Sodemann, H., Baldini, J. U. L., Breitenbach, S. F. M., Johnson, K. R. and co-authors. 2015. Seasonality of westerly moisture transport in the East Asian summer monsoon and its implications for interpreting precipitation δ18O. J. Geophys. Res. Atmos. 120, 5850–5862. doi:10.1002/2014JD022919
- Baker, J. C. A., Hunt, S. F. P., Clerici, S. J., Newton, R. J., Bottrell, S. H. and co-authors. 2015. Oxygen isotopes in tree rings show good coherence between species and sites in Bolivia. Glob. Planet. Change 133, 298–308. doi:10.1016/j.gloplacha.2015.09.008
- Barbour, M. M., Andrews, T. J. and Farquhar, G. D. 2001. Correlations between oxygen isotope ratios of wood constituents of Quercus and Pinus samples from around the world. Funct. Plant Biol. 28, 335–348. doi:10.1071/PP00083
- Bretherton, C. S., Widmann, M., Dymnikov, V. P., Wallace, J. M. and Blade, I. 1999. The effective number of spatial degrees of freedom of a time-varying field. J. Clim. 12, 1990–2009. doi:10.1175/1520-0442(1999)012<1990:TENOSD>2.0.CO;2
- Brienen, R. J., Hietz, P., Wanek, W. and Gloor, M. 2013. Oxygen isotopes in tree rings record variation in precipitation δ18O and amount effects in the south of Mexico. J. Geophys. Res. Biogeosci. 118, 1604–1615. doi:10.1002/2013JG002304
- Brienen, R. J. W., Helle, G., Pons, T. L., Guyot, J. L. and Gloor, M. 2012. Oxygen isotopes in tree rings are a good proxy for amazon precipitation and El Niño-Southern Oscillation variability. Proc. Natl. Acad. Sci. USA. 109, 16957–16962. doi:10.1073/pnas.1205977109
- Brunello, C. F., Andermann, C., Helle, G., Comiti, F., Tonon, G. and co-authors. 2019. Hydroclimatic seasonality recorded by tree ring δ18O signature across a Himalayan altitudinal transect. Earth Planet. Sci. Lett. 518, 148–159. doi:10.1016/j.epsl.2019.04.030
- Cai, Q., Liu, Y., Duan, B. and Sun, C. 2018. Regional difference of the start time of the recent warming in Eastern China: prompted by a 165-year temperature record deduced from tree rings in the Dabie Mountains. Clim. Dyn. 50, 2157–2168. doi:10.1007/s00382-017-3741-7
- Capotondi, A., Wittenberg, A. T., Newman, M., Di Lorenzo, E., Yu, J.-Y. and co-authors. 2015. Understanding ENSO diversity. Bull. Am. Meteor. Soc. 96, 921–938. doi:10.1175/BAMS-D-13-00117.1
- Cheng, H., Edwards, R. L., Sinha, A., Spötl, C., Yi, L. and co-authors. 2016. The Asian monsoon over the past 640,000 years and ice age terminations. Nature 534, 640–646. doi:10.1038/nature18591
- Cheng, H., Sinha, A., Wang, X., Cruz, F. W. and Edwards, R. L. 2012. The global paleomonsoon as seen through speleothem records from Asia and the Americas. Clim. Dyn. 39, 1045–1062. doi:10.1007/s00382-012-1363-7
- Cook, E. R. and Anchukaitis, K. J. 1990. Methods of Dendrochronology: Applications in the Environmental Sciences. Kluwer Academic Publishers, Dordrecht.
- Cook, E. R., Anchukaitis, K. J., Buckley, B. M., D’Arrigo, R. D., Jacoby, G. C. and co-authors. 2010. Asian monsoon failure and megadrought during the last millennium. Science 328, 486–489. doi:10.1126/science.1185188
- D’Arrigo, R., Palmer, J., Ummenhofer, C. C., Kyaw, N. N. and Krusic, P. 2011. Three centuries of Myanmar monsoon climate variability inferred from teak tree rings. Geophys. Res. Lett. 38, L24705. doi:10.1029/2011GL049927
- Duffy, J. E., McCarroll, D., Barnes, A., Bronk Ramsey, C., Davies, D. and co-authors. 2017. Short-lived juvenile effects observed in stable carbon and oxygen isotopes of UK oak trees and historic building timbers. Chem. Geol. 472, 1–7. doi:10.1016/j.chemgeo.2017.09.007
- Feng, S. and Hu, Q. 2004. Variations in the teleconnection of ENSO and summer rainfall in Northern China: a role of the Indian summer monsoon. J. Clim. 17, 4871–4881. doi:10.1175/JCLI-3245.1
- Fritts, H. C. 1976. Tree Rings and Climate: Calibration. Academic Press, New York.
- Greatbatch, R. J., Sun, X. and Yang, X. Q. 2013. Impact of variability in the Indian summer monsoon on the East Asian summer monsoon. Atmos. Sci. Lett. 14, 14–19. doi:10.1002/asl2.408
- Green, J. W. 1963. Wood cellulose. In: Method in Carbohydrate Chemistry (ed. R. L. Whistler) Vol. III, Academic Press, New York. pp. 9–21.
- Grießinger, J., Bräuning, A., Helle, G., Hochreuther, P. and Schleser, G. 2017. Late Holocene relative humidity history on the southeastern Tibetan plateau inferred from a tree-ring δ18O record: recent decrease and conditions during the last 1500 years. Quat. Int. 430, 52–59. doi:10.1016/j.quaint.2016.02.011
- Hu, C., Yang, S., Wu, Q., Li, Z., Chen, J. and co-authors. 2016. Shifting El Niño inhibits summer Arctic warming and Arctic sea-ice melting over the Canada Basin. Nat. Commun. 7, 82–85.
- Hu, Z. Z., Wu, R., Kinter, J. L. and Yang, S. 2005. Connection of summer rainfall variations in South and East Asia: role of El Niño-southern oscillation. Int. J. Climatol. 25, 1279–1289. doi:10.1002/joc.1159
- Huang, J., Li, Y., Fu, C., Chen, F., Fu, Q. and co-authors. 2017. Dryland climate change: recent progress and challenges. Rev. Geophys. 55, 719–778. doi:10.1002/2016RG000550
- Kao, H.-Y. and Yu, J.-Y. 2009. Contrasting eastern-Pacific and central-Pacific types of ENSO. J. Clim. 22, 615–632. doi:10.1175/2008JCLI2309.1
- Kripalani, R. H. and Kulkarni, A. 2001. Monsoon rainfall variations and teleconnections over South and East Asia. Int. J. Climatol. 21, 603–616. doi:10.1002/joc.625
- Kripalani, R. H. and Singh, S. V. 1993. Large scale aspects of India-China summer monsoon rainfall. Adv. Atmos. Sci. 10, 71–84. doi:10.1007/BF02656955
- Kumar, K. K., Rajagopalan, B., Hoerling, M., Bates, G. and Cane, M. 2006. Unraveling the mystery of Indian monsoon failure during El Niño. Science 314, 115–119. doi:10.1126/science.1131152
- Labotka, D. M., Grissino-Mayer, H. D., Mora, C. I. and Johnson, E. J. 2016. Patterns of moisture source and climate variability in the southeastern united states: a four-century seasonally resolved tree-ring oxygen-isotope record. Clim. Dyn. 46, 2145–2154. doi:10.1007/s00382-015-2694-y
- Labuhn, I., Daux, V., Girardclos, O., Stievenard, M., Pierre, M. and co-authors. 2016. French summer droughts since 1326 CE: a reconstruction based on tree ring cellulose δ18O. Clim. Past 12, 1101–1117. doi:10.5194/cp-12-1101-2016
- Lau, K.-M., Kim, K.-M. and Yang, S. 2000. Dynamical and boundary forcing characteristics of regional components of the Asian Summer Monsoon. J. Clim. 13, 2461–2482. doi:10.1175/1520-0442(2000)013<2461:DABFCO>2.0.CO;2
- Leavitt, S. W. 2010. Tree-ring C-H-O isotope variability and sampling. Sci. Total Environ. 408, 5244–5253. doi:10.1016/j.scitotenv.2010.07.057
- Lee, T. and McPhaden, M. J. 2010. Increasing intensity of El Niño in the central-equatorial Pacific. Geophys. Res. Lett. 37, L14603. doi:10.1029/2010GL044007
- Li, J. and Zeng, Q. 2002. A unified monsoon index. Geophys. Res. Lett. 29, 115–1–115-4.
- Li, J. and Zeng, Q. 2003. A new monsoon index and the geographical distribution of the global monsoons. Adv. Atmos. Sci. 20, 299–302.
- Li, Q., Liu, Y., Nakatsuka, T., Fang, K., Song, H. and co-authors. 2019. East Asian Summer Monsoon moisture sustains summer relative humidity in the southwestern Gobi Desert, China: evidence from δ18O of tree rings. Clim. Dyn. 52, 6321–6337. doi:10.1007/s00382-018-4515-6
- Li, Q., Liu, Y., Nakatsuka, T., Song, H., McCarroll, D. and co-authors. 2015. The 225-year precipitation variability inferred from tree-ring records in Shanxi Province, the North China, and its teleconnection with Indian summer monsoon. Glob. Planet. Change 132, 11–19. doi:10.1016/j.gloplacha.2015.06.005
- Li, Q., Nakatsuka, T., Kawamura, K., Liu, Y. and Song, H. 2011. Regional hydroclimate and precipitation δ18O revealed in tree-ring cellulose δ18O from different tree species in semi-arid northern China. Chem. Geol. 282, 19–28. doi:10.1016/j.chemgeo.2011.01.004
- Li, X. and Ting, M. 2015. Recent and future changes in the Asian monsoon-ENSO relationship: natural or forced? Geophys. Res. Lett. 42, 3502–3512. doi:10.1002/2015GL063557
- Liu, X., An, W., Treydte, K., Shao, X., Leavitt, S. and co-authors. 2012. Tree-ring δ18O in southwestern china linked to variations in regional cloud cover and tropical sea surface temperature. Chem. Geol. 291, 104–115. doi:10.1016/j.chemgeo.2011.10.001
- Liu, X., Shao, X., Liang, E., Chen, T., Qin, D. and co-authors. 2009. Climatic significance of tree-ring delta O-18 in the Qilian Mountains, Northwestern China and its relationship to atmospheric circulation patterns. Chem. Geol. 268, 147–154. doi:10.1016/j.chemgeo.2009.08.005
- Liu, X., Xu, G., Grießinger, J., An, W., Wang, W. and co-authors. 2014. A shift in cloud cover over the southeastern Tibetan Plateau since 1600: evidence from regional tree-ring δ18O and its linkages to tropical oceans. Quat. Sci. Rev. 88, 55–68. doi:10.1016/j.quascirev.2014.01.009
- Liu, X., Zhang, X., Zhao, L., Xu, G., Wang, L. and co-authors. 2017. Tree ring δ18O reveals no long-term change of atmospheric water demand since 1800 in the northern Great Hinggan Mountains, China. J. Geophys. Res. Atmos. 122, 6697–6712. doi:10.1002/2017JD026660
- Liu, Y., Cai, W., Sun, C., Song, H., Cobb, K. M. and co-authors. 2019. Anthropogenic aerosols cause recent pronounced weakening of Asian summer monsoon relative to last four centuries. Geophys. Res. Lett. 46, 5469–5479. doi:10.1029/2019GL082497
- Liu, Y., Cobb, K. M., Song, H., Li, Q., Li, C.-Y. and co-authors. 2017. Recent enhancement of central Pacific El Niño variability relative to last eight centuries. Nat. Commun. 8, 15386. doi:10.1038/ncomms15386
- Liu, Y., Liu, H., Song, H., Li, Q., Burr, G. S. and co-authors. 2017. A monsoon-related 174-year relative humidity record from tree-ring δ18O in the Yaoshan region, eastern central China. Sci. Total Environ. 593-594, 523–534. doi:10.1016/j.scitotenv.2017.03.198
- Liu, Y., Fang, C., Li, Q., Song, H., Ta, W. and co-authors. 2019. Tree-ring δ18O based PDSI reconstruction in the Mt. Tianmu region since 1618 AD and its connection to the East Asian summer monsoon. Ecol. Indic. 104, 636–647. doi:10.1016/j.ecolind.2019.05.043
- Liu, Y., Sun, J., Yang, Y., Cai, Q., Song, H. and co-authors. 2007. Tree-ring-derived precipitation records from Inner Mongolia, China, Since A.D. 1627. Tree-Ring Res. 63, 3–14. doi:10.3959/1536-1098-63.1.3
- Liu, Y., Ta, W., Li, Q., Song, H., Sun, C. and co-authors. 2018. Tree-ring stable carbon isotope-based April–June relative humidity reconstruction since AD 1648 in Mt. Clim. Dyn. 50, 1733–1745. doi:10.1007/s00382-017-3718-6
- Liu, Y., Wang, L., Li, Q., Cai, Q., Song, H. and co-authors. 2019. Asian summer monsoon related relative humidity recorded by tree-ring δ18O during last 205 years. J. Geophys. Res. Atmos. 124, 9824–9838. doi:10.1029/2019JD030512
- Liu, Y., Wang, R., Leavitt, S. W., Song, H., Linderholm, H. W. and co-authors. 2012. Individual and pooled tree-ring stable-carbon isotope series in Chinese pine from the Nan Wutai region, China: common signal and climate relationships. Chem. Geol. 330-331, 17–26. doi:10.1016/j.chemgeo.2012.08.008
- Liu, Y., Zhang, X., Song, H., Cai, Q., Li, Q. and co-authors. 2017. Tree-ring-width-based PDSI reconstruction for central Inner Mongolia, China over the past 333 years. Clim. Dyn. 48, 867–879. doi:10.1007/s00382-016-3115-6
- Lorrey, A. M., Brookman, T. H., Evans, M. N., Fauchereau, N. C., Macinnis-Ng, C. and co-authors. 2016. Stable oxygen isotope signatures of early season wood in New Zealand kauri (Agathis australis) tree rings: prospects for palaeoclimate reconstruction. Dendrochronologia 40, 50–63. doi:10.1016/j.dendro.2016.03.012
- McCarroll, D. and Loader, N. J. 2004. Stable isotopes in tree rings. Quat. Sci. Rev. 23, 771–801. doi:10.1016/j.quascirev.2003.06.017
- Myers, C. G., Oster, J. L., Sharp, W. D., Bennartz, R., Kelley, N. P. and co-authors. 2015. Northeast Indian stalagmite records Pacific decadal climate change: implications for moisture transport and drought in India. Geophys. Res. Lett. 42, 4124–4132. doi:10.1002/2015GL063826
- Nagavciuc, V., Ionita, M., Perșoiu, A., Popa, I., Loader, N. J. and co-authors. 2019. Stable oxygen isotopes in Romanian oak tree rings record summer droughts and associated large-scale circulation patterns over. Clim. Dyn. 52, 6557–6568. doi:10.1007/s00382-018-4530-7
- Rinne, K. T., Loader, N. J., Switsur, V. R. and Waterhouse, J. S. 2013. 400-year May–August precipitation reconstruction for southern England using oxygen isotopes in tree rings. Quat. Sci. Rev. 60, 13–25. doi:10.1016/j.quascirev.2012.10.048
- Roden, J. S., Lin, G. and Ehleringer, J. R. 2000. A mechanistic model for interpretation of hydrogen and oxygen isotope ratios in tree-ring cellulose. Geochimic. Cosmochim. Acta 64, 21–35. doi:10.1016/S0016-7037(99)00195-7
- Sano, M., Ramesh, R., Sheshshayee, M. and Sukumar, R. 2011. Increasing aridity over the past 223 years in the Nepal Himalaya inferred from a tree-ring δ18O chronology. Holocene 22, 809–817.
- Sano, M., Xu, C. and Nakatsuka, T. 2012. A 300-year Vietnam hydroclimate and ENSO variability record reconstructed from tree ring δ18O. J. Geophys. Res. 117, D12115. doi:10.1029/2012JD017749
- Sano, M., Tshering, P., Komori, J., Fujita, K., Xu, C. and co-authors. 2013. May-September precipitation in the Bhutan Himalaya since 1743 as reconstructed from tree ring cellulose δ18O. J. Geophys. Res. Atmos. 118, 8399–8410. doi:10.1002/jgrd.50664
- Saurer, M., Schweingruber, F., Vaganov, E. A., Shiyatov, S. G. and Siegwolf, R. 2002. Spatial and temporal oxygen isotope trends at the northern tree-line in Eurasia. Geophys. Res. Lett. 29, 7–1–7-4.
- Vuille, M., Werner, M., Bradley, R. S. and Keimig, F. 2005. Stable isotopes in precipitation in the Asian monsoon region. J. Geophys. Res. 110, D23108. doi:10.1029/2005JD006022
- Wang, B. 2006. The Asian Monsoon. Springer, Berlin.
- Wang, B. and Ding, Q. 2006. Changes in global monsoon precipitation over the past 56 years. Geophys. Res. Lett. 33, 272–288.
- Wang, B. and Ding, Q. 2008. Global monsoon: dominant mode of annual variation in the tropics. Dyn. Atmos. Oceans 44, 165–183. doi:10.1016/j.dynatmoce.2007.05.002
- Waterhouse, J. S., Switsur, V. R., Barker, A. C., Carter, A. H. C. and Robertson, I. 2002. Oxygen and hydrogen isotope ratios in tree rings: how well do models predict observed values? Earth Planet. Sci. Lett. 201, 421–430. doi:10.1016/S0012-821X(02)00724-0
- Webster, P. J. and Yang, S. 1992. Monsoon and Enso: selectively interactive systems. Q. J. Royal Met. Soc. 118, 877–926. doi:10.1002/qj.49711850705
- Wernicke, J., Hochreuther, P., Grießinger, J., Zhu, H., Wang, L. and co-authors. 2017. Multi-century humidity reconstructions from the southeastern Tibetan Plateau inferred from tree-ring δ18O. Global Planet. Change 149, 26–35. doi:10.1016/j.gloplacha.2016.12.013
- Wernicke, J., Stark, G., Wang, L., Grießinger, J. and Bräuning, A. 2019. Air moisture signals in a stable oxygen isotope chronology of dwarf shrubs from the central Tibetan Plateau. Ann. Bot. 124, 53–64. doi:10.1093/aob/mcz030
- Wigley, T. M. L., Briffa, K. and Jones, G. P. D. 1984. On the average value of correlated time series, with applications in dendroclimatology and hydrometeorology. J. Clim. Appl. Meteor. 23, 201–213. doi:10.1175/1520-0450(1984)023<0201:OTAVOC>2.0.CO;2
- Xiao, J., Zhang, S., Fan, J., Wen, R., Zhai, D. and co-authors. 2018. The 4.2 ka BP event: multi-proxy records from a closed lake in the northern margin of the East Asian summer monsoon. Clim. Past 14, 1417–1425. doi:10.5194/cp-14-1417-2018
- Xu, C., Ge, J., Nakatsuka, T., Yi, L., Zheng, H. and co-authors. 2016. Potential utility of tree ring δ18O series for reconstructing precipitation records from the lower reaches of the Yangtze River, southeast China. J. Geophys. Res. Atmos. 121, 3954–3968. doi:10.1002/2015JD023610
- Xu, C., Sano, M., Dimri, A. P., Ramesh, R., Nakatsuka, T. and co-authors. 2018. Decreasing Indian summer monsoon on the northern Indian sub-continent during the last 180 years: evidence from five tree-ring cellulose oxygen isotope chronologies. Clim. Past 14, 653–664. doi:10.5194/cp-14-653-2018
- Xu, C., Shi, J., Zhao, Y., Nakatsuka, T., Sano, M. and co-authors. 2019. Early summer precipitation in the lower Yangtze River basin for AD 1845–2011 based on tree-ring cellulose oxygen isotopes. Clim. Dyn. 52, 1583–1594. doi:10.1007/s00382-018-4212-5
- Xu, C., Zheng, H., Nakatsuka, T. and Sano, M. 2013. Oxygen isotope signatures preserved in tree ring cellulose as a proxy for April–September precipitation in Fujian, the subtropical region of southeast China. J. Geophys. Res. Atmos. 118, 12,805–805. doi:10.1002/2013JD019803
- Xu, G., Liu, X., Trouet, V., Treydte, K., Wu, G. and co-authors. 2019. Regional drought shifts (1710–2010) in East Central Asia and linkages with atmospheric circulation recorded in tree-ring δ18O. Clim. Dyn. 52, 713–727. doi:10.1007/s00382-018-4215-2
- Yang, H., Johnson, K. R., Griffiths, M. L. and Yoshimura, K. 2016. Interannual controls on oxygen isotope variability in Asian monsoon precipitation and implications for paleoclimate reconstructions. J. Geophys. Res. Atmos. 121, 8410–8428. doi:10.1002/2015JD024683
- Young, G. H. F., Loader, N. J., McCarroll, D., Bale, R. J., Demmler, J. C. and co-authors. 2015. Oxygen stable isotope ratios from British oak tree-rings provide a strong and consistent record of past changes in summer rainfall. Clim. Dyn. 45, 3609–3622. doi:10.1007/s00382-015-2559-4
- Yu, J.-Y. and Kao, H.-Y. 2007. Decadal changes of ENSO persistence barrier in SST and ocean heat content indices: 1958-2001. J. Geophys. Res. 112, D13106. doi:10.1029/2006JD007654
- Zeng, X., Liu, X., Evans, M. N., Wang, W., An, W. and co-authors. 2016. Seasonal incursion of Indian Monsoon humidity and precipitation into the southeastern Qinghai–Tibetan Plateau inferred from tree ring δ18O values with intra-seasonal resolution. Earth Planet. Sci. Lett. 443, 9–19. doi:10.1016/j.epsl.2016.03.011
- Zhang, Q., Tao, S. and Chen, L. 2003. The inter-annual variability of East Asian summer monsoon indices and its association with the pattern of general circulation over East Asia (in Chinese). Acta Meteorol. Sin. 61, 559–568.
- Zhang, X., Liu, Y., Song, H., Cai, Q., Li, Q. and co-authors. 2017. Interannual variability of PDSI from tree-ring widths for the past 278 years in Baotou. China Trees 31, 1531–1541. doi:10.1007/s00468-017-1567-x
- Zhu, M., Stott, L., Buckley, B., Yoshimura, K. and Ra, K. 2012. Indo-pacific warm pool convection and ENSO since 1867 derived from Cambodian pine tree cellulose oxygen isotopes. J. Geophys. Res. 117, D11307. doi:10.1029/2011JD017198