
 ?Mathematical formulae have been encoded as MathML and are displayed in this HTML version using MathJax in order to improve their display. Uncheck the box to turn MathJax off. This feature requires Javascript. Click on a formula to zoom.
Abstract
High-precision triple oxygen isotope analysis of water has given rise to a novel second-order parameter, 17O-excess (often denoted as Δ17O), which describes the deviation from a reference relationship between δ18O and δ17O. This tracer, like deuterium excess (d-excess), is affected by kinetic fractionation (diffusion) during phase changes within the hydrologic cycle. However, unlike d-excess, 17O-excess is present in paleowater proxy minerals and is not thought to vary significantly with temperature. This makes it a promising tool in paleoclimate research, particularly in relatively arid continental regions where traditional approaches have produced equivocal results. We present new δ18O, δ17O, and δ2H data from stream waters along two east–west transects in the Pacific Northwest to explore the sensitivity of 17O-excess to topography, climate, and moisture source. We find that discrepancies in d-excess and 17O-excess between the Olympic Mountains and Coast Range are consistent with distinct moisture source meteorology, inferred from air-mass back trajectory analysis. We suggest that vapor d-excess is affected by relative humidity and temperature at its oceanic source, whereas 17O-excess vapor is controlled by relative humidity at its oceanic source. Like d-excess, 17O-excess is significantly affected by evaporation in the rain shadow of the Cascade Mountains, supporting its utility as an aridity indicator in paleoclimate studies where δ2H data are unavailable. We use a raindrop evaporation model and local meteorology to investigate the effects of subcloud evaporation on d-excess and 17O-excess along altitudinal transects. We find that subcloud evaporation explains much, but not all of observed increases in d-excess with elevation and a minor amount of 17O-excess variation in the Olympic Mountains and Coast Range of Oregon.
17O-excess correlates spatially with relative humidity across the Pacific Northwest, supporting its use as an aridity indicator in paleoclimate studies.
Discrepancies in d-excess and 17O-excess between the Olympic Mountains and Oregon Coast Range suggest that their moisture source is different.
Subcloud evaporation explains most of observed increases in d-excess with elevation, and a minor amount of 17O-excess variation in the Olympic Mountains and Oregon Coast Range.
Key Points
1. Introduction
The isotopic composition of meteoric water (δ18O, δ2H, and increasingly, δ17O) has been used extensively to investigate the hydrologic cycle. This is because stable isotopes fractionate during phase changes in often predictable ways as a function of their environment (Dansgaard, Citation1964), enabling an understanding of the oceanic source of continental moisture (Gupta et al., Citation2005), the relative contribution of glacier melt to surface water (Karim and Veizer, Citation2002; Fan et al., Citation2015), the amount of surface water recycling in arid to semi-arid regions (Bershaw et al., Citation2016; Wang et al., Citation2016b; Li and Garzione, Citation2017), and mechanisms of precipitation (Rozanski et al., Citation1993; Risi et al., Citation2008; Rohrmann et al., Citation2014). In addition, stable isotope geochemistry has also been applied to the rock record using a variety of proxies for paleowater that constrain environmental change on geologic timescales, including paleoclimate and paleoaltimetry investigations (e.g. Garzione et al., Citation2000; Mulch et al., Citation2006; Wang et al., Citation2008; Kent-Corson et al., Citation2009; Bershaw et al., Citation2010; Leier et al., Citation2013; Saylor and Horton, Citation2014; Kar et al., Citation2016).
Though stable isotopes of both oxygen (δ18O) and hydrogen (δ2H) have great utility, explanations of observed isotopic patterns are often underconstrained, resulting in non-unique interpretations (e.g. Ehlers and Poulsen, Citation2009; Galewsky, Citation2009; Botsyun et al., Citation2019). The combination of δ18O and δ2H, expressed as deuterium excess (d-excess), adds constraints to modern water isotope interpretation as d-excess is uniquely sensitive to relative humidity during evaporation, both at the moisture source (an ocean, sea, or continental surface water) and as precipitation falls through an unsaturated air column (subcloud evaporation) (Gat and Carmi, Citation1970; Tian et al., Citation2007; Froehlich et al., Citation2008; Uemura et al., Citation2008; Bershaw et al., Citation2012). However, d-excess is challenging to obtain from the rock record as most minerals used to reconstruct paleoclimate reflect either oxygen or hydrogen, not both. 17O-excess (often denoted as Δ17O) has been shown to respond similarly to d-excess (Landais et al., Citation2010; Uemura et al., Citation2010), but only requires preservation of oxygen to measure, as it is a function of δ18O and δ17O. This is promising for paleoclimate research, as shown in preliminary studies of δ17O in sedimentary carbonates (Passey et al., Citation2014; Passey and Ji, Citation2019).
Although there are a growing number of studies on 17O-excess patterns in polar ice and snow (Landais et al., Citation2008; Risi et al., Citation2010; Winkler et al., Citation2011; Landais et al., Citation2012; Schoenemann et al., Citation2014), meteoric water on the continental scale (Luz and Barkan, Citation2010; Li et al., Citation2015), and in tropical moisture (Landais et al., Citation2010), patterns of 17O-excess along altitudinal transects across stark changes in climate are not well characterized and understood. Here, we present stable isotope data (d-excess and 17O-excess) from surface water along two altitudinal transects in the Pacific Northwest () to investigate the relationship between isotopic parameters and both climate and topography. Our results suggest that subcloud evaporation impacts meteoric water d-excess (and 17O-excess) up the windward side of mountain ranges, consistent with altitudinal transects elsewhere (Froehlich et al., Citation2008; Kong et al., Citation2013; Bershaw, Citation2018). However, both d-excess and 17O-excess increase with elevation more than the modeling of subcloud evaporation predicts, raising the possibility that upper tropospheric and/or stratospheric water vapor is influencing the isotopic composition of meteoric water in the mountains (e.g. Bony et al., Citation2008; Blossey et al., Citation2010; Galewsky and Samuels‐Crow, 2014; Samuels‐Crow et al., Citation2014; Salmon et al., Citation2019). In addition, isotopic differences between transects suggest that the moisture source for precipitation in the Olympic Mountains is significantly different from that in the Coast Range of Oregon. Lastly, we show that both d-excess and 17O-excess are significantly affected by evaporation in the rain shadow of the Cascade Mountains, confirming that 17O-excess can be used in paleoclimate research to constrain aridity.
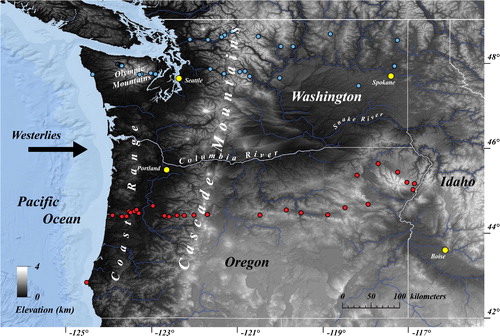
Fig. 1. Location map showing two east–west transects that were sampled across mountain ranges in the Pacific Northwest. The southern transect is at ∼44.6° and crosses Oregon (red circles). The northern transect is at ∼47.8° and crosses Washington (blue circles). Both transects dissect two major mountain ranges, the Coast Range and Cascade Mountains in Oregon and the Olympic and Cascade Mountains in Washington. Moisture is typically brought into the study area by westerlies with significant rainout on the windward (western) flank of the Coast Range, Olympic Mountains, and Cascade Mountains. A substantial rain shadow exists east of the Cascade Mountains. The background digital elevation map (DEM) is from the Shuttle Radar Topography Mission (SRTM).
2. Background
2.1. Climate
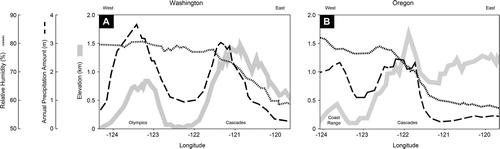
Pacific Northwest climate is shaped by its mid-latitude location in the northern hemisphere where westerlies dominate throughout most of the year. The climate is characterized as Mediterranean in that winters are wet and summers are dry. Precipitation seasonality is influenced by the Aleutian Low during the winter and Pacific High during the summer (Whiteman, Citation2000). In the wet season (winter), moist southwesterly air comes into contact with cooler polar air, often resulting in steady precipitation. When this moist air encounters the Pacific Northwest coast, it cools over the land surface. Precipitation is a combination of cyclonic convergence and convection, intensified by an orographic component on the windward (west) flanks of the Olympic Mountains (Washington), Coast Range (Oregon), and Cascade Mountains inland. Orographic enhancements on the windward side of the Cascades are thought to increase precipitation amounts by a factor of 2–3 (Hobbs et al., Citation1975; Dettinger et al., Citation2004). Precipitation maxima have been shown to follow smoothed topography (e.g. Pedgley, Citation1970), though erratic patterns can exist due to deep valleys and convective activity (Barry, Citation2008). In the Coast Range of Oregon and the Olympic Mountains, annual precipitation amounts increase with elevation up to the range crests. In the Cascade Mountains, annual precipitation amounts start to decrease before reaching the range crest (upwind to the west) (). This is consistent with models of orographic precipitation where the generation of condensation decreases exponentially with elevation, leaving the crests of large mountain ranges relatively dry (Roe, Citation2005). A rain shadow extends into the lee (east) of the Cascade Mountains associated with relatively arid conditions across the inland Pacific Northwest. The stark contrast in precipitation amount across the region is exemplified by the Hoh rain forest on the west side of the Olympic Mountains (Washington) which receives up to 400 cm annually, while Richland, a town located in the lee of the Cascade Mountains receives less than 20 cm of precipitation (Whiteman, Citation2000). By summer, the polar jet stream shifts northward and high-pressure cells associated with the subtropical horse latitudes develop over the north Pacific and continental interior, resulting in persistently dry conditions from late June to September.
Fig. 2. Plot of climate parameters versus longitude for both the Washington (A) and Oregon (B) transects. For the Olympic Mountains (Washington) and Coast Range (Oregon), precipitation amount increases to the highest elevations. For the Cascades, precipitation amount and relative humidity start to decrease before reaching the range crest. Climate information is derived from the PRISM 30-year normals at 800 m resolution. Relative humidity is estimated from mean annual temperature and mean annual dew point temperature using Eq. (4) in Supplementary Materials. Elevation information is derived from a 200 m resolution digital elevation model (DEM) from the Shuttle Radar Topography Mission (SRTM). Each curve represents the average value along a 100 km swath centered along each transect at (A) 47.8° and (B) 44.5° latitudes.
2.2. Notation and isotope systematics
Changes in the ratio of water isotopes (Rx) are expressed with respect to Vienna Standard Mean Ocean Water (RVSMOW) in delta notation (δ) and expressed as per mil (‰):
(1)
(1)
The relationship between δ18O and δ2H for meteoric waters is defined as the global meteoric water line (GMWL) and defined by Craig (Citation1961) as:
(2)
(2)
The y-intercept of this line is referred to as d-excess, which can vary significantly based on local environmental conditions, such as the temperature of condensation, the amount of subcloud evaporation during rainout, and the degree of local moisture recycling (Jouzel and Merlivat, Citation1984; Rank and Papesch, Citation2005; Gat and Airey, Citation2006; Liotta et al., Citation2006; Froehlich et al., Citation2008; Kurita and Yamada, Citation2008; Cui et al., Citation2009; Kong et al., Citation2013; Wang et al., Citation2016a). A direct relationship between d-excess and elevation is observed in the Himalaya and on the windward side of mountains generally, where high elevations are associated with relatively high d-excess values of surface water (Froehlich et al., Citation2008; Bershaw et al., Citation2012; Kong et al., Citation2013). This is largely due to greater degrees of subcloud evaporation at lower elevations as raindrops fall through a relatively tall and warm air column, decreasing d-excess values of precipitation at low elevations. High d-excess values associated with vapor from the relatively dry upper troposphere may also contribute (Galewsky and Samuels‐Crow, 2014).
The relationship between δ18O and δ17O is often shown in natural log space, where meteoric waters generally plot along a slope (λ) of 0.528 (Luz and Barkan, Citation2010). This is slightly less than the slope of water undergoing pure equilibrium fractionation (0.529 ± 0.001) (Barkan and Luz, Citation2005) and higher than the slope of water vapor diffusing through air (0.5185 ± 0.0003) (Barkan and Luz, Citation2007). Similar to the GMWL for δ18O and δ2H, the reference line for δ17O and δ18O in meteoric waters defines an average 17O-excess of 37 ppm (per meg, 0.001‰, or 10−6) and is defined by Luz and Barkan (Citation2010) as:
(3)
(3)
Miller (Citation2018) suggests that the slope is lower for meteoric waters outside Antarctica (λ = 0.527), which would increase 17O-excess values calculated using EquationEq. (3)(3)
(3) (e.g. Uechi and Uemura, Citation2019). Like d-excess, 17O-excess is thought to be affected by relative humidity during evaporation (Landais et al., Citation2010; Li et al., Citation2015), but not as sensitive as d-excess to temperature (Angert et al., Citation2004).
3. Methods
3.1. Water sampling and analysis
Our strategy was to collect stream water along two east–west transects in the Pacific Northwest to investigate the relationship between stable isotopes (δ18O, δ17O, and δ2H), climate, and topography on the windward and leeward side of mountain ranges (). We targeted stream waters as these have been shown to integrate numerous precipitation events, similar to what is observed in long-term precipitation records (Kendall and Coplen, Citation2001). We followed the approach of Garzione et al. (Citation2000) by sampling small catchments (<100 km2) when possible in order to minimize the elevation range and catchment area represented by each water sample. However, in arid regions where active tributaries are scarce in summer months, water from larger rivers was collected. In total, 58 stream water samples, three lake samples, and one ocean water sample were collected in water-tight plastic containers. Samples were kept refrigerated prior to isotopic analysis.
High-precision triple water-isotope ratios were measured at the University of Washington’s Isolab with a Picarro L2140-i, a cavity ring-down spectroscopy analyzer with laser-current-tuned cavity resonance (Steig et al., Citation2014). Data were normalized to the VSMOW-SLAP scale (Schoenemann et al., Citation2013), which assumes SLAP values of δ18O = −55.5‰, 17O-excess = 0 ppm, and gives a reference slope (λ) between δ18O and δ17O in natural log space of 0.528. Samples were measured in triplicate according to Schauer et al. (Citation2016) and values presented are an average of these. Measurement precision for δ18O, δ2H, d-excess, δ17O, and 17O-excess is 0.07‰, 0.42‰, 0.46‰, 0.04‰, and 8 ppm respectively, where precision is the root mean square error (Schauer et al., Citation2016).
4. Results
We present stream water δ18O, δ17O, and δ2H values for two different east–west transects in the Pacific Northwest. One spans northern Oregon (45°N) from the Pacific Ocean east to Idaho (∼600 km inland) and includes 28 stream water samples and one lake sample. The second is a similar length transect east–west, but across north-central Washington (48°N) and includes samples from 30 streams and two lakes. We also sampled the ocean once on the central Oregon Coast ( and ).
Table 1. Location information, isotopic data, and meteorological parameters for each sample site and associated watershed. δ17O values are shown to 4 decimal places per Schoenemann et al. (Citation2013).
δ18O and d-excess values generally become more negative inland (eastward) with averages of −9.2‰ and 7.2‰ respectively for all Coast Range samples, compared to averages of −13.8‰ and −0.4‰ respectively for all samples east of the Cascades Mountains. The behavior of 17O-excess is more varied, with relatively high values in the Coast Range (average = 30 ppm), lower values in the Cascades (average = 25 ppm), and similar to slightly higher values east of the Cascades (average = 26 ppm).
The local meteoric water line (LMWL) for all samples has a slope of 8.9 (R2 = 0.96) (), which is higher than the Global Meteoric Water Line (GMWL) slope of 8. When only stream water samples collected from east of the Cascades (rain shadow) are considered, the LMWL slope is 5.2 (R2 = 0.77) with an average d-excess value of −0.4‰ (). When only Coast Range (Oregon) and Olympic Mountains (Washington) stream samples are considered, the LMWL slope is 8.1 (R2 = 0.99) with an average d-excess value of 7.8‰ (not shown). These differences suggest that subcloud and surface water evaporation east of the Cascades (rain shadow) is the likely cause of a LMWL slope > 8 for all samples, as eastern samples with lower δ18O and δ2H values plot below the GMWL (lower d-excess).
Fig. 3. (A) Plot of δ18O versus δ2H for all samples analyzed in this study. Circles are stream samples and squares are lake samples. Solid symbols are from west of the Cascades Mountains and open symbols are from east of the Cascades. The slope of the Local Meteoric Water Line (LMWL) (solid) is slightly higher than the Global Meteoric Water Line (GMWL) (dashed) at 8.86 versus 8, respectively. Significant evaporation in the rain shadow of the Cascade Mountains (east) lowering d-excess in more distilled (continental) samples is likely the primary cause as the LMWL for Oregon Coast Range and Olympic Mountain samples (not shown) has a slope similar to the GMWL (y = 8.1x + 9.3; R2 = 0.99). (B) Plot of ln(δ18O/1000 + 1) and ln(δ17O/1000 + 1) for all samples analyzed in this study. This is the same sample population shown in (A). The mass-dependent fractionation coefficient (λ) for all samples is 0.5280 ± 0.0005. This is close to the theoretically determined coefficient for equilibrium fractionation of water (λ = 0.529 ± 0.001) (Barkan and Luz, Citation2005) and the same as that observed in meteoric waters (λ = 0.528) (Meijer and Li, Citation1998; Luz and Barkan, Citation2010). Uncertainty in δ18O, δ2H, d-excess, δ17O, and 17O-excess are 0.07‰, 0.42‰, 0.46‰, 0.04‰, and 8 ppm, respectively.
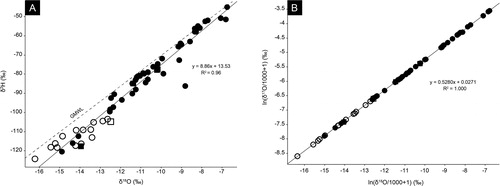
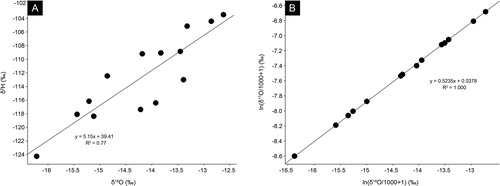
Fig. 4. (A) Plot of δ18O versus δ2H for stream samples in the rain shadow (east) of the Cascade Mountains in Washington (> −119° longitude) and Oregon (> −121° longitude). The slope, m, of the Local Meteoric Water Line (LMWL) is significantly lower than the Global Meteoric Water Line (GMWL) (m = 5.15 versus m = 8), reflecting the influence of evaporation under relatively arid conditions. (B) Plot of ln(δ18O/1000 + 1) and ln(δ17O/1000 + 1) for the same sample population as (A). The slope (λ) is 0.5235, significantly lower than that observed for meteoric water globally (λ = 0.528) (Luz and Barkan, Citation2010). Sample OR641 has been excluded from plots due to anomalously high δ18O, δ17O, and δ2H values. Uncertainty in δ18O and δ2H values are less than 0.07‰ and 0.42‰, respectively.
The oxygen isotope fractionation coefficient (λ) for all stream and lake samples analyzed in this study is 0.5280 ± 0.0005 (). This is close to the theoretically determined coefficient for equilibrium fractionation of water (λ = 0.529 ± 0.001) (Barkan and Luz, Citation2005) and the same as that observed in meteoric waters generally (λ = 0.528) (Meijer and Li, Citation1998; Luz and Barkan, Citation2010).
5. Discussion
5.1. Isotopic lapse rates
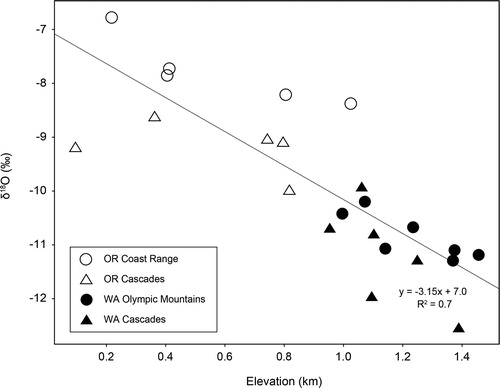
An isotopic lapse rate (change in δ18O of meteoric water with elevation) is observed on the windward sides of both the Coast Range and Cascade Mountains for stream samples of −3.15 ‰/km (R2 = 0.7) (). This is similar to the average for mountains generally which is −2.8 ‰/km (Poage and Chamberlain, Citation2001) and indicates that Rayleigh distillation of air masses is occurring, creating an ‘altitude effect’, or inverse relationship between δ18O and elevation, for ranges in the Pacific Northwest (e.g. Rozanski et al., Citation1993). However, we do not observe a significant relationship between δ18O and elevation east of the Cascade Mountains (R2 = 0.17), likely because evaporation is significantly affecting the isotopic composition of sampled surface water at relatively high elevations. Thus, the modern isotopic lapse rate from the Coast Range and Cascade Mountains applied to the isotopic composition of paleowater proxies from the rain shadow is likely to predict erroneously low elevations due to evaporative enrichment.
Fig. 5. Plot of δ18O versus elevation for the windward side of the Olympic Mountains (solid circles) and Cascades (solid triangles) in Washington, and the Coast Range (open circles) and Cascades (open triangles) in Oregon. Note that elevation is on the x-axis and δ18O is on the y-axis. A linear regression through these data shows an isotopic lapse rate of −3.2‰/km of elevation gain, similar to the global average of −2.8‰/km (Poage and Chamberlain, Citation2001). Elevation is reported as mean basin hypsometry and is derived from a DEM from the SRTM at ∼200 m resolution.
5.2. Subcloud evaporation
A positive relationship between d-excess and elevation along the windward side of mountain ranges has been observed globally and is interpreted, in part, as a decrease in subcloud evaporation of raindrops as elevation increases (Froehlich et al., Citation2008; Kong et al., Citation2013; Bershaw, Citation2018). Relatively low temperatures of condensation at high elevations also cause an increase in d-excess of precipitation (∼0.3‰/−1 °C) based on empirically derived fractionation experiments (Majoube, Citation1971). High d-excess values in vapor from the relatively dry upper troposphere may also contribute (e.g. Bony et al., Citation2008; Blossey et al., Citation2010; Galewsky and Samuels‐Crow, 2014; Samuels‐Crow et al., Citation2014; Salmon et al., Citation2019).
On the windward side of the Olympic Mountains and Coast Range of Oregon, we observe this positive relationship between d-excess and elevation (). Linear regressions through these two sample populations give R2 values of 0.6 (p value = 0.02) and 0.8 (p value = 0.04), respectively. For the Olympics, if the lowest elevation sample is removed (DHOW-20), the R2 decreases to 0.3. A lower correlation coefficient in the Olympic Mountains relative to the Coast Range may be due to larger amounts of high elevation snow. The crest of the Olympic Mountains receives annual average snowfall of ∼10 m while precipitation in the central Coast Range of Oregon occurs largely as rain due to its lower elevations (). Falling snow is not affected by subcloud evaporation, but its meltwater contributes significantly to streams. That said, linear regressions through each transect have similar slopes () suggesting that processes responsible for increases in d-excess with elevation are similar for both ranges.
Fig. 6. Plot of d-excess versus elevation for samples from the windward side of the (A) Olympic Mountains (triangles) and (B) Oregon Coast Range (circles). Right-angle arrows show where the cloud base is inferred to intersect with the ground surface, above which there is no subcloud evaporation (relative humidity is 100%). We estimate this is roughly ∼750 m for the Olympics and 500 m for the Oregon Coast Range based on the elevation of maximum precipitation amount (). The open symbols show d-excess values of precipitation at the cloud base estimated from a subcloud evaporation model. Subcloud evaporation explains much of the difference between high and low elevation samples. Linear regressions through each transect have similar slopes suggesting that there is a similar reduction in subcloud evaporation with elevation for both ranges. The difference in y-intercept is likely due to unique moisture provenance for each transect as shown in . Elevation is reported as mean basin hypsometry and is derived from a DEM from the SRTM at ∼200 m resolution. Uncertainty in d-excess values is ±0.46‰.
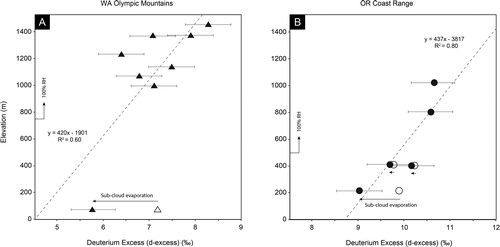
We estimate the effect of subcloud evaporation on d-excess across the windward side of the Coast Range in Oregon and Olympic Mountains in Washington using a model of subcloud evaporation based on local meteorology. Estimated d-excess values of precipitation at the cloud base (unaffected by subcloud evaporation) are shown as open symbols in , suggesting that the majority of d-excess changes with elevation can be explained by subcloud evaporation, consistent with the windward side of ranges elsewhere (Bershaw, Citation2018). Generally, subcloud evaporation decreases with elevation as the average surface air temperature decreases and relative humidity of the unsaturated air column increases. Our modeled change in raindrop d-excess as a function of the amount evaporated is about −1‰/1%, consistent with studies in the Tian Shan of Central Asia (Kong et al., Citation2013; Wang et al., Citation2016b). Input parameters are generally consistent with modeling of d-excess in the Alps (Froehlich et al., Citation2008) and the Tian Shan of China (Kong et al., Citation2013). Please refer to the Supplementary Materials for a description of model assumptions and equations.
Unlike d-excess, we do not observe a clear relationship between 17O-excess and elevation for the windward Olympic Mountains and Coast Range of Oregon (). Linear regressions through these two sample populations give R2 values of 0.5 (p value = 0.05) and 0.1 (p value = 0.65), respectively. Scatter in 17O-excess may simply be due to analytical uncertainty, which has a lower signal-to-noise ratio relative to d-excess. That said, along the Olympic Mountains transect (), it appears that higher elevation samples have higher 17O-excess values than the low elevation sample in excess of analytical uncertainty (±8 ppm), similar to trends in d-excess. More data are needed as this observation is based on one low elevation sample and the Oregon Coast Range transect does not show a clear pattern ().
Fig. 7. Plot of 17O-excess versus elevation for samples from the windward side of (A) the Olympic Mountains (triangles) and (B) Oregon Coast Range (circles). Right-angle arrows show where the cloud base is inferred to intersect with the ground surface, above which there is no subcloud evaporation (relative humidity is 100%). This is roughly ∼750 m for the Olympics and 500 m for the Oregon Coast Range based on the elevation of maximum precipitation amount (). The open symbols show 17O-excess values of precipitation at the cloud base estimated from a subcloud evaporation model. Though there is significant scatter, the disparity between low- and high-elevation samples does not appear to be explained by subcloud evaporation alone. Elevation is reported as mean basin hypsometry and is derived from a DEM from the SRTM at ∼200 m resolution. Uncertainty in 17O-excess values is ±8 ppm.
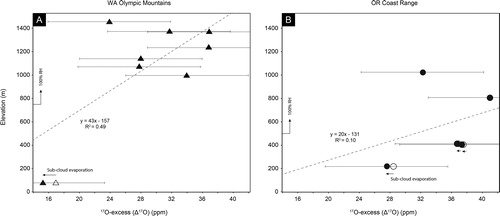
Previous studies have suggested that 17O-excess is affected by subcloud evaporation on the continental scale (Li et al., Citation2015) and in the tropics (Landais et al., Citation2010). We use this same subcloud evaporation model described above to predict 17O-excess of unevaporated precipitation at the cloud base (open symbols in ). The model predicts a change of −1 ppm/1% of raindrop evaporated fraction. Unlike d-excess, the effect of subcloud evaporation on 17O-excess is minor relative to variation with elevation. This suggests that 17O-excess changes with elevation are more likely related to analytical uncertainty or are influenced by upper tropospheric and/or lower stratospheric 17O (e.g. Bechtel and Zahn, Citation2003; Webster and Heymsfield, Citation2003; Lin et al., Citation2013; Winkler et al., Citation2013), possibly through tropopause folding events (Shapiro, Citation1980).
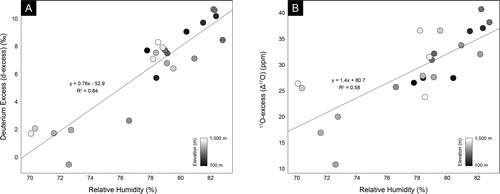
In contrast to the Olympic Mountains and Coast Range of Oregon, the Cascade Mountains in Washington and Oregon do not show a significant relationship between d-excess or 17O-excess and elevation (R2 = 0.18 and 0.17, respectively). We speculate this is because high elevations in the Cascades are relatively dry, resulting in evaporation at both low and high elevations, with a wet band of precipitation in-between (). At mid-latitudes, condensation decreases exponentially with surface height. The decrease in water content of an air mass with height (a function of vapor saturation pressure) is a natural log of temperature as defined by the Clausius–Clapeyron equation, resulting in lower moisture removal rates at higher elevations and thus relatively dry mountain tops (Roe, Citation2005). This is observed in larger mountain ranges and is a reason why precipitation rates maximize at lower elevations on their windward slopes. The effect of relatively dry conditions at high and low elevations in the Cascade Mountains is seen in the plot of relative humidity versus d-excess and 17O-excess for windward Olympic, Coast Range, and Cascade Mountain samples (). The relationship between relative humidity and d-excess (1% per 0.76‰) is within the range observed for precipitation in the Tian Shan of Central Asia (1% per 0.1-1.0‰) (Wang et al., Citation2016b). Though we suspect that evaporation at lower elevations is likely due to subcloud evaporation, the nature of high elevation evaporation in the Cascade Mountains could be a combination of subcloud and surface water evaporation, in addition to sublimation of snow (Lechler and Niemi, Citation2012).
Fig. 8. Plot of d-excess (A) and 17O-excess (B) versus relative humidity (H) for samples from the windward sides of the Coast Range and Cascades. Circles are colored by elevation which is reported as mean basin hypsometry (MBH). Two anomalous samples are not included in this regression. They are DHOW-20 from Ruby Beach, whose PRISM-derived H is anomalously high, likely because it is right next to the ocean, and WA16-1, a shallow, slow moving, and likely highly evaporated stream. Uncertainty in d-excess and 17O-excess values are less than 0.46‰ and 8 ppm, respectively.
5.3. Moisture source
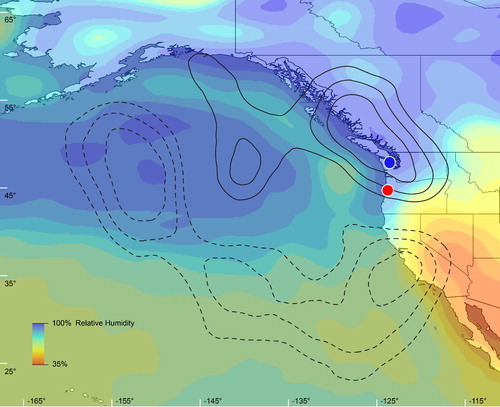
Though both the windward Olympic Mountains and Coast Range exhibit similar slopes in a plot of d-excess versus elevation (), the estimated d-excess values at the cloud base (dc) differ by ∼2.5‰, significantly more than analytical uncertainty in d-excess (0.46‰). At low elevation coastal sites, the d-excess value of precipitation at the cloud base (dc) is estimated as 7.3‰ in the Olympic Mountains and 9.8‰ along the Oregon Coast Range transect. We investigate whether relatively low d-excess values in Olympic mountain water samples compared to Oregon Coast Range samples for the same elevations may be explained by differences in relative humidity at their oceanic source (e.g. Rozanski et al., Citation1993; Jouzel et al., Citation1997; Pfahl and Sodemann, Citation2014). A difference map of air mass back trajectories computed every 6-h over winter months (Oct-Mar) during the years of sampling (2015–2016) shows variation in moisture source between the two transects (). Refer to the Supplementary Materials for a detailed description of back-trajectory calculations. Some stream water sampled in the Olympic Mountains originated to the northwest in Canada where relative humidity is ∼90%, whereas many back trajectories for the Coast Range in Oregon originated to the southwest where relative humidity is lower, averaging ∼80%. The difference in d-excess between the two transects is consistent with observations elsewhere that d-excess negatively correlates with relative humidity for vapor above its oceanic source (e.g. Gat and Carmi, Citation1970; Merlivat and Jouzel, Citation1979; Benetti et al., Citation2014). Colder temperatures of evaporation to the northwest of the study area also promote lower d-excess values in Olympic Mountain water vapor relative to the Oregon Coast Range. Surface air temperatures averaged over the same time period (Oct–Mar during 2015–2016) are about 10 °C colder in northwest Canada compared to the ocean southwest of Oregon (NOAA/NCDC, Citation2010).
Fig. 9. Surface relative humidity during winter months (Oct–Mar) with an overlay of the difference between air parcel provenance for the Olympic Mountains (blue circle and solid contours) compared to the Oregon Coast Range (red circle and dashed contours). Relatively low d-excess values in Olympic mountain water samples compared to Oregon Coast Range samples for the same elevations () are likely due to comparatively high relative humidity (H) over its source area (∼90% H over SW British Columbia compared to ∼80% H over the Pacific Ocean offshore California). A similar pattern is observed in 17O-excess with relatively low values in the Olympic Mountains relative to the Oregon Coast Range (). Refer to the Supplementary Materials section for details on how this map was created including parameters for HYSPLIT back trajectory analysis. Relative humidity is derived from the NCEP/NCAR reanalysis dataset for years 2015–2016 (Kalnay et al., Citation1996).
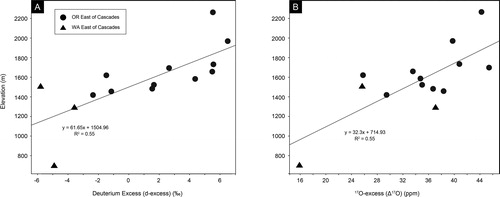
For 17O-excess, the subcloud evaporation model predicts a difference between transects in cloud base precipitation (Δ17Oc) of ∼11 ppm (). At low elevation coastal sites, the 17O-excess value of precipitation at the cloud base (Δ17Oc) is estimated as 17 ppm in the Olympic Mountains and 28 ppm along the Oregon Coast Range transect. Unlike d-excess, we speculate that this variation is a function of differences in relative humidity at the source, not temperature, as changes in 17O-excess related to the temperature of mass-dependent equilibrium fractionation are minimal (Angert et al., Citation2004; Landais et al., Citation2008).
5.4. Rain shadow effects
East of the Cascade Mountains in Washington and Oregon, the isotopic composition of stream water is significantly affected by evaporation under semi-arid conditions as relative humidity drops over 15% (). The rain shadow sample population is defined as watersheds with a centroid that is > −119° longitude (Washington) and > −121° longitude (Oregon). Evaporation is shown in the region’s LMWL which has a slope (5.15), much lower than the global average (m = 8) (). It is also shown in a plot of ln(δ18O/1000 + 1) versus ln(δ17O/1000 + 1) for the same sample population, which has a slope (λ) of 0.5235 (), less than the average of meteoric water (λ = 0.528) (Luz and Barkan, Citation2010). This is evidence that δ18O, δ17O, and δ2H are significantly affected by evaporation under a relatively dry climate in the rain shadow of the Cascade Mountains. That said, 17O-excess and d-excess show weak to non-existent relationships with relative humidity in the rain shadow (R2 = 0.6 and 0.2, respectively, not shown). High 17O-excess and d-excess values are generally associated with low relative humidity in the rain shadow, the opposite of what we observe to the west of the Cascades (the latter shown in ). Interestingly, both isotopic parameters show a weak positive correlation with elevation in the rain shadow (), suggesting subcloud evaporation of raindrops is affecting low-elevation samples more than high. Though high elevations are dry, subcloud evaporation is likely minimal considering average temperatures during winter months at high elevations are near freezing. Upper tropospheric and/or stratospheric vapor may also be influencing the isotopic composition of precipitation at high elevations (e.g. Bony et al., Citation2008; Blossey et al., Citation2010; Galewsky and Samuels‐Crow, 2014; Samuels‐Crow et al., Citation2014; Salmon et al., Citation2019).
Fig. 10. Plot of (A) d-excess and (B) 17O-excess versus elevation for samples from the leeward (east) side of the Cascade Mountains in Washington (triangles) and Oregon (circles). Eastern population is defined as sample watersheds with a centroid that is > −119° longitude (Washington) and > −121° longitude (Oregon). Elevation is reported as mean basin hypsometry and is derived from a DEM from the SRTM at ∼200 m resolution. Uncertainty in d-excess and 17O-excess values are less than 0.46‰ and 8 ppm respectively.
It is also likely that evaporation of water from the ground surface is significantly affecting d-excess and 17O-excess in eastern Washington and Oregon, particularly at low elevations. The closest Global Network of Isotopes in Precipitation (GNIP) site east of the Cascades is Orem, Utah, which exhibits a LMWL slope of m = 6.9 (R2 = 0.99) (IAEA/WMO, Citation2018). Because GNIP sites collect precipitation samples, evaporation occurs while raindrops are falling through the air column, not from the ground. Our stream water samples from eastern Washington and Oregon have a slope that is significantly lower than this (m = 5.15) (). Assuming that the GMWL represents a minimally evaporated end member (m = 8), the relative difference in slopes suggests that on average, the majority of evaporation in the Cascade Mountain rain shadow is occurring on the surface (∼60%), sometime after the raindrop hits the ground.
6. Conclusions
Second-order isotopic parameters, d-excess and 17O-excess from surface waters collected across the Pacific Northwest show the influence of kinetic fractionation (diffusion) during evaporation at all stages of the hydrologic cycle. Differences in relative humidity at the oceanic sources of Olympic Mountain (Washington) and Coast Range (Oregon) stream water are reflected in d-excess and 17O-excess values. Our subcloud evaporation model for falling raindrops largely accounts for changes in d-excess with elevation on the windward sides of these ranges. Our model of subcloud evaporation does not explain observed variation in 17O-excess with elevation, possibly due to analytical uncertainty or the influence of upper tropospheric and/or stratospheric vapor at high elevations. From the Cascade Mountains eastward, the relationship between d-excess, 17O-excess, and elevation is weak, possibly because topography exceeds the moisture scale height, resulting in dry air at high elevations (Roe, Citation2005). In the Cascade Mountain rain shadow across eastern Washington and Oregon, subcloud and surface water evaporation is significant. The observation that 17O-excess is significantly affected by evaporation in the lee of the Cascade Mountains confirms its utility as a proxy for aridity in paleoclimate research.
Supplemental Material
Download MS Excel (34.5 KB)Supplemental Material
Download MS Word (50.8 KB)Disclosure statement
No potential conflict of interest was reported by the authors.
References
- Angert, A., Cappa, C. D. and DePaolo, D. J. 2004. Kinetic 17O effects in the hydrologic cycle: Indirect evidence and implications. Geochim. Cosmochim. Acta 68, 3487–3495. doi:10.1016/j.gca.2004.02.010
- Barkan, E. and Luz, B. 2005. High precision measurements of 17O/16O and 18O/16O ratios in H2O. Rapid Commun. Mass Spectrom. 19, 3737–3742. doi:10.1002/rcm.2250
- Barkan, E. and Luz, B. 2007. Diffusivity fractionations of H2(16)O/H2(17)O and H2(16)O/H2(18)O in air and their implications for isotope hydrology. Rapid Commun. Mass Spectrom. 21, 2999–3005. doi:10.1002/rcm.3180
- Barry, R. 2008. Mountain Weather and Climate. 3rd ed. Cambridge: Cambridge University Press, p. 506.
- Bechtel, C. and Zahn, A. 2003. The isotope composition of water vapour: A powerful tool to study transport and chemistry of middle atmospheric water vapour. Atmos. Chem. Phys. Discuss. 3, 3991–4036. doi:10.5194/acpd-3-3991-2003
- Benetti, M., Reverdin, G., Pierre, C., Merlivat, L., Risi, C. and co-authors. 2014. Deuterium excess in marine water vapor: Dependency on relative humidity and surface wind speed during evaporation. J. Geophys. Res. Atmos. 119, 584–593. doi:10.1002/2013JD020535
- Bershaw, J. 2018. Controls on deuterium excess across Asia. Geosciences 8, 257. doi:10.3390/geosciences8070257
- Bershaw, J., Garzione, C. N., Higgins, P., MacFadden, B. J., Anaya, F. and co-authors. 2010. Spatial-temporal changes in Andean plateau climate and elevation from stable isotopes of mammal teeth. Earth Planet. Sci. Lett. 289, 530–538. doi:10.1016/j.epsl.2009.11.047
- Bershaw, J., Penny, S. M. and Garzione, C. N. 2012. Stable isotopes of modern water across the Himalaya and eastern Tibetan Plateau: Implications for estimates of paleoelevation and paleoclimate. J. Geophys. Res. 117, n/a–n/a. doi:10.1029/2011JD016132
- Bershaw, J., Saylor, J. E., Garzione, C. N., Leier, A. and Sundell, K. E. 2016. Stable isotope variations (δ18O and δD) in modern waters across the Andean Plateau. Geochim. Cosmochim. Acta 194, 310–324. doi:10.1016/j.gca.2016.08.011
- Best, A. C. 1950. Empirical formulae for the terminal velocity of water drops falling through the atmosphere. Q. J. R. Meteorol. Soc. 76, 302–311. doi:10.1002/qj.49707632905
- Blossey, P. N., Kuang, Z. and Romps, D. M. 2010. Isotopic composition of water in the tropical tropopause layer in cloud‐resolving simulations of an idealized tropical circulation. J. Geophys. Res 115, D24309. doi:10.1029/2010JD014554
- Bony, S., Risi, C. and Vimeux, F. 2008. Influence of convective processes on the isotopic composition (δ18O and δD) of precipitation and water vapor in the tropics: 1. Radiative-convective equilibrium and Tropical Ocean–Global Atmosphere–Coupled Ocean-Atmosphere Response Experiment (TOGA-COARE) simulations. J. Geophys. Res. 113, D19305. doi:10.1029/2008JD009942
- Botsyun, S., Sepulchre, P., Donnadieu, Y., Risi, C., Licht, A. and co-authors. 2019. Revised paleoaltimetry data show low Tibetan Plateau elevation during the Eocene. Science 363, eaaq1436. doi:10.1126/science.aaq1436
- Caves, J. K., Winnick, M. J., Graham, S. A., Sjostrom, D. J., Mulch, A. and co-authors. 2015. Role of the westerlies in Central Asia climate over the Cenozoic. Earth Planet. Sci. Lett. 428, 33–43. doi:10.1016/j.epsl.2015.07.023
- Craig, H. 1961. Isotopic variations in meteoric waters. Science 133, 1702–1703. doi:10.1126/science.133.3465.1702
- Cui, J., An, S., Wang, Z., Fang, C., Liu, Y. and co-authors. 2009. Using deuterium excess to determine the sources of high-altitude precipitation: Implications in hydrological relations between sub-alpine forests and alpine meadows. J. Hydrol. 373, 24–33. doi:10.1016/j.jhydrol.2009.04.005
- Daly, C., Neilson, R. P. and Phillips, D. L. 1994. A statistical-topographic model for mapping climatological precipitation over mountainous terrain. J. Appl. Meteorol. 33, 140–158. doi:10.1175/1520-0450(1994)033<0140:ASTMFM>2.0.CO;2
- Daly, C., Taylor, G. and Gibson, W. 1997. The PRISM approach to mapping precipitation and temperature. In Proc., 10th AMS Conf. on Applied Climatology. Citeseer, pp. 20–23.
- Dansgaard, W. 1964. Stable isotopes in precipitation. Tellus 16, 436–468.
- Dettinger, M., Redmond, K. and Cayan, D. 2004. Winter orographic precipitation ratios in the Sierra Nevada—Large-scale atmospheric circulations and hydrologic consequences. J. Hydrometeor. 5, 1102–1116. doi:10.1175/JHM-390.1
- Draxler, R. R. and Hess, G. 1998. An overview of the HYSPLIT_4 modelling system for trajectories. Aust. Meteorol. Mag. 47, 295–308.
- Ehlers, T. A. and Poulsen, C. J. 2009. Influence of Andean uplift on climate and paleoaltimetry estimates. Earth Planet. Sci. Lett. 281, 238–248. doi:10.1016/j.epsl.2009.02.026
- Espy, J. 1836. Essays on meteorology. No. IV: North east storms, volcanoes, and columnar clouds. J. Franklin Inst 22, 239–246.
- Fan, Y., Chen, Y., Li, X., Li, W. and Li, Q. 2015. Characteristics of water isotopes and ice-snowmelt quantification in the Tizinafu River, north Kunlun Mountains, Central Asia. Quat. Int. 380-381, 116–122. doi:10.1016/j.quaint.2014.05.020
- Feng, R., Poulsen, C. J., Werner, M., Chamberlain, C. P., Mix, H. T. and co-authors. 2013. Early Cenozoic evolution of topography, climate, and stable isotopes in precipitation in the North American Cordillera. Am. J. Sci. 313, 613–648. doi:10.2475/07.2013.01
- Froehlich, K., Kralik, M., Papesch, W., Rank, D., Scheifinger, H. and co-authors. 2008. Deuterium excess in precipitation of Alpine regions – moisture recycling. Isotopes Environ Health Stud. 44, 61–70. doi:10.1080/10256010801887208
- Galewsky, J. 2009. Rain shadow development during the growth of mountain ranges: An atmospheric dynamics perspective. J. Geophys. Res. 114, F01018. doi:10.1029/2008JF001085
- Galewsky, J. and Samuels-Crow, K. 2014. Water vapor isotopic composition of a stratospheric air intrusion: Measurements from the Chajnantor Plateau. J. Geophys. Res. Atmos. 119, 9679–9691. doi:10.1002/2014JD022047
- Garzione, C. N., Dettman, D. L., Quade, J., DeCelles, P. G. and Butler, R. F. 2000. High times on the Tibetan Plateau; paleoelevation of the Thakkhola Graben. Geology 28, 339–342. doi:10.1130/0091-7613(2000)28<339:HTOTTP>2.0.CO;2
- Gat, J. and Carmi, I. 1970. Evolution of the isotopic composition of atmospheric waters in the Mediterranean Sea area. J. Geophys. Res. 75, 3039–3048. doi:10.1029/JC075i015p03039
- Gat, J. R. and Airey, P. L. 2006. Stable water isotopes in the atmosphere/biosphere/lithosphere interface: scaling-up from the local to continental scale, under humid and dry conditions. Global Planet. Change 51, 25–33. doi:10.1016/j.gloplacha.2005.12.004
- Gupta, S., Deshpande, R., Bhattacharya, S. and Jani, R. 2005. Groundwater δ18O and δD from central Indian Peninsula: Influence of the Arabian Sea and the Bay of Bengal branches of the summer monsoon. J. Hydrol. 303, 38–55. doi:10.1016/j.jhydrol.2004.08.016
- Hobbs, P. V., Houze, R. A., Jr. and Matejka, T. J. 1975. The dynamical and microphysical structure of an occluded frontal system and its modification by orography. J. Atmos. Sci. 32, 1542–1562. doi:10.1175/1520-0469(1975)032<1542:TDAMSO>2.0.CO;2
- IAEA/WMO. 2018. Global Network of Isotopes in Precipitation, The GNIP Database. Accessible at: http://isohis.iaea.org.
- Jouzel, J., Froehlich, K. and Schotterer, U. 1997. Deuterium and oxygen-18 in present-day precipitation: Data and modelling. Hydrol. Sci. J. 42, 747–763. doi:10.1080/02626669709492070
- Jouzel, J. and Merlivat, L. 1984. Deuterium and oxygen 18 in precipitation: Modeling of the isotopic effects during snow formation. J. Geophys. Res. 89, 11749–11757. doi:10.1029/JD089iD07p11749
- Kalnay, E., Kanamitsu, M., Kistler, R., Collins, W., Deaven, D. and co-authors. 1996. The NCEP/NCAR 40-year reanalysis project. Bull. Am. Meteorol. Soc. 77, 437–471. doi:10.1175/1520-0477(1996)077<0437:TNYRP>2.0.CO;2
- Kar, N., Garzione, C. N., Jaramillo, C., Shanahan, T., Carlotto, V. and co-authors. 2016. Rapid regional surface uplift of the northern Altiplano plateau revealed by multiproxy paleoclimate reconstruction. Earth Planet. Sci. Lett. 447, 33–47. doi:10.1016/j.epsl.2016.04.025
- Karim, A. and Veizer, J. 2002. Water balance of the Indus River Basin and moisture source in the Karakoram and western Himalayas: Implications from hydrogen and oxygen isotopes in river water. J. Geophys. Res. 107, 4362. doi:10.1029/2000JD000253
- Kendall, C. and Coplen, T. B. 2001. Distribution of oxygen‐18 and deuterium in river waters across the United States. Hydrol. Process. 15, 1363–1393. doi:10.1002/hyp.217
- Kent-Corson, M., Ritts, B., Zhuang, G., Bovet, P., Graham, S. and co-authors. 2009. Stable isotopic constraints on the tectonic, topographic, and climatic evolution of the northern margin of the Tibetan Plateau. Earth Planet. Sci. Lett. 282, 158–166. doi:10.1016/j.epsl.2009.03.011
- Kinzer, G. D. and Gunn, R. 1951. The evaporation, temperature and thermal relaxation-time of freely falling waterdrops. J. Meteorol. 8, 71–83. doi:10.1175/1520-0469(1951)008<0071:TETATR>2.0.CO;2
- Kong, Y., Pang, Z. and Froehlich, K. 2013. Quantifying recycled moisture fraction in precipitation of an arid region using deuterium excess. Tellus B 65, 1. doi:10.3402/tellusb.v65i0.19251
- Kurita, N. and Yamada, H. 2008. The role of local moisture recycling evaluated using stable isotope data from over the middle of the Tibetan Plateau during the monsoon season. J. Hydrometeor. 9, 760–775. doi:10.1175/2007JHM945.1
- Landais, A., Barkan, E. and Luz, B. 2008. Record of δ18O and 17O-excess in ice from Vostok Antarctica during the last 150,000 years. Geophys. Res. Lett. 35, L02709. doi:10.1029/2007GL032096
- Landais, A., Risi, C., Bony, S., Vimeux, F., Descroix, L. and co-authors. 2010. Combined measurements of 17O excess and d-excess in African monsoon precipitation: Implications for evaluating convective parameterizations. Earth Planet. Sci. Lett. 298, 104–112. doi:10.1016/j.epsl.2010.07.033
- Landais, A., Steen-Larsen, H. C., Guillevic, M., Masson-Delmotte, V., Vinther, B. and co-authors. 2012. Triple isotopic composition of oxygen in surface snow and water vapor at NEEM (Greenland). Geochim. Cosmochim. Acta 77, 304–316. doi:10.1016/j.gca.2011.11.022
- Lawrence, M. G. 2005. The relationship between relative humidity and the dewpoint temperature in moist air: A simple conversion and applications. Bull. Am. Meteorol. Soc. 86, 225–234. doi:10.1175/BAMS-86-2-225
- Lechler, A. R. and Niemi, N. A. 2012. The influence of snow sublimation on the isotopic composition of spring and surface waters in the southwestern United States: Implications for stable isotope–based paleoaltimetry and hydrologic studies. Geol. Soc. Am. Bull., B30467. 30461 124, 318–334. doi:10.1130/B30467.1
- Leier, A., McQuarrie, N., Garzione, C. and Eiler, J. 2013. Stable isotope evidence for multiple pulses of rapid surface uplift in the Central Andes, Bolivia. Earth Planet. Sci. Lett. 371-372, 49–58. doi:10.1016/j.epsl.2013.04.025
- Li, L. and Garzione, C. N. 2017. Spatial distribution and controlling factors of stable isotopes in meteoric waters on the Tibetan Plateau: Implications for paleoelevation reconstruction. Earth Planet. Sci. Lett. 460, 302–314. doi:10.1016/j.epsl.2016.11.046
- Li, S., Levin, N. E. and Chesson, L. A. 2015. Continental scale variation in 17O-excess of meteoric waters in the United States. Geochim. Cosmochim. Acta 164, 110–126. doi:10.1016/j.gca.2015.04.047
- Lin, Y., Clayton, R. N., Huang, L., Nakamura, N. and Lyons, J. R. 2013. Oxygen isotope anomaly observed in water vapor from Alert, Canada and the implication for the stratosphere. Proc. Natl. Acad. Sci. 110, 15608–15613. 201313014. doi:10.1073/pnas.1313014110
- Liotta, M., Favara, R. and Valenza, M. 2006. Isotopic composition of the precipitations in the central Mediterranean: Origin marks and orographic precipitation effects. J. Geophys. Res. 111, 19302. doi:10.1029/2005JD006818
- Luz, B. and Barkan, E. 2010. Variations of 17O/16O and 18O/16O in meteoric waters. Geochim. Cosmochim. Acta 74, 6276–6286. doi:10.1016/j.gca.2010.08.016
- MacCready, P. B. Jr, 1955. High and low elevations as thermal source regions. Weather 10, 35–40. doi:10.1002/j.1477-8696.1955.tb00136.x
- Majoube, M. 1971. Fractionnement en oxygene 18 et en deuterium entre l’eau et sa vapeur. J. Chim. Phys. 68, 1423–1436. doi:10.1051/jcp/1971681423
- Meijer, H. and Li, W. 1998. The use of electrolysis for accurate δ17O and δ18O isotope measurements in water. Isot. Environ. Health Stud. 34, 349–369. doi:10.1080/10256019808234072
- Merlivat, L. 1978. Molecular diffusivities of H2 16O, HD16O, and H2 18O in gases. J. Chem. Phys. 69, 2864–2871. doi:10.1063/1.436884
- Merlivat, L. and Jouzel, J. 1979. Global climatic interpretation of the deuterium‐oxygen 18 relationship for precipitation. J. Geophys. Res. 84, 5029–5033. doi:10.1029/JC084iC08p05029
- Miller, M. F. 2018. Precipitation regime influence on oxygen triple-isotope distributions in Antarctic precipitation and ice cores. Earth Planet. Sci. Lett. 481, 316–327. doi:10.1016/j.epsl.2017.10.035
- Mulch, A., Graham, S. A. and Chamberlain, C. P. 2006. Hydrogen isotopes in Eocene river gravels and paleoelevation of the Sierra Nevada. Science 313, 87–89. doi:10.1126/science.1125986
- NOAA/NCDC. 2010. National Oceanic and Atmospheric Administration and National Climatic Data Center, Asheville, North Carolina, Database accessible at: http://www.ncdc.noaa.gov.
- Numaguti, A. 1999. Origin and recycling processes of precipitating water over the Eurasian continent: Experiments using an atmospheric general circulation model. J. Geophys. Res. 104, 1957–1972. doi:10.1029/1998JD200026
- Passey, B. H., Hu, H., Ji, H., Montanari, S., Li, S. and co-authors. 2014. Triple oxygen isotopes in biogenic and sedimentary carbonates. Geochim. Cosmochim. Acta 141, 1–25. doi:10.1016/j.gca.2014.06.006
- Passey, B. H. and Ji, H. 2019. Triple oxygen isotope signatures of evaporation in lake waters and carbonates: A case study from the western United States. Earth Planet. Sci. Lett. 518, 1–12. doi:10.1016/j.epsl.2019.04.026
- Pedgley, D. 1970. Heavy rainfalls over Snowdonia. Weather 25, 340–350. doi:10.1002/j.1477-8696.1970.tb04117.x
- Pfahl, S. and Sodemann, H. 2014. What controls deuterium excess in global precipitation?. Clim. Past 10, 771–781. doi:10.5194/cp-10-771-2014
- Poage, M. A. and Chamberlain, C. P. 2001. Empirical relationships between elevation and the stable isotope composition of precipitation and surface waters; considerations for studies of paleoelevation change. Am. J. Sci. 301, 1–15. doi:10.2475/ajs.301.1.1
- Rank, D. and Papesch, W. 2005. Isotopic composition of precipitation in Austria in relation to air circulation patterns and climate. Isotopic composition of precipitation in the Mediterranean basin in relation to air circulation patterns and climate, IAEA-TECDOC-1453, IAEA, Vienna, 19–36.
- Risi, C., Bony, S. and Vimeux, F. 2008. Influence of convective processes on the isotopic composition (d18O and dD) of precipitation and water vapor in the tropics: 2. Physical interpretation of the amount effect. J. Geophys. Res. 113, D19306. doi:10.1029/2008JD009943
- Risi, C., Landais, A., Bony, S., Jouzel, J., Masson‐Delmotte, V. and co-authors. 2010. Understanding the 17O excess glacial‐interglacial variations in Vostok precipitation. J. Geophys. Res. 115, D10112. doi:10.1029/2008JD011535
- Roe, G. H. 2005. Orographic precipitation. Annu. Rev. Earth Planet. Sci. 33, 645–671. doi:10.1146/annurev.earth.33.092203.122541
- Rohrmann, A., Strecker, M. R., Bookhagen, B., Mulch, A., Sachse, D. and co-authors. 2014. Can stable isotopes ride out the storms? The role of convection for water isotopes in models, records, and paleoaltimetry studies in the central Andes. Earth Planet. Sci. Lett. 407, 187–195. doi:10.1016/j.epsl.2014.09.021
- Rozanski, K., Araguas-Araguas, L. and Gonfiantini, R. 1993. Isotopic patterns in modern global precipitation. Climate Change in Continental Isotopic Records 78, 1–36.
- Salamalikis, V., Argiriou, A. A. and Dotsika, E. 2016. Isotopic modeling of the sub-cloud evaporation effect in precipitation. Sci. Total Environ. 544, 1059–1072. doi:10.1016/j.scitotenv.2015.11.072
- Salmon, O. E., Welp, L. R., Baldwin, M. E., Hajny, K. D., Stirm, B. H. and co-authors. 2019. Vertical profile observations of water vapor deuterium excess in the lower troposphere. Atmos. Chem. Phys. 19, 11525–11543. doi:10.5194/acp-19-11525-2019
- Samuels‐Crow, K. E., Galewsky, J., Sharp, Z. D. and Dennis, K. J. 2014. Deuterium excess in subtropical free troposphere water vapor: Continuous measurements from the Chajnantor Plateau, northern Chile. Geophys. Res. Lett. 41, 8652–8659. doi:10.1002/2014GL062302
- Saylor, J. E. and Horton, B. K. 2014. Nonuniform surface uplift of the Andean plateau revealed by deuterium isotopes in Miocene volcanic glass from southern Peru. Earth Planet. Sci. Lett. 387, 120–131. doi:10.1016/j.epsl.2013.11.015
- Schauer, A. J., Schoenemann, S. W. and Steig, E. J. 2016. Routine high-precision analysis of triple water-isotope ratios using cavity ring-down spectroscopy. Rapid Commun. Mass Spectrom. 30, 2059–2069. doi:10.1002/rcm.7682
- Schoenemann, S. W., Schauer, A. J. and Steig, E. J. 2013. Measurement of SLAP2 and GISP δ17O and proposed VSMOW-SLAP normalization for δ17O and 17O(excess) . Rapid Commun. Mass Spectrom. 27, 582–590. doi:10.1002/rcm.6486
- Schoenemann, S. W., Steig, E. J., Ding, Q., Markle, B. R. and Schauer, A. J. 2014. Triple water‐isotopologue record from WAIS Divide, Antarctica: Controls on glacial‐interglacial changes in 17O excess of precipitation. J. Geophys. Res. Atmos. 119, 8741–8763. doi:10.1002/2014JD021770
- Shapiro, M. 1980. Turbulent mixing within tropopause folds as a mechanism for the exchange of chemical constituents between the stratosphere and troposphere. J. Atmos. Sci. 37, 994–1004. doi:10.1175/1520-0469(1980)037<0994:TMWTFA>2.0.CO;2
- Sjostrom, D. J. and Welker, J. M. 2009. The influence of air mass source on the seasonal isotopic composition of precipitation, eastern USA. J. Geochem. Explor. 102, 103–112. doi:10.1016/j.gexplo.2009.03.001
- Steig, E., Gkinis, V., Schauer, A., Schoenemann, S., Samek, K. and co-authors. 2014. Calibrated high-precision 17O-excess measurements using cavity ring-down spectroscopy with laser-current-tuned cavity resonance. Atmos. Meas. Tech. 7, 2421–2435. doi:10.5194/amt-7-2421-2014
- Stewart, M. K. 1975. Stable isotope fractionation due to evaporation and isotopic exchange of falling waterdrops: Applications to atmospheric processes and evaporation of lakes. J. Geophys. Res. 80, 1133–1146. doi:10.1029/JC080i009p01133
- Strachan, S. and Daly, C. 2017. Testing the daily PRISM air temperature model on semiarid mountain slopes. J. Geophys. Res. Atmos. 122, 5697–5715. doi:10.1002/2016JD025920
- Tian, L., Yao, T., MacClune, K., White, J. W. C., Schilla, A. and co-authors. 2007. Stable isotopic variations in west China: A consideration of moisture sources. J. Geophys. Res. 112, 10112.
- Uechi, Y. and Uemura, R. 2019. Dominant influence of the humidity in the moisture source region on the 17O-excess in precipitation on a subtropical island. Earth Planet. Sci. Lett. 513, 20–28. doi:10.1016/j.epsl.2019.02.012
- Uemura, R., Barkan, E., Abe, O. and Luz, B. 2010. Triple isotope composition of oxygen in atmospheric water vapor. Geophys. Res. Lett. 37, L04402. doi:10.1029/2009GL041960
- Uemura, R., Matsui, Y., Yoshimura, K., Motoyama, H. and Yoshida, N. 2008. Evidence of deuterium excess in water vapor as an indicator of ocean surface conditions. J. Geophys. Res. 113, D19114. doi:10.1029/2008JD010209
- Wallace, J. M. and Hobbs, P. V. 2006. Atmospheric Science: An Introductory Survey. Boston, Massachusetts: Elsevier.
- Wang, S., Zhang, M., Che, Y., Zhu, X. and Liu, X. 2016a. Influence of below-cloud evaporation on deuterium excess in precipitation of Arid Central Asia and its meteorological controls. J. Hydrometeor. 17, 1973–1984. doi:10.1175/JHM-D-15-0203.1
- Wang, S., Zhang, M., Hughes, C. E., Zhu, X., Dong, L. and co-authors. 2016b. Factors controlling stable isotope composition of precipitation in arid conditions: an observation network in the Tianshan Mountains, central Asia. Tellus B 68, 26206. doi:10.3402/tellusb.v68.26206
- Wang, Y., Cheng, H., Edwards, R. L., Kong, X., Shao, X. and co-authors. 2008. Millennial- and orbital-scale changes in the East Asian monsoon over the past 224,000 years . Nature 451, 1090–1093. doi:10.1038/nature06692
- Webster, C. R. and Heymsfield, A. J. 2003. Water isotope ratios D/H, 18O/16O, 17O/16O in and out of clouds map dehydration pathways. Science 302, 1742–1745. doi:10.1126/science.1089496
- Whiteman, C. D. 2000. Mountain Meteorology: fundamentals and Applications. New York, New York: Oxford University Press.
- Winkler, R., Landais, A., Risi, C., Baroni, M., Ekaykin, A. and co-authors. 2013. Interannual variation of water isotopologues at Vostok indicates a contribution from stratospheric water vapor. Proc. Natl. Acad. Sci. USA. 110, 17674–17679. doi:10.1073/pnas.1215209110
- Winkler, R., Landais, A., Sodemann, H., Dümbgen, L., Prié, F. and co-authors. 2011. Deglaciation records of 17O-excess in East Antarctica: reliable reconstruction of oceanic relative humidity from coastal sites. Clim. Past Discuss. 7, 1845–1886. doi:10.5194/cpd-7-1845-2011