
 ?Mathematical formulae have been encoded as MathML and are displayed in this HTML version using MathJax in order to improve their display. Uncheck the box to turn MathJax off. This feature requires Javascript. Click on a formula to zoom.
Abstract
In this study, we utilize aerosol mass spectrometer (AMS) and multi-angle absorption photometer (MAAP) measurements to assess the most predominant source regions of various atmospheric aerosol constituents transported to Eastern Finland. The non-refractory composition data from the AMS were measured during three intensive measurements campaigns in autumn 2012, 2014 and 2016, whereas the continuous long-term measurements on equivalent black carbon were conducted in 2012–2017. According to observations, the highest concentrations of particulate organics, sulphate, ammonium and black carbon originated from western parts of Russia and Eastern Europe, whereas Central Europe showed lesser contribution. In addition, exceptionally high concentrations of sulphate and ammonium were associated with the Timan-Pechora basin located in north-western Russia. Assumingly, this phenomenon could be linked to intensive gas flaring activities taking place in the area. We also performed positive matrix factorization analysis of organic fraction measured by the AMS. The trajectory analysis revealed increased concentration fields (CF) for low-volatility oxygenated organic aerosol (LVOOA) and hydrocarbon-like organic aerosol (HOA) in the same areas as for sulphate and ammonium. Meanwhile, the CF of semi-volatile oxygenated organic aerosol (SVOOA) suggested a local origin. To summarize, our results suggest that Western Russia and Eastern Europe are the most important source regions of several long-range transported aerosol constituents for Eastern Finland. Besides influencing the air quality and aerosol chemical composition on a local scale, these regions may also play a crucial role as the pollutants are transported further north, towards the vulnerable Arctic region.
1. Introduction
Atmospheric aerosol particles comprise complex mixtures of various organic and inorganic chemical constituents. The aerosol chemical composition is a crucial factor determining particles’ fate and role in the atmosphere, and most notably, their impact on climate. Most of the aerosol types present in the atmosphere tend to cool the climate by reflecting the solar shortwave radiation back to space. In addition, depending on the prevalent meteorological conditions, particles of certain size and chemical composition can act as condensation nuclei for cloud droplets. Therefore, increasing the number of available cloud condensation nuclei (CCN) could potentially lead to increase in cloud droplet concentration, which directly increases cloud albedo (Twomey, Citation1974), and initiates several potential feedback processes affecting not only cloud microphysical properties but also thickness and mesoscale cloud coverage (Albrecht, Citation1989; Haywood and Boucher, Citation2000; Lohmann and Feichter, Citation2005; Quaas et al., Citation2020).
Some aerosol types, most importantly black carbon (BC), are highly light-absorbing. BC originates from incomplete combustion and is emitted to the atmosphere together with several other gaseous and particulate pollutants. It has been estimated that BC induces the second most important anthropogenic climate forcing after CO2 (Bond et al., Citation2013). BC affects the climate through various mechanisms. First, it can directly absorb both the incoming solar radiation and the radiation that is reflected from the high albedo surface underneath (e.g. snow or cloud layer). Second, BC may reduce the cloud coverage and alter the cloud microphysics via so-called semi-direct effects (Hansen et al., Citation1997; Koch and Del Genio, Citation2010) and settle on snow decreasing the natural surface albedo and reflectance (Hansen and Nazarenko, Citation2004; Flanner et al., Citation2007).
Although the climatic importance and role of BC are well established, it still comes with a great uncertainty. For example, BC particles cover a wide range of particle sizes and mixing states even in the same air mass. The pure primary BC particles may undergo condensation and coagulation processes in the atmosphere, and thus, can be coated with varying fraction of other organic or inorganic compounds. These processes further alter the light scattering and absorbing properties of BC particles as well as their ability to act as CCN (e.g. Matsui et al., Citation2018; Cappa et al., Citation2019).
The chemical composition of the ambient aerosol depends on several different factors, such as remote emission sources, local emission sources and atmospheric processes occurring between the source and receptor sites. In this study, we investigate the role of long-range transport on the aerosol chemical composition measured at the Puijo station in Eastern Finland, a unique location along the pathway connecting the continental Europe and Arctic regions. We utilize aerosol mass spectrometer (AMS) and multi-angle absorption photometer (MAAP) measurements together with atmospheric air mass back-trajectories in order to identify the source regions of various organic and inorganic chemical species. AMS is a state-of-the-art instrument capable of measuring the mass concentrations of particulate organics, sulphate, ammonium, nitrate and chloride species (Jayne et al., Citation2000). In addition, the organic mass spectra measured with an AMS can be used to resolve various multiple organic aerosol (OA) factors corresponding to different aerosol sources and processes.
Cluster analysis is likely one of the most simplistic tools for identification of geographical source regions and source-specific chemical characteristics (e.g. Huang et al., Citation2010; Hussein et al., Citation2014). In cluster analysis, a large group of air mass trajectories are analytically divided into distinct groups (i.e. clusters) for which the average composition or concentration can be calculated. However, as the cluster analysis is purely analytical method, the averaged compositions or concentrations can be somewhat hard to interpret. For example, trajectories grouped into one cluster may cover large areas with wide range of geographical characteristics such as polluted urban sites, relatively clean background areas or marine regions.
A more sophisticated alternative for cluster analysis is provided by so-called source-receptor methods (e.g. Ashbaugh et al., Citation1985; Stohl, Citation1996). In these methods, the measured concentrations are assigned to individual air mass trajectories and their spatial coordinates. Thereafter, the spatial coordinates and their associated concentrations can be averaged and illustrated as compound-specific concentration maps. In previous literature, these analysis tools or their variants have been typically named as potential source contribution function (PSCF) or concentration-weighted trajectory (CWT) methods. Even though these methods have been utilized for more than three decades in atmospheric sciences and pollution research, only a few studies have tried to combine them with AMS data (McGuire et al., Citation2014; Sun et al., Citation2018). Although more studies have focused on BC (e.g. Babu et al., Citation2011; Franke et al., Citation2017), none of these studies, to our knowledge, have used long-term data covering several years of measurements.
2. Methods
2.1. Measurement site
The Puijo measurement station is located on the top floor the Puijo observation tower (62°54′34″N, 27°39′19″E) and it resides approximately 224 m above the surrounding lake level. Based on its surroundings, the Puijo station can be characterized as a semi-urban measurement site. The eastern and southern side of the tower (0–215°) is covered by residential areas of different sizes, but also, includes several other local emission sources such as a paper mill in the northeast, a heating plant in the south and the two main roads crossing the area in south–north direction. By contrast, the western side of the tower (215–360°) is mainly covered by woodland and water bodies. Due to its high location, the measurement station has been typically utilized in aerosol-cloud studies (e.g. Hao et al., Citation2013; Väisänen et al., Citation2016). However, the high location also implies that all the local emission sources are located roughly 200 m below the measurement altitude, and thus, the measurement station is also well suitable for characterization of aerosols and their transportation from remote areas. A more detailed overview of the station and its surroundings can be found from previous literature (Leskinen et al., Citation2012; Portin et al., Citation2014).
2.2. Non-refractory aerosol chemical composition
At Puijo, the bulk chemical composition of sub-micrometre atmospheric aerosol particles was measured with an Aerodyne High-Resolution Time-of-Flight Mass Spectrometer (hereafter referred to as AMS). Briefly, AMS measured the non-refractory composition, i.e. the mass concentrations of total organics, sulphate (SO4), nitrate (NO3), ammonium (NH4) and chloride (Cl) by applying thermal vaporization and electron impact ionization. Following the evaporation and ionization, AMS designates the ion trajectory in the time-of-flight (ToF) analyser into two modes. One is so-called V-mode, which defines the ion trajectory moving in the ToF analyser in V-shape. The other one is W-mode. Compared to W-mode, the V-mode provides data with higher sensitivity but lower resolution. A more comprehensive overview of the instrument, calibration and data analysis has been presented in previous literature (Jayne et al., Citation2000; DeCarlo et al., Citation2006; Canagaratna et al., Citation2007). In this study, we utilize AMS data measured during three intensive measurement campaigns. These three campaigns organized during the autumn seasons in 2012, 2014 and 2016, are summarized in . To determine the mass concentrations, the mass spectra in V-mode were employed and the relative ionization efficiency (RIE) values for organics, sulphate and nitrate were 1.4, 1.2 and 1.1, respectively, for all three campaigns. For ammonium, RIEs of 2.8, 3.5 and 2.3 and collection efficiencies of 0.4, 0.4 and 0.8 were applied for campaigns in 2012, 2014 and 2016, respectively.
Table 1. The durations and AMS data coverages for the three intensive measurement campaigns organized in 2012, 2014 and 2016.
2.3. Positive matrix factorization
Positive matrix factorization (PMF) analysis was performed on the high-resolution mass spectra for all three campaigns. The PMF techniques and its application to the AMS data have been described in Paatero and Tapper (Citation1994) and Ulbrich et al. (Citation2009), respectively. In each campaign, the organic error matrices were processed by applying the minimum error, down-weighting the m/z 44 relative signals, and down-weighting and removing the other weak and bad signals, respectively. Then, the results were evaluated with 1–6 factors and Fpeak varied from −1 to 1 in steps of 0.1. After a detailed evaluation of mass spectral profiles and time series of different OA factors, a three-factor solution was selected for the 2014 and 2016 campaigns and a four-factor solution was chosen for the 2012 campaign. The mass spectra and time series of factors 1 and 2 in the 2012 campaign resembled each other, and thus, they were merged to generate a new factor. Ultimately, an improved three-factor solution is reported for all three campaigns presented in this paper.
2.4. Black carbon
The BC concentrations at Puijo have been monitored continuously since 2006 with a MAAP (MAAP Model 5012, Thermo Scientific). In MAAP, the particle sample is collected onto a glass-fibre filter tape, after which the optical absorption of the collected aerosol is determined by measuring the transmittance across the filter and the reflectance at two angles (130° and 165°) at 637 nm wavelength. Finally, the derived absorbance of the accumulated aerosol is inverted into equivalent black carbon (BCe) concentration by assuming a constant mass absorption cross-section of 6.6 m2 g−1. In this study, we use hourly averaged BCe data measured during the years 2012–2017. The data coverage during this measurement period is approximately 85% with the only longer data gap occurring in early 2016 due to instrumental issues.
2.5. Trajectory analysis
The ambient chemical composition data from both the AMS and MAAP were averaged over 1-hour measurement periods. Thereafter, 5-day back-trajectories arriving at Puijo (fixed arrival altitude of 250 m) were calculated for each measurement hour with the HYSPLIT4 atmospheric transport and dispersion model (Stein et al., Citation2015). In this study, we have used the meteorological input data from the Global Data Assimilation System (GDAS) with a horizontal resolution of 1°. These data have been widely used in various HYSPLIT applications and provide a good compromise between spatial and temporal resolution, accuracy and computational efficiency (e.g. Su et al., Citation2015).
The 5-day back-trajectories calculated with the HYSPLIT model consist of 121 hourly endpoints, which describe the spatial coordinates of an air parcel that arrives at the receptor site at the given time t = tk. First, each of these endpoints is assigned an hourly averaged concentration measured at t = tk. Thereafter, the geographical area of interest is divided into 0.5° × 0.5° grid cells and the gridded concentration fields (CF) are calculated by adapting the methodology reviewed and developed further by Stohl (Citation1996). To summarize, the CFs for individual chemical constituents are calculated as:
(1)
(1)
where k is an ordinal index of an hourly data point, N the total number of data points and respective trajectories, ck the measured concentration, and τi,j,k the number of hourly trajectory endpoints hitting the grid cell (i,j) for an air mass trajectory that arrives the receptor site at t = tk. Thereafter, the initial CFs are smoothed with a 9-point average filter imposing a restriction that the gridded values should remain within their 95% confidence intervals. The smoothing process is repeated until the difference between the two consecutive CFs is less than 1%. Ultimately, the purpose of this kind of smoothing process is to diminish the statistically insignificant small-scale variations in the CFs without removing any real and significant structures (Stohl, Citation1996).
One possible issue arising from this kind of approach is so-called trailing effect. This can happen if the total number of trajectory endpoints hitting a certain grid cell is low but some of these trajectories also pass real source regions elsewhere. This can lead to erroneous and misleading grid values especially in the peripheral areas where the trajectory density decreases. In order to tackle this issue, we have applied a weight function Wi,j to de-emphasize grid cells with low trajectory density. Such weight functions have been typically used together with so-called PSCF methods. In these methods, absolute concentrations are replaced by binary values depending on whether the measured concentration exceeds a certain threshold value or not.
In this study, we have calculated the endpoint-weighted CF as
(2)
(2)
where Wi,j is the arbitrary weight function
(3)
(3)
and τavg is the average number of trajectory endpoints per grid cell. Previously, Nicolás et al. (2011) applied a similar formulation when assessing the source areas of various PM2.5 constituents over the south-western Mediterranean. That said, there exist no consensus about what kind of weight functions should be preferred. For instance, Begum et al. (Citation2005) and Hwang and Hopke (Citation2007) formulated the weights as four-step functions and used threshold limits of roughly 2τavg and 3τavg for Wi,j < 1. However, they also used a trajectory set much smaller compared to ours justifying the usage of non-continuous weight function. To assess the potential influence of different weight function formulations, we also tested four-step functions with threshold limits of 1τavg and 2τavg. In the end, this did not significantly affect the conclusions of our analyses as the grid cells that were most strongly influenced by the weighting function, were in remote and marine areas and had generally low initial CF values.
Applicability of an arbitrary weight function Wi,j, however, influences the interpretation of the obtained CF. This stems from the fact that besides the variability in measured concentrations, the final grid values also reflect the likelihood that an air mass crossing a certain source area is transported to the receptor site. Thus, the obtained CFs are strongly site specific and should not be generalized for larger geographical areas with divergent air mass transportation patterns. In addition, it has been estimated that the relative uncertainties associated with individual air mass trajectories can be up to 15%–30% of the travel distance (https://www.arl.noaa.gov/hysplit/hysplit-frequently-asked-questions-faqs/faq-hg11/, last visited 11 June 2020). In this study, we assume that these uncertainties are normally distributed along the trajectory path and the resulting errors in CFs converge towards zero when the number of trajectory endpoints is high enough.
3. Results and discussion
3.1. Non-refractory chemical composition
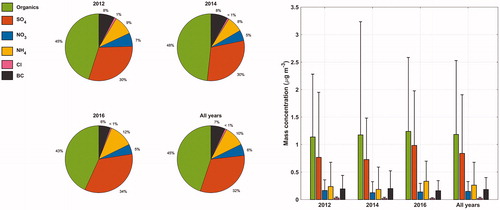
plots the chemical composition measured at the Puijo station during the three intensive measurement campaigns (). Overall, the hourly averaged total non-refractory mass concentrations measured with the AMS varied mainly between 0.2 and 13.8 µg m−3, and during each campaign, organics were the most abundant chemical species averaging up to 45% of the total aerosol mass. Meanwhile, the inorganic fraction was mainly dominated by SO4 (32%), followed by NH4 (10%) and NO3 (6%). The chloride concentrations were negligible throughout the three campaigns, and thus, Cl has been omitted from further trajectory analyses. For comparison, the BCe concentrations measured with MAAP varied between 0 and 1.2 µg m−3 reaching the campaign-averaged mass fractions between 6% and 8%.
Fig. 1. The average aerosol chemical composition measured at the Puijo station during the intensive measurement campaigns in 2012, 2014 and 2016. The whiskers in the mass concentration plot illustrate the range below the 90th percentile.
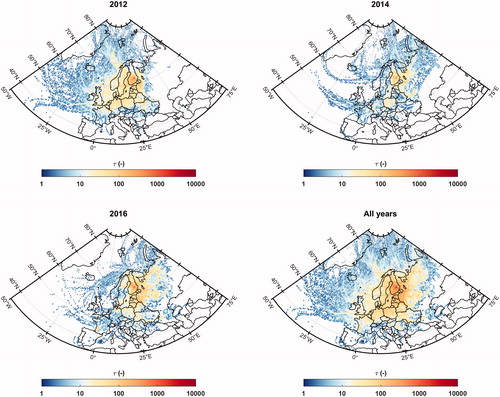
illustrates typical air mass transportation pathways and the frequency of potential source regions during the three measurement campaigns. Although the campaign-averaged chemical composition showed only minor differences between different years, the trajectory density maps reflect some year-to-year variation. Apparently, western air masses with marine contribution were, for the most part, observed during the 2012 campaign. By contrast, eastern air masses with potential source contribution from western and north-western parts of Russia were more predominant during the two latter campaigns, whereas air masses crossing the central parts of Europe were roughly equally frequent throughout the three campaigns. In general, the southern air masses are associated with low-pressure fronts crossing Finland in west–east direction. These relatively warm and humid air masses are favourable for cloud formation and therefore, characteristic for cloud events observed at Puijo. This may in turn influence the particle composition and measured concentrations through cloud processing and precipitation scavenging. For example, during the 2016 campaign, approximately 70% of all the observed cloud events were associated with central European air masses.
Fig. 2. Spatial distribution of trajectory endpoints during the three intensive measurements campaigns. The logarithmic colour scale illustrates the total number of trajectory endpoints in each 0.5° × 0.5° grid cell.
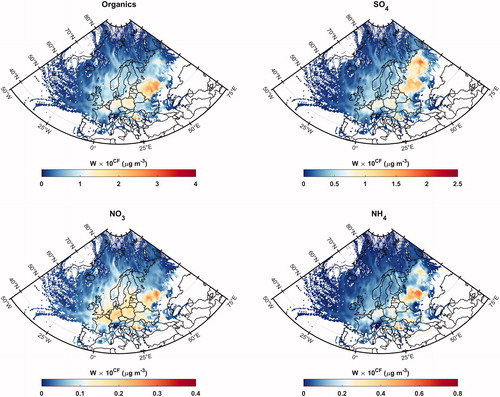
The endpoint-weighted CFs of organics, SO4, NO3 and NH4 are presented in . As could be expected, all four compounds show higher CF values over continental Europe compared to marine regions. However, while NO3 shows elevated concentrations over relatively large areas in Central Europe and western parts of Russia, the three other constituents – organics, SO4 and NH4 – appear more definite and areas with increased concentrations are easier to locate. Another notable feature that differentiates these three constituents from NO3 is the hot spot appearing over the Timan-Pechora basin in north-western Russia. Interestingly, this is also the region where the endpoint-weighted CF of SO4 reaches its’ maximum values. The Timan-Pechora basin is one of the biggest petroleum production regions in Russia and therefore, associated with intensive gas flaring activities (e.g. Stohl et al., Citation2013; Huang et al., Citation2015). It is also worth to highlight that the predominant source regions of organics are rather similar to those of NH4 and SO4. This observation suggests that a large fraction of total organics measured at Puijo could originate from long-range transport. This is supported by the fact that vegetation emissions and biogenic SOA (secondary organic aerosol) formation are heavily temperature dependent and tend to decrease at lower temperatures (Goldstein et al., Citation2009; Paasonen et al., Citation2013; Hellén et al., Citation2018). Hence, the anthropogenic fraction of SOA increases during autumn season in all those areas where temperatures decrease. In Finland, the vegetation emissions and local biogenic SOA formation are low during autumn season, which could partially explain why majority of organics seems to originate from distinct remote sources.
Fig. 3. The endpoint-weighted concentrations fields of organics, sulphate (SO4), nitrate (NO3) and ammonium (NH4) averaged over the three intensive measurement campaigns in 2012, 2014 and 2016.
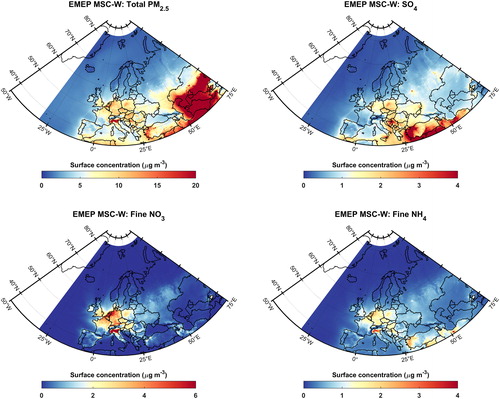
For comparison, plots the modelled surface air concentrations of total PM2.5 and the three inorganic aerosol constituents (SO4, fine mode NO3 and fine mode NH4). These results from the EMEP MSC-W model are averaged over September, October and November 2016 by using on the monthly data readily available for download from the Norwegian Meteorological Institute (http://emep.int/mscw/mscw_moddata.html, last visited 11 June 2020). The best overall agreement between the endpoint-weighted CFs and modelled surface air concentrations is achieved with NO3. With SO4 and NH4, however, the results already start to look quite different. Similar to NO3, these two compounds reach their maximum surface air concentrations over relatively vast areas in Central Europe, whereas concentrations associated with western and north-western Russia are more localized, and in general, considerably lower. This is interesting because the trajectory-based CFs suggest the opposite with the highest concentrations being associated with western parts of Russia. In addition, the Timan-Pechora basin that was clearly identifiable from the CFs does not stand out when looking at the modelled surface air concentrations. However, this would make sense if the increased sulphate and ammonium concentrations were associated with gas flaring activities. Due to the high temperature of the flaring plumes, the pollutants may ascend to the free troposphere, allowing them to be transported over long distances. In addition, it is worth pointing out that according to , the trajectory densities did not differ significantly between eastern and central European regions. This implies that the contradiction between the model results and CFs cannot be solely explained by the prevalence of eastern air masses during measurement period, i.e. by the appliance of weight function Wi,j. Interestingly, the EMEP emissions also highlight the strong SO4 emissions originating from the Western Balkan countries. In our endpoint-weighted CFs, however, one can see relatively high concentrations of organics, SO4, NH4 and NO3 over South-Western Romania. Speculatively, these values could be either coincidental or slightly misplaced due to the low trajectory endpoint density over these peripheral areas.
Fig. 4. Average surface air concentrations of total PM2.5, SO4, fine mode NO3 and fine mode NH4 as modelled with EMEP MSC-W. Data from The Norwegian Meteorological Institute.
Riuttanen et al. (Citation2013) studied the atmospheric transport of particulate matter and trace gases to the SMEAR II station in Hyytiälä, southern Finland. In the case of SO2, they did not manage to reproduce the EMEP emission fields. Instead, they observed much lower contribution from southern and south-western sectors compared to south-eastern domain. Similarly, Heikkinen et al. (Citation2020) reported relatively high concentrations of SO4 and SO2 for south-eastern winds, especially, during the winter season. These elevated concentrations were also associated with high wind speeds suggesting a potential contribution from long-range transport. In general, these results are analogous to our observations with particulate SO4. Riuttanen et al. (Citation2013) speculated that one possible explanation behind the discrepancy between the EMEP emissions and CFs could have been wet removal. As we pointed out earlier, southern air masses travelling over Central Europe are indeed more likely to be affected by cloud formation and wet removal before their arrival at Puijo. Therefore, these factors could at least partially explain why Central Europe seems to have less significant contribution to measured concentrations compared to eastern regions.
On the other hand, cloud droplet activation can alter the particle composition via cloud processing, for instance, through the liquid phase oxidation of SO2 to sulphuric acid (H2SO4), the process which should lead to increase in sulphate and also ammonium concentrations in case of excess gas phase ammonia (NH3). Beyond, the uptake of nitric acid (HNO3) and semi-volatile NH3 on aerosol particles is also dependent on relative humidity (RH), being the strongest in cloudy conditions (Hao et al., Citation2013; Schneider et al., Citation2017). Nevertheless, it is good to keep in mind that these processes are not considered in the trajectory analysis, suggesting that the obtained CFs may not be representative only for particle phase constituents, but also, their gaseous precursors. The meteorological data measured at Puijo allows the possibility for constraining the data based on RH. For example, omitting the observations with ambient RH above 90% should effectively remove all the observation from those times periods when the tower itself has been inside a cloud. Appliance of such constraint generally decreases the CF values of NO3 over the south-western sector, whereas the three other constituents show more subtle changes (see Supplementary Figs. S1 and S2). Besides, the constraint decreases the trajectory density over those areas where NO3 originally showed its’ most distinct features. However, this approach does not take into account the cloud processing that may have occurred prior to arrival at Puijo or a possibility for boundary-layer cloud residing above the measurement station. Although this kind of trajectory and transport analysis is therefore not sufficient to accurately describe the role of cloud processing on aerosol chemical composition at Puijo, our results imply that such processes, and especially partitioning of NO3, may play an important role in air masses prone to cloud formation and affect the obtained CFs.
3.2. Positive matrix factorization of OA
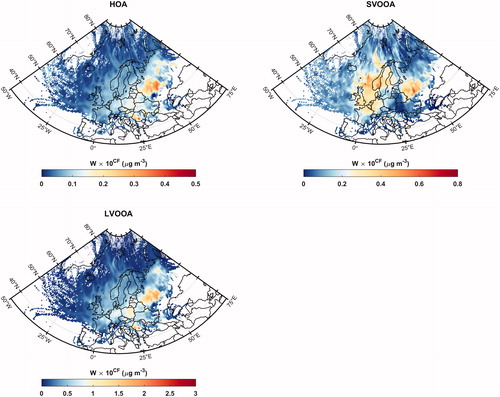
We analysed the composition of organic fraction in more detailed by using PMF, and further, the CFs of each OA factor. The organic fraction measured at Puijo station can be characterized by three factors: hydrocarbon-like organic aerosol (HOA), semi-volatile oxygenated organic aerosol (SVOOA) and low-volatility oxygenated organic aerosol (LVOOA). The mass spectrum of HOA is dominated by the prominent ion sequence of CnH2n+1+ and CnH2n–1+, and its time series shows high correlation with BCe and C4H9+ ion, conforming the characteristic feature of combustion-related primary OA (Zhang et al., Citation2005). The SVOOA is characterized by a prominent peak at m/z 43, which is similar to the less oxidized SVOOA component in a global scale (e.g. Ng et al., Citation2010). The LVOOA corresponds to more oxidized compounds and its mass spectrum is dominated by the peaks at m/z 44 (mostly CO2+) and m/z 28 (CO+). Its mass concentration in time series shows a moderate correlation with sulphate (R2 = 0.27–0.38). SVOOA and LVOOA are secondary organic aerosols formed via gas phase oxidation processes, while HOA is attributed to primary emissions of different combustion processes (Zhang et al., Citation2005; Sun et al., Citation2010). Generally, SVOOA represents the less oxidized, freshly formed OA from local sources, while LVOOA represent long-range transported, hence more aged and more oxidized OA (Zhang et al., Citation2005; Ng et al., Citation2010). In this study SVOOA, LVOOA and HOA make up 33.0% ± 23.7%, 54.7% ± 22.4% and 12.3% ± 8.5% of organic mass, respectively. CFs of HOA, LVOOA and SVOOA are shown in . CFs of LVOOA show elevated concentrations in same areas as total organics, NH4 and SO4 suggesting the same area of origin for LVOOA. Interestingly, also CFs of HOA show elevated values in the same areas. The high correlation of HOA and LVOOA has also been observed in other measurement sites, e.g. Beijing (Sun et al., Citation2015). In the HOA mass spectrum we have observed the fragmental ions at m/z 60 and m/z 73, which are the marker signals for the biomass burning OA (Schneider et al., Citation2006), suggesting HOA relevance to the combustion aerosol source in this study. The combustion processes could produce oxygenated primary OA (Weimer et al., Citation2008), which can undergo long-distance transport and travel to our measurement site contributing to our measured HOA component. In our case SVOOA, on the other hand, shows clearly different CF patterns compared to other two factors: elevated concentrations are spread to different areas, mainly over Scandinavia and Atlantic Ocean. This unexpected behaviour is obviously due to the fact that SVOOA is originated mainly from local and regional sources, and not associated to any specific air mass.
Fig. 5. The endpoint-weighted concentrations fields of PMF factors HOA, SVOOA and LVOOA averaged over the three intensive measurement campaigns in 2012, 2014 and 2016.
3.3. Long-term analysis on black carbon
plots the monthly BCe concentrations measured at the Puijo station in the years 2012–2017. Overall, the monthly median concentrations vary between 0.04 and 0.42 µg m−3. Both the monthly medians and peak concentrations follow a clear pattern and reach their annual maximum values during the winter season (December–February) or early spring (March). This observation is in accordance with Hyvärinen et al. (Citation2011) who analysed BCe concentrations from five different background sites in Finland during the years 2005–2008. However, it is also worth pointing out that a small fraction of hourly observations falls frequently below the instrumental detection limit of approximately 0.02–0.05 µg m−3 (Petzold et al., Citation2002) throughout the time series, even during the winter season.
Fig. 6. Time series of monthly equivalent black carbon (BCe) concentrations measured at the Puijo station. The grey box illustrates the range between the 25th and 75th percentiles, the red horizontal line is the monthly median and the black dots show the hourly averaged observations outside the quartile range. The block above the dashed horizontal line illustrates the occurrence of BCe concentrations larger than 1 µg m−3.
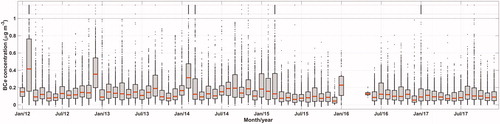
Supplementary Figures S3 and S4 illustrate the diurnal patterns and wind direction dependencies of seasonal BCe concentrations. The diurnal patterns indicate slightly increased concentrations during the early morning hours and late afternoon. Nevertheless, the exceptionally high concentrations observed most frequently during the winter season (December–February) do not show clear dependence on time of day. Meanwhile, more pronounced variation can be observed between different wind directions. During each season, the highest BCe concentrations are associated with wind directions between 150° and 210°. In general, these directions are characterized by highway traffic and residential areas. Taken together, these observations suggest that BCe concentrations measured at Puijo are partially influenced by local emissions sources such as work-related traffic and small-scale wood combustion. It is good to point out that air masses arriving from these aforementioned wind directions cover large geographical areas over the southern and south-eastern domain. Therefore, these local emissions could potentially influence the obtained CFs by flattening the differences between different geographical areas.
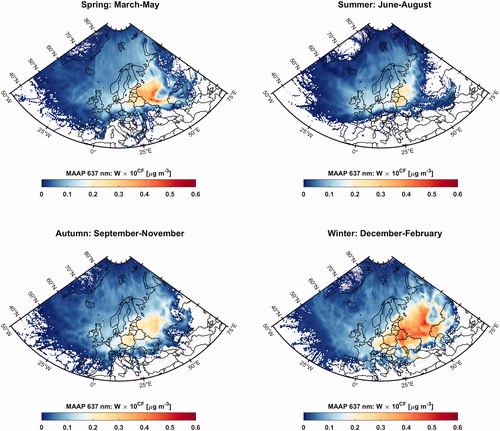
Annually and seasonally averaged CFs of BCe are plotted in and , respectively. For more complete picture, Supplementary Fig. S5 shows the CFs both for year-to-year and interannual and variability. Similar to non-refractory components, these CFs suggest a strong contribution from Eastern Europe and western parts of Russia. These regions are clearly distinguishable regardless of season or measurement year, and their associated concentrations have the same temporal features that were also apparent from . Meanwhile, the contribution of Central Europe enhances during the winter season when the southern and south-western air masses become more frequent. This observation is in a good agreement with results reported by Hyvärinen et al. (Citation2011), who also studied the atmospheric transportation of BC by utilizing trajectory-based analysis methods. The seasonal variations in CFs may also reflect the occurrence of some interesting weather anomalies. For example during the early 2012, Eastern Europe and Western Russia were subjected to exceptionally cold weather waves leading to increased heating demand and thus, potential increase in BC emissions. Likewise, the exceptionally high BCe concentrations measured during the winter 2012–2013 could be attributed to the cold wave that covered almost the whole Eurasian continent during December 2012. In such cold conditions, also the measurement station resides above the local boundary layer a considerable fraction of time, decreasing the contribution of local emissions.
Fig. 7. The endpoint-weighted concentration fields of equivalent black carbon (BCe) in 2012–2017.
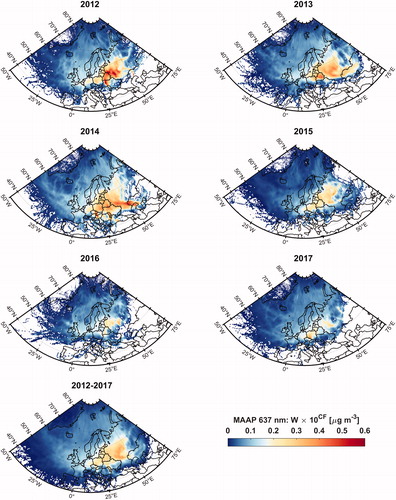
Fig. 8. The seasonally averaged endpoint-weighted concentration fields of equivalent black carbon (BCe) in 2012–2017.
As it was pointed out earlier, some fraction of BCe measured at Puijo indeed originates from local or nearby sources. To some extent, this local and domestic influence can be seen also from the CFs as the potential source regions of BCe occasionally reside considerably closer to the receptor site compared to those of non-refractory components (). On the other hand, the average non-refractory composition measured with an AMS represents the bulk chemical composition, i.e. particles that comprise the majority of the total aerosol mass. Therefore, the obtained CFs of non-refractory components are representative for well-aged particle population and less sensitive to fresh local emissions and particles of smaller size.
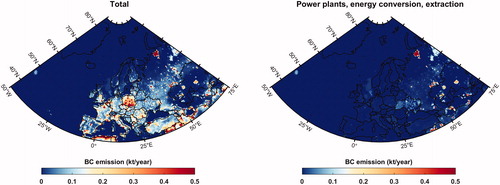
plots the ECLIPSE v5 emissions of BC in 2015 (https://www.iiasa.ac.at/web/home/research/researchPrograms/air/ECLIPSEv5.html, last visited 11 June 2020) with a grid resolution of 0.5° × 0.5°. The emissions are shown separately for total BC, and BC originating from energy production. Here, the energy production, i.e. power plants, energy conversion and extraction, also include the emissions from gas flaring activities. In general, the ECLIPSE v5 emissions of total BC show elevated values over relatively vast areas in Central Europe, whereas the emissions associated with Eastern Europe and Western Russia are generally lower. In addition, the emission inventory suggests considerable BC emissions originating from energy production in the Timan-Pechora basin, which in our study was identified as a potential contributor to increased sulphate fraction. As we described earlier, our seasonally calculated CFs of BCe suggest somewhat contradicting overview with an increased emphasis on the eastern and south-eastern domain. A slightly better agreement can be achieved when the CFs are averaged over the three measurement campaigns in 2012, 2014 and 2016 (Supplementary Fig. S6). Compared to seasonal results, the campaign-averaged CFs suggest more even contribution between the eastern and central European domains and show slightly higher values over north-western Russia. Yet, these re-calculated CF values over north-western Russia are low compared to ECLIPSE v5 emissions and do not highlight the area similar to particulate sulphate. The reason behind this discrepancy, however, still remains unknown.
Fig. 9. ECLIPSE v5 emissions for black carbon (BC). Emissions from gas flaring are included in the emissions from power plants, energy conversion and extraction.
Reddington et al. (Citation2013) used a global aerosol model to simulate the BC concentrations over Europe. In addition, they used aircraft measurements of BC mass and size distributions to assess the validity of modelled BC concentrations. Similar to ECLIPSE v5, the simulated BC mass concentrations reached their peak values over Central and Western Europe. On the other hand, the comparison to aircraft measurements indicated a considerable overestimation of the modelled concentrations and showed a clear mismatch between the modelled and measured size distributions of BC. This suggests that BC may not be treated with sufficient accuracy in global aerosol models, which makes the direct comparison between the model results and our trajectory-based CFs even more challenging.
4. Summary and conclusion
In this study, we have utilized AMS and MAAP measurements conducted at the Puijo measurement station to assess the potential source regions and transportation pathways of various aerosol chemical constituents over Eastern Finland. The AMS, providing the data on non-refractory aerosol composition (i.e. mass concentrations of organics, nitrate, sulphate and ammonium) was operated at the Puijo station during three intensive measurement campaigns in autumn 2012, 2014 and 2016. Meanwhile, the MAAP measured the BCe concentrations continuously from 2012 to 2017.
The hourly averaged measurement data were combined with 5-day back-trajectories calculated with the HYSPLIT4 model. Thereafter, we utilized a statistical source-receptor trajectory method to convert the measurement data and the air mass back-trajectories into constituent-specific CFs. These CFs were then used to infer information about the potential source regions and their relative importance to our measurement site at Puijo.
Based on the data from three intensive measurement campaigns, a large fraction of particulate organics, nitrate, sulphate and ammonium originated from long-range transport with the most predominant source regions being Central Europe and western parts of Russia. Interestingly, exceptionally high concentrations of sulphate and ammonium were also associated with north-western Russia, i.e. the Timan-Pechora basin characterized by intensive gas flaring activities. Meanwhile, the long-term analysis on BCe suggested a strong contribution from Eastern Europe and western parts of Russia. These regions were clearly distinguishable regardless of measurement year and season, although the absolute concentrations typically peaked during the winter season and early spring.
The concentrations fields, however, did not perfectly agree with simulated surface air concentrations or emission inventories. Apart from nitrate, the trajectory-based CFs suggested relatively stronger contribution from Eastern Europe and Western Russia compared to Central Europe. On the contrary, the modelled surface air concentrations and emissions generally suggested the opposite. This is most likely because the CFs also reflect the probability that an air mass crossing a certain source area is transported to the receptor site. Second, atmospheric processes, such as precipitation scavenging or cloud processing, are not considered in the trajectory analysis. Essentially, this means that the trajectory-based analysis, as such, is not suitable tool for assessing the absolute concentrations or emissions far away from the receptor site. Instead, it provides valuable information about the most predominant source regions relevant to the receptor site. In future studies, however, one could try to tackle this issue by combining simultaneous measurement data from multiple measurement sites. Also, the contribution of secondary aerosol formation from precursor gases should be studied for a more detailed information of most relevant source areas.
Supplemental Material
Download Zip (7.7 MB)Data availability
All the measurement data from the Puijo station are available upon request from the corresponding author ([email protected]).
Disclosure statement
The authors declare no conflict of interest.
Supplemental data
Supplemental data for this article can be accessed here.
Additional information
Funding
References
- Albrecht, B. A. 1989. Aerosols, cloud microphysics, and fractional cloudiness. Science 245, 1227–1230. doi:10.1126/science.245.4923.1227
- Ashbaugh, L. L., Malm, W. C. and Sadeh, W. Z. 1985. A residence time probability analysis of sulphur concentrations at Grand-Canyon National Park. Atmos. Environ. 19, 1263–1270. doi:10.1016/0004-6981(85)90256-2
- Babu, S. S., Chaubey, J. P., Krishna Moorthy, K., Gogoi, M. M., Kompalli, S. K. and co-authors. 2011. High altitude (∼4520 m amsl) measurements of black carbon aerosols over western trans-Himalayas: Seasonal heterogeneity and source apportionment. J. Geophys. Res. 116, D24201.
- Begum, B. A., Kim, E., Jeong, C. H., Lee, D. W. and Hopke, P. K. 2005. Evaluation of the potential source contribution function using the 2002 Quebec forest fire episode. Atmos. Environ. 39, 3719–3724. doi:10.1016/j.atmosenv.2005.03.008
- Bond, T. C., Doherty, S. J., Fahey, D. W., Forster, P. M., Berntsen, T. and co-authors. 2013. Bounding the role of black carbon in the climate system: A scientific assessment. J. Geophys. Res. Atmos. 118, 5380–5552. doi:10.1002/jgrd.50171
- Canagaratna, M. R., Jayne, J. T., Jimenez, J. L., Allan, J. D., Alfarra, M. R. and co-authors. 2007. Chemical and microphysical characterization of ambient aerosols with the aerodyne aerosol mass spectrometer. Mass Spectrom. Rev. 26, 185–222. doi:10.1002/mas.20115
- Cappa, C. D., Zhang, X., Russell, L. M., Collier, S., Lee, A. K. Y. and co-authors. 2019. Light absorption by ambient black and brown carbon and its dependence on black carbon coating state for two California, USA, cities in winter and summer. J. Geophys. Res. Atmos. 124, 1550–1577. doi:10.1029/2018JD029501
- DeCarlo, P. F., Kimmel, J. R., Trimborn, A., Northway, M. J., Jayne, J. T. and co-authors. 2006. Field-deployable, high-resolution, time-of-flight aerosol mass spectrometer. Anal. Chem. 78, 8281–8289. doi:10.1021/ac061249n
- Flanner, M. G., Zender, C. S., Randerson, J. T. and Rasch, P. J. 2007. Present-day climate forcing and response from black carbon in snow. J. Geophys. Res. 112, D11202. doi:10.1029/2006JD008003
- Franke, V., Zieger, P., Wideqvist, U., Acosta Navarro, J. C., Leck, C. and co-authors. 2017. Chemical composition and source analysis of carbonaceous aerosol particles at a mountaintop site in central Sweden. Tellus B: Chem. Phys. Meteorol. 69, 1353387. doi:10.1080/16000889.2017.1353387
- Goldstein, A. H., Koven, C. D., Heald, C. L. and Fung, I. Y. 2009. Biogenic carbon and anthropogenic pollutants combine to form a cooling haze over the southeastern United States. Proc. Natl. Acad. Sci. USA 106, 8835–8840. doi:10.1073/pnas.0904128106
- Hansen, J. and Nazarenko, L. 2004. Soot climate forcing via snow and ice albedos. Proc. Natl. Acad. Sci. USA 101, 423–428. doi:10.1073/pnas.2237157100
- Hansen, J., Sato, M. and Ruedy, R. 1997. Radiative forcing and climate response. J. Geophys. Res. 102, 6831–6864. doi:10.1029/96JD03436
- Hao, L. Q., Romakkaniemi, S., Kortelainen, A., Jaatinen, A., Portin, H. and co-authors. 2013. Aerosol chemical composition in cloud events by high resolution time-of-flight aerosol mass spectrometry. Environ. Sci. Technol. 47, 2645–2653. doi:10.1021/es302889w
- Haywood, J. and Boucher, O. 2000. Estimates of the direct and indirect radiative forcing due to tropospheric aerosols: A review. Rev. Geophys. 38, 513–543.
- Heikkinen, L., Äijälä, M., Riva, M., Luoma, K., Dällenbach, K. and co-authors. 2020. Long-term sub-micrometer aerosol chemical composition in the boreal forest: Inter- and intra-annual variability. Atmos. Chem. Phys. 20, 3151–3180. doi:10.5194/acp-20-3151-2020
- Hellén, H., Praplan, A. P., Tykkä, T., Ylivinkka, I., Vakkari, V. and co-authors. 2018. Long-term measurements of volatile organic compounds highlight the importance of sesquiterpenes for the atmospheric chemistry of a boreal forest. Atmos. Chem. Phys. 18, 13839–13863. doi:10.5194/acp-18-13839-2018
- Huang, K., Fu, J. S., Prikhodko, V. Y., Storey, J. M., Romanov, A. and co-authors. 2015. Russian anthropogenic black carbon: Emission reconstruction and Arctic black carbon simulation. J. Geophys. Res.-Atmos. 120, 11306–11333. doi:10.1002/2015JD023358
- Huang, X. F., He, L. Y., Hu, M., Canagaratna, M. R., Sun, Y. and co-authors. 2010. Highly time-resolved chemical characterization of atmospheric submicron particles during 2008 Beijing Olympic Games using an Aerodyne High-Resolution Aerosol Mass Spectrometer. Atmos. Chem. Phys. 10, 8933–8945. doi:10.5194/acp-10-8933-2010
- Hussein, T., Molgaard, B., Hannuniemi, H., Martikainen, J., Jarvi, L. and co-authors. 2014. Fingerprints of the urban particle number size distribution in Helsinki, Finland: Local versus regional characteristics. Boreal Environ. Res. 19, 1–20.
- Hwang, I. and Hopke, P. K. 2007. Estimation of source apportionment and potential source locations of PM2.5 at a west coastal IMPROVE site. Atmos. Environ. 41, 506–518. doi:10.1016/j.atmosenv.2006.08.043
- Hyvärinen, A. P., Kolmonen, P., Kerminen, V. M., Virkkula, A., Leskinen, A. and co-authors. 2011. Aerosol black carbon at five background measurement sites over Finland, a gateway to the Arctic. Atmos. Environ. 45, 4042–4050. doi:10.1016/j.atmosenv.2011.04.026
- Jayne, J. T., Leard, D. C., Zhang, X. F., Davidovits, P., Smith, K. A. and co-authors. 2000. Development of an aerosol mass spectrometer for size and composition analysis of submicron particles. Aerosol Sci. Technol. 33, 49–70. doi:10.1080/027868200410840
- Koch, D. and Del Genio, A. D. 2010. Black carbon semi-direct effects on cloud cover: Review and synthesis. Atmos. Chem. Phys. 10, 7685–7696. doi:10.5194/acp-10-7685-2010
- Leskinen, A., Arola, A., Komppula, M., Portin, H., Tiitta, P. and co-authors. 2012. Seasonal cycle and source analyses of aerosol optical properties in a semi-urban environment at Puijo station in Eastern Finland. Atmos. Chem. Phys. 12, 5647–5659. doi:10.5194/acp-12-5647-2012
- Lohmann, U. and Feichter, J. 2005. Global indirect aerosol effects: A review. Atmos. Chem. Phys. 5, 715–737. doi:10.5194/acp-5-715-2005
- Matsui, H., Hamilton, D. S. and Mahowald, N. M. 2018. Black carbon radiative effects highly sensitive to emitted particle size when resolving mixing-state diversity. Nat. Commun. 9, 3446. doi:10.1038/s41467-018-05635-1
- McGuire, M. L., Chang, R. Y. W., Slowik, J. G., Jeong, C. H., Healy, R. M. and co-authors. 2014. Enhancing non-refractory aerosol apportionment from an urban industrial site through receptor modeling of complete high time-resolution aerosol mass spectra. Atmos. Chem. Phys. 14, 8017–8042. doi:10.5194/acp-14-8017-2014
- Ng, N. L., Canagaratna, M. R., Zhang, Q., Jimenez, J. L., Tian, J. and co-authors. 2010. Organic aerosol components observed in Northern Hemispheric datasets from aerosol mass spectrometry. Atmos. Chem. Phys. 10, 4625–4641. doi:10.5194/acp-10-4625-2010
- Nicolás, J., Chiari, M., Crespo, J., Galindo, N., Lucarelli, F. and co-authors. 2011. Assessment of potential source regions of PM2.5 components at a southwestern Mediterranean site. Tellus B 63, 96–106. doi:10.1111/j.1600-0889.2010.00510.x
- Paasonen, P., Asmi, A., Petäjä, T., Kajos, M. K., Äijälä, M. and co-authors. 2013. Warming-induced increase in aerosol number concentration likely to moderate climate change. Nat. Geosci. 6, 438–442. doi:10.1038/ngeo1800
- Paatero, P. and Tapper, U. 1994. Positive matrix factorization: A non-negative factor model with optimal utilization of error estimates of data values. Environmetrics 5, 111–126. doi:10.1002/env.3170050203
- Petzold, A., Kramer, H. and Schönlinner, M. 2002. Continuous measurement of atmospheric black carbon using a multi-angle absorption photometer. Environ. Sci. Pollut. Res. Special Issue 4, 78–82.
- Portin, H., Leskinen, A., Hao, L., Kortelainen, A., Miettinen, P. and co-authors. 2014. The effect of local sources on particle size and chemical composition and their role in aerosol-cloud interactions at Puijo measurement station. Atmos. Chem. Phys. 14, 6021–6034. doi:10.5194/acp-14-6021-2014
- Quaas, J., Arola, A., Cairns, B., Christensen, M., Deneke, H. and co-authors. 2020. Constraining the Twomey effect from satellite observations: Issues and perspectives. Atmos. Chem. Phys. Discuss., in review, 1–31. doi:10.5194/acp-2020-279
- Reddington, C. L., McMeeking, G., Mann, G. W., Coe, H., Frontoso, M. G. and co-authors. 2013. The mass and number size distributions of black carbon aerosol over Europe. Atmos. Chem. Phys. 13, 4917–4939. doi:10.5194/acp-13-4917-2013
- Riuttanen, L., Hulkkonen, M., Dal Maso, M., Junninen, H. and Kulmala, M. 2013. Trajectory analysis of atmospheric transport of fine particles, SO2, NOx and O3 to the SMEAR II station in Finland in 1996–2008. Atmos. Chem. Phys. 13, 2153–2164. doi:10.5194/acp-13-2153-2013
- Schneider, J., Mertes, S., van Pinxteren, D., Herrmann, H. and Borrmann, S. 2017. Uptake of nitric acid, ammonia, and organics in orographic clouds: Mass spectrometric analyses of droplet residual and interstitial aerosol particles. Atmos. Chem. Phys. 17, 1571–1593. doi:10.5194/acp-17-1571-2017
- Schneider, J., Weimer, S., Drewnick, F., Borrmann, S., Helas, G. and co-authors. 2006. Mass spectrometric analysis and aerodynamic properties of various types of combustion-related aerosol particles. Int. J. Mass Spectrom. 258, 37–49. doi:10.1016/j.ijms.2006.07.008
- Stein, A. F., Draxler, R. R., Rolph, G. D., Stunder, B. J. B., Cohen, M. D. and co-authors. 2015. NOAA’s HYSPLIT atmospheric transport and dispersion modeling system. Bull. Am. Meteorol. Soc. 96, 2059–2077. doi:10.1175/BAMS-D-14-00110.1
- Stohl, A. 1996. Trajectory statistics – A new method to establish source-receptor relationships of air pollutants and its application to the transport of particulate sulfate in Europe. Atmos. Environ. 30, 579–587. doi:10.1016/1352-2310(95)00314-2
- Stohl, A., Klimont, Z., Eckhardt, S., Kupiainen, K., Shevchenko, V. P. and co-authors. 2013. Black carbon in the Arctic: The underestimated role of gas flaring and residential combustion emissions. Atmos. Chem. Phys. 13, 8833–8855. doi:10.5194/acp-13-8833-2013
- Su, L., Yuan, Z., Fung, J. C. and Lau, A. K. 2015. A comparison of HYSPLIT backward trajectories generated from two GDAS datasets. Sci. Total Environ. 506–507, 527–537. doi:10.1016/j.scitotenv.2014.11.072
- Sun, J. Y., Zhang, Q., Canagaratna, M. R., Zhang, Y. M., Ng, N. L. and co-authors. 2010. Highly time- and size-resolved characterization of submicron aerosol particles in Beijing using an Aerodyne Aerosol Mass Spectrometer. Atmos. Environ. 44, 131–140. doi:10.1016/j.atmosenv.2009.03.020
- Sun, Y. L., Du, W., Wan, Q. Q., Zhang, Q., Chen, C. and co-authors. 2015. Real-time characterization of aerosol particle composition above the urban canopy in Beijing: Insights into the interactions between the atmospheric boundary layer and aerosol chemistry. Environ. Sci. Technol. 49, 11340–11347. doi:10.1021/acs.est.5b02373
- Sun, Y., Xu, W., Zhang, Q., Jiang, Q., Canonaco, F. and co-authors. 2018. Source apportionment of organic aerosol from 2-year highly time-resolved measurements by an aerosol chemical speciation monitor in Beijing, China. Atmos. Chem. Phys. 18, 8469–8489. doi:10.5194/acp-18-8469-2018
- Twomey, S. 1974. Pollution and the planetary albedo. Atmos. Environ. 8, 1251–1256. doi:10.1016/0004-6981(74)90004-3
- Ulbrich, I. M., Canagaratna, M. R., Zhang, Q., Worsnop, D. R. and Jimenez, J. L. 2009. Interpretation of organic components from positive matrix factorization of aerosol mass spectrometric data. Atmos. Chem. Phys. 9, 2891–2918. doi:10.5194/acp-9-2891-2009
- Väisänen, O., Ruuskanen, A., Ylisirniö, A., Miettinen, P., Portin, H. and co-authors. 2016. In-cloud measurements highlight the role of aerosol hygroscopicity in cloud droplet formation. Atmos. Chem. Phys. 16, 10385–10398. doi:10.5194/acp-16-10385-2016
- Weimer, S., Alfarra, M. R., Schreiber, D., Mohr, M., Prevot, A. S. H. and co-authors. 2008. Organic aerosol mass spectral signatures from wood-burning emissions: Influence of burning conditions and wood type. J. Geophys. Res. 113, D10304.
- Zhang, Q., Worsnop, D. R., Canagaratna, M. R. and Jimenez, J. L. 2005. Hydrocarbon-like and oxygenated organic aerosols in Pittsburgh: Insights into sources and processes of organic aerosols. Atmos. Chem. Phys. 5, 3289–3311.