
 ?Mathematical formulae have been encoded as MathML and are displayed in this HTML version using MathJax in order to improve their display. Uncheck the box to turn MathJax off. This feature requires Javascript. Click on a formula to zoom.
Abstract
Aerosol particles are major short-lived climate forcers, because of their ability to interact with incoming solar radiation. Therefore, addressing mean levels and sources of Arctic aerosols is of high importance in the battle against climate change, due to the Arctic amplification. In the Eastern Arctic, from Finland to Alaska, only one monitoring station exists (HMO Tiksi) and the levels of the Arctic aerosols are usually recorded by sporadic campaigns, while other stations exist in Canada, Finland and Europe. From April 2015 to December 2016, the research station "Ice Base Cape Baranova" (79°16.82'N, 101°37.05'E), located on the Bolshevik island was established in the Siberian high Arctic. Samples were analyzed for equivalent Black Carbon (eBC), Organic Carbon (OC), Elemental Carbon (EC), water-soluble ions, and elements. To identify the spatial origin of the sources, the Potential Source Contributions Function (PSCF) was used in combination with FLEXPART emission sensitivities. OC is the most dominant PM compound in the Ice Cape Baranova station and mostly originates from gas flaring and other industrial regions at lower latitudes, as well as from biomass burning during summertime. Sulfate concentrations were affected by anthropogenic sources in the cold seasons and by natural sources in the warm ones showing distinct seasonal patterns. K+ and Mg2+ originate from sea-salt in winter and from forest fires in summer. The interannual variability of eBC was in good agreement with the general Arctic seasonal trends and was mainly affected by gas flaring, low latitude industrial sources and from biomass burning emissions. Cl− depletion was very low, while Na+ and Cl− originated from the locally formed sea spray.
1. Introduction
The Arctic is the most sensitive region in the world with respect to temperature increases and the climatic effects of air pollution (Shindell and Faluvegi, Citation2009). Ice melting is accelerated when carbonaceous particles are deposited on snow and ice surfaces, reducing surface albedo, and leading to a temperature-albedo feedback that amplifies Arctic warming (Dou et al., Citation2012; Jacobi et al., Citation2019; Stone et al., Citation2014). Aerosol particles are major climate forcers in the Arctic, as they scatter and absorb incoming solar radiation, modify clouds properties and affect surface albedo (Shindell and Faluvegi, Citation2009). The chemical composition of aerosols is an important parameter that defines their impact on climate, as various chemical components have different global warming potential (Breider et al., Citation2017). Most of the absorption of radiation by accumulation-mode aerosol is due to black carbon (BC), which also influences cloud radiative properties (Yun et al., Citation2013).
BC is a very important contributor to global warming, having a contribution equal to about two thirds of that from carbon dioxide (Bond et al., Citation2004; Khan et al., Citation2012). Originating from local and regional fossil fuel and biofuel combustion sources, in addition to natural and anthropogenic biomass burning, it is emitted and transported together with organic carbon (OC) (Stohl et al., Citation2013; Wang et al., Citation2011) and exerts a warming effect that contrasts the cooling effect of sulfates through scattering and induced cloud formation.
Arctic Haze is a phenomenon that was first reported in 1950s but it took almost 20 years for scientists to realize that the haze was pollution transported to the Arctic region from middle latitudes (Barrie, Citation1986). The Arctic Haze is a mixture of sulfate and particulate organic matter and to a lesser extent ammonium, nitrate, BC, trace metal and dust aerosols (Law and Stohl, Citation2007) and has an important impact on optical properties (Zanatta et al., Citation2018). The Arctic Haze has a seasonal cycle (Eleftheriadis et al., Citation2009) with a maximum in late winter and early spring. This is due to more frequent poleward atmospheric transport of pollution from the mid-latitudes to the Arctic in winter and spring, on one hand, and to the expansion of the polar vortex southwards, on the other (Klonecki, Citation2003; Sharma et al., Citation2013, Stone et al., Citation2014). Furthermore, the boundary layer is shallower in winter, enhancing BC concentrations at low altitudes, which may then be mixed to the surface (Sharma et al., Citation2013).
The AMAP (Arctic Monitoring Assesement Programme) assessment includes observation results from six Arctic stations, including Alert (82.45°N, 62.52°W), Barrow (71.32°N, 156.6°W), Summit (72.60°N, 38.42°W), Zeppelin (78.91°N, 11.88°E), Pallas (67.97°N, 24.12°E) and Station Nord (81°36’N,16°39’W) (AMAP, Citation2015). These Arctic stations record aerosol optical properties and provide concentrations of aerosol components (Schmeisser et al., Citation2018; Uttal et al., 2016). Such studies have significantly expanded our knowledge about BC and OC pollution into the Arctic (Chang et al., Citation2011; Nguyen et al., Citation2013; Stohl et al., Citation2007).
Long-range pollution transport to the Arctic is known to carry aerosol compounds that can be used as tracers of anthropogenic activities and wildfires, and help to identify the regions of pollutant origin (Frossard et al., Citation2014; Koch et al., 2009; Warneke et al., Citation2010). According to results from previous studies in the region (Tiksi station, Russian high Arctic), the isotope-constrained source apportionment pinpoint that biomass burning sources dominate during low BC concentration periods in summer, whereas fossil sources sources mostly prevail during the Arctic Haze season (Winiger et al., Citation2017). In many studies, statistical trajectory methods such as potential source contribution function (PSCF) (Chang et al., Citation2011; Polissar et al., Citation1998) and concentration weight trajectories (CWT) (Hsu et al., Citation2003) have been used in combination with aerosol data to identify potential source areas. Transport, industry, gas flaring, and residential emissions have been found to be responsible for anthropogenic BC and OC in the Arctic (Popovicheva et al., Citation2017a; Stohl et al., Citation2013; Wang et al., Citation2011). The source-related chemical composition of Arctic aerosols are still poorly represented in models having for a long time struggled to capture the distribution of aerosol characteristics. This is due to difficulties in simulating aerosol removal processes, missing emission sources or incorrect spatiotemporal distribution of emissions in the inventories (Huang et al., Citation2015; Schacht et al., Citation2019).
In the Siberian high Arctic, the knowledge of the aerosol chemical composition has poor spatiotemporal coverage, due to the small number of monitoring sites and logistical difficulties associated with these sites. Recently, a few BC measurements were performed in the Siberian Arctic, mostly from field campaigns over the Arctic (Popovicheva et al., Citation2017a; Sakerin et al., Citation2015; Stohl et al., Citation2013), and from the drifting station “North Pole” (Stock et al., Citation2012). Model validation has been benefited from observations performed in the proximity of the major industrial sources (Popovicheva et al., Citation2017a). The only station reporting results for long-term BC (Eckhardt et al., 2015), aerosol number density and size distribution (Asmi et al., Citation2016), and aerosol composition (ions, OC, EC) measurements (Popovicheva et al., Citation2019) is the Hydrometeorological Observatory (HMO) Tiksi (71.36 N; 128.53E) station, located in the East Northern Siberia on the coast of the Laptev Sea. The extensive knowledge about aerosol chemical components in the Siberian high Arctic provides valuable information about the seasonal variability, trends, and sources that affect air quality in this part of the Arctic region.
The research station “Ice Base Cape Baranova” is newly developed at the cape Baranova, Bolshevik Island, at the Severnaya Zemlya archipelago (79.16 N; 101.45E). It is located at the same latitude as Ny-Ålesund station of Spitsbergen archipelago, but is closer to the BC source regions of Eurasia. In this work, results from a comprehensive characterization of aerosol composition and the geographical origin of PM sources are reported for this station. Carbonaceous, elemental, and ionic composition, were determined during 2015–2016. Statistical Trajectory Methods (STMs) were used to identify the main transport pathways of aerosols providing a better understanding of the origin of aerosol pollution in the Siberian High Arctic.
2. Sampling and analysis
2.1. Sampling site
The research station “Ice Base Cape Baranova” is located on the coast (at sea level) of the Shokal Strait, which divides Bolshevik and Oktiabrskay Revolution islands of the Severnya Zemlya Archipelago (). The area adjacent to the station is characterized by a wide range of natural sea ice (drifting and soldering), lake and river origin, powerful (up to 800 m) dome-shaped glaciers and numerous icebergs. This area has a pronounced landscape of polar desert. The polar night and day last from October 22 to February 22 and from April 22 to August 22, respectively. The air temperature in summer (June-August) is from 0 to 4°С. In winter (October–April) temperatures range from −25° to − 45°С. The area is characterized by stable winds mainly from the southern direction with an average speed of 10–15 m/s, which during the transition periods of the year can reach 50 m/s. The prevailing wind is southwest.
Fig. 1. Geographical location of «Ice Base Cape Baranova station» on the Bolshevik Island (http://globalcryospherewatch.org) (left panel), and aerosol pavilion (right panel).
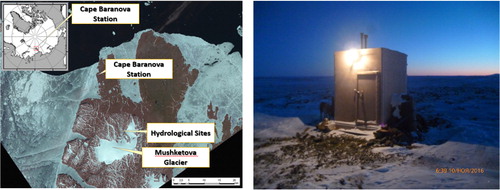
For atmospheric composition observations and sampling, the aerosol pavilion was purposely built approximately 1 km southeastst from the main station (). The basic meteorological parameters, such as wind speed, wind direction, temperature, relative humidity, and pressure were obtained every 1 hour by the station weather service. Also, the major advantage of this station is its location far from any local anthropogenic sources. For instance, previous research has shown significant impact of local sources on measurements performed on the HMO Tiksi station (Popovicheva et al., Citation2019).
2.2. Aerosol light absorbing carbon measurements
Highly time resolved measurements of the aerosol absorption coeffient were obtained from 18/10/15 to 5/4/16 by operating a portable aethalometer. It was purposely designed by the Moscow State University (MSU)/Central Aerological Observatory (CAO) and was used in a number of previous campaigns (Popovicheva et al., Citation2017a, Citation2017b). In this instrument, light attenuation caused by the particles depositing on a quartz fiber filter is measured at three wavelengths (450, 550, and 650 nm). In previous studies еBC concentrations were determined by converting the time-resolved light attenuation to eBC mass using the 650 nm channel and characterized by a specific mean mass attenuation coefficient as described elsewhere (Popovicheva et al., Citation2017a). Calibration of еBC was performed during parallel long-term measurements against an AE33 aethalometer (Magee Scientific) that operates at seven wavelengths, three of them identical with the MSU unit. As the principle of operation for the two instruments is the same, with the exception of the improved compensation regarding the loading effect offered by the AE33 (Drinovec et al., Citation2015), data analysis from this AE33 calibration experiment can be also adjusted to provide the scheme of calculation for the absorption coefficient (σ0). In any case the loading effect can be disregarded for the longest wavelength output reported here and the low arctic BC loadings. The multiple scattering factor Cref is a parameter required for data processing and conversion to absorption coefficents. It has been determined for the arctic aerosol close to 3.5 in a previous study and can be adjusted to 2.5 given the already incorporated factor in the AE33 (Backman et al., Citation2017). The attenuation coefficient batn is defined as:
(1)
(1)
where A is the filter exposed area, V is the volume of air sampled, and δATN is the light attenuation defined as follows:
(2)
(2)
where Io and I is the light intensity transmitted through unexposed and exposed parts of the filter, respectively. A good linear correlation between the attenuation coefficient batn and A σ0 calculated by the AE33 aethalometer (at 660 nm) was achieved (R2 = 0.92). This allowed estimating the absorption coefficientas follows:
(3)
(3)
where 1.32 × 10³ is the correction factor that includes the appropriate Cref factor for arctic aerosol.
The data retrieved from the aethalometer were postprocessed in order to remove outlier values. A value is considered as an outlier if it exceeds its previous value in the time-series by more than 3 times the standard deviation of the last 10 values. If this criterion was met, then the value was removed from the dataset. With this approach, extremely high concentrations that do not follow the general trend and can be attributed to local contamination (e.g., from diesel generators operating at the station) were removed. The outliers were less than 5% of the total number of values for every season. Data screening/cleaning is a standard procedure in Arctic stations. For example, monitoring data from Barrow and Alert are routinely cleaned, while Zeppelin measurements are generally not strongly influenced by local emission sources (AMAP, Citation2015; Eckhardt et al., Citation2013).
2.3. Aerosol sample collection
An 18-month campaign was conducted from April 2015 to December 2016. Particles of mean aerodynamic diameter less than 10 µm (PM10) were collected using the Comde Derenda sampling system with 2.3 m3 per hour pumped airflow. The sampling time was 48-72 hours per sample depending on the season, atmospheric particulate loading, and weather conditions. Sampling volume was corrected to standard atmosphere conditions (0 °C, 1 atm). Teflon and quartz filters, heated prior to their use at 500 °C for 6 h, were used for elemental and ionic/carbon analyses. In total, 120 samples were collected and analyzed.
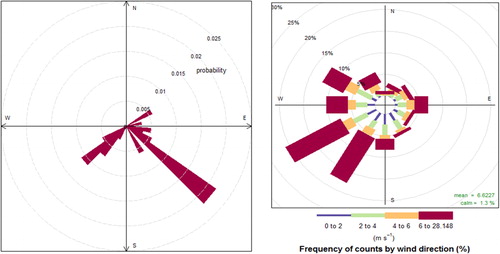
To determine whether samples had been affected by local emissions from the station diesel generator, polar plots and wind roses were also analyzed. In general, EC is expected to have the highest local influence, due to the use of diesel generators operating in the nearby monitoring station settlement, as it has been previously seen (Popovicheva et al., Citation2019). shows the CPF (Conditional Probability Function) for EC. Even though winds from the NW sector (location of the station settlement) are not infrequent, no significantly high EC concentrations were observed from that location.
Fig. 2. Left: CPF for the 95th percentile for EC. Right: Wind rose for the study period.
2.4. Off-line aerosol chemical characterization
Bulk composition of collected samples were analyzed with a number of analytical tools. For the elemental analysis of PM10 samples, the high energy, polarization geometry energy dispersive XRF spectrometer Epsilon 5 by PANalytical was used. Epsilon 5 is constructed with optimized Cartesian‐triaxial geometry composing of several secondary targets for attaining lower spectral background and with extended K line excitation provided by the capability to operate the X‐ray tube at the maximum high voltage of 100 kV. The secondary target‐XRF spectrometer includes a side‐window low power X‐ray tube with a W/Sc anode (spot size 1.8–2.1 cm, 100 kV max voltage, 6 mA current, 600 W maximum power consumption). The characteristic X‐rays emitted from the sample are detected by a Ge X‐ray detector with 140 eV FWHM at MnKα, 30 mm2 and 5 mm thick Ge crystal with 8 μm Be window. The used spectrometer is equipped with eight secondary targets (Al, CaF2, Fe, Ge, Zr, Mo, Al2O3, KBr and LaB6) that can polarize the X‐ray tube generated incident radiation through the Barkla scattering. The methodology that was used for the elemental composition analysis is described in detail elsewhere (Manousakas et al., Citation2018). The 20 elements determined by the ED‐XRF method were Na, Mg, Al, Si, S, Cl, K, Ca, Ti, V, Cr, Mn, Fe, Co, Ni, Cu, Zn, Br, Sr, and Pb, but only 5 of them were found in a concentration higher than the detection limit (Na, S, Cl, Ca, Fe).
Carbon fractions were measured by thermo-optical transmittance (TOT) analysis (Lab OC-EC Aerosol Analyzer, Sunsett Laboratory, Inc.) (Diapouli et al., Citation2017). Quartz filter samples were heated up to 650 °C in He, at first, and then up to 850 °C in a mixture of 2% O2 in He, using the controlled heating ramps of the EUSAAR_2 thermal protocol (Cavalli et al., Citation2010). This protocol has been initially developed for regional background sites. Organic carbon (OC) evolved in the inert atmosphere, while elemental carbon (EC) was oxidized in the He-O2 atmosphere. Charring correction was applied by monitoring the sample transmittance throughout the heating process. The limit of detection (LOD) for the TOT analysis is 0.2 μg C cm−2. Before sampling, the quartz fiber filters were pre-treated at 500 °C for 6 h to re- move possible OC contaminations. Lab and field blanks were prepared and run following the same procedures as adopted for the samples. The QA/QC procedures described in EN 16909:2017 were followed during TOT analysis.
Water-soluble ion components were measured by capillary electrophoresis using the Capel 103 system (Lumex) with the UF detection, as described elsewhere (Popovicheva et al., Citation2017b). One quarter of the sample was extracted in 5 ml of distilled water by ultrasonic agitation for 45 min, and then the extract was filtered. Inorganic anions and cations were measured in aqueous extracts with a relative standard deviation of 10%.
2.5. Atmospheric transport modelling
To accurately investigate the possible origin of the observed particles, the Lagrangian particle dispersion model FLEXPART (FLEXible PARTicle dispersion model) version 10.4 was used (Pisso et al., Citation2019). The model was driven with 3-hourly operational meteorological analyses from the European Centre for Medium-Range Weather Forecasts (ECMWF) with 137 vertical layers and a horizontal resolution of 1°×1°. Computational particles were released from Ice Cape Baranova station and were tracked 30 days back in time in FLEXPART’s so-called “retroplume” mode, which is a sufficient time to include most aerosol emissions arriving at the station, given a typical aerosol lifetime (∼1 week).
The tracking includes gravitational settling characteristics for spherical particles of the size observed. FLEXPART differs from trajectory models due to its ability to simulate dry and wet deposition of gases or aerosols (Grythe et al., Citation2017), turbulence (Cassiani et al., Citation2015), unresolved mesoscale motions (Stohl et al., Citation2005) and includes a deep convection scheme (Forster et al., Citation2007). The model output consists of an emission sensitivity, which is a quantitative measure for the particle mass concentration at the sampling location that would result from a unit emission flux at the Earth’s surface. The emission sensitivity can also be interpreted as a probability distribution field of the particle’s origin. We used it here to identify possible source regions of particles, as described in the previous section.
2.6. Potential source contribution function analysis
To identify the spatial origin of the aerosol components, the Potential Source Contributions Function (PSCF) was used in combination with FLEXPART emission sensitivities. PSCF calculates the probability of a source region to be located at a certain latitude and longitude. The basis of PSCF is that if a source is located at (i,j), an air parcel passing through that location indicates that material from the source can be collected and transported along the trajectory to the receptor site. PSCF is given by the following the equation:
(4)
(4)
where nij is the number of times that the trajectories passed through the cell (i,j) and mij is the number of times that a source concentration was high when the trajectories passed through the cell (i,j). The criterion for determining mij is controlled by percentiles. In the present study, the 70th percentile was used for PSCF calculation.
3. Results and discussion
3.1. Absorption coefficients and black carbon
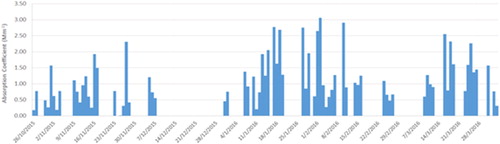
The 3-hourly Absorption coefficients during the period of our study ranged from 0.01 to 3.05 Mm−1 (). The highest monthly averaged Absorption coefficients were observed in January (1.01 ± 0.70 Mm−1) and the lowest ones in April and October (0.39 ± 0.36 Mm−1). Absorption coefficient measurements were used together with the EC data to estimate the MAC for this Arctic site. MAC was calculated at 650 nm wavelengtgh equal to 4.12 m2/g. This rather low values are in line with the expected range of values for bare BC particles as we are using the EC concentration for the calculation, as described in Zanatta et al., (2018).
Fig. 3. Time series of 3 h average aerosol Absorption coefficient (Mm−1) at the wavelength of 650 nm.
Using the calculated MAC value with the Absorption coefficients, eBC was estimated to compare the data with the available information of BC concentrations in the Arctic. In general, Arctic BC shows peak concentrations during winter and early spring months, due to the Arctic Haze phenomenon (Stone et al., Citation2014). The average 3-hourly eBC concentrations during the period of our study was 139 ± 120 ng/m3. Similarly to Absorption coefficients, eBC variation shows that the highest monthly averaged concentrations were observed in January (245 ± 169 ng/m3) and the lowest ones in April and October (94.6 ± 87.4 ng/m3). The climatology of atmospheric transport from surrounding regions has shown that Arctic stations are highly sensitive to high-latitude emissions from Eurasia (Eleftheriadis et al., Citation2009; Popovicheva et al., Citation2019; Sharma et al., Citation2004). This is in good agreement with the winter seasonal trend of Arctic aerosol concentrations reported by Eleftheriadis et al. (Citation2009), who measured an average annual concentration of 39 ng/m3, and an average wintertime concentration of 300 ng/m3 in Ny-Ålesund. Furthermore, the mean eBC concentration at HMO Tiksi during winter was found equal to 187 ± 38 and 127 ± 28 ng/m3 in 2014–2015 and 2015–2016, respectively (Popovicheva et al., Citation2019). eBC concentrations during winter at Ice Base Cape Baranova and HMO Tiksi stations are high compared with respective levels observed at Alert (100 ± 65 ng/m3) (Sharma et al., Citation2004) or any other of the Arctic stations. For instance, eBC concentrations at Alert, Barrow, Zeppelin and Summit show monthly median concentrations of 20–80 ng/m3 in late winter/early spring and <10 ng/m3 in summer/early autumn (AMAP, Citation2015). Seasonal variation of eBC concentrations was weaker at the southernmost Pallas station, where summer concentrations were double reflecting a decrease in the seasonal minimum with latitude. This finding leads to the conclusion that the Ice Base Cape Baranova station is significantly influenced by emissions from high-latitude sources of Siberia.
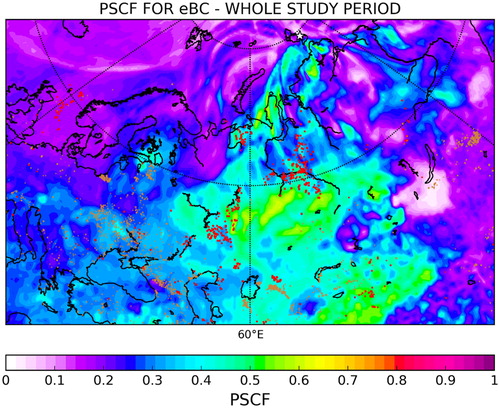
To capture the origin of the air masses ariving at this station and, in turn, the potential sources, PSCF analysis for eBC was performed (). PSCF probability is enhanced over the gas flaring regions (shown as red dots in ) of (Khanty-Mansiysk Okrug, Nenets-Komi, and Yamal- Nenetzk Okrug Peninsula) and Kazakhstan, where BC emissions are high. Gas flaring is reported to be the major source of BC in Siberian Arctic having a contribution of 36.2%, followed by residential emissions, transportation, industry, and power plants, that contribute 25.0%, 20.3%, 13.1%, and 5.4%, respectively (Huang et al., Citation2015). Based on an estimate of the BC emission from flaring, up to 12% of the total BC emissions from the Arctic Council nations in 2000, primarily originates from northern part of Siberia (AMAP, Citation2015). It is noteworthy that biomass burning emissions are not expected to have large contribution on eBC concentrations in Ice Cape Baranova, because eBC measurements took place from November to April only, when forest fire activity in boreal regions is limited. This is also proved by MODIS active fires (brown dots), which were plotted in for the measurement period, and are shown to be limited in mid-latitudes. Other potential sources that may contribute to eBC concentrations in this high Arctic station are inhabited and industrial regions of Siberia, as well as north China and Kazakhstan. One of the possible transport patterns of aerosols to the Arctic from lower latitudes is a 10–15 day low level transport of already cold air masses into the polar dome, which is associated with further diabatic cooling (Stohl, Citation2006). The transport patterns intensify the climatic risk of BC with respect to its ability to act as light absorbing impurity when deposited on snow and ice surfaces (Shindell and Faluvegi, Citation2009).
Fig. 4. PSCF analysis for eBC. The red dots in the map represent the gas flaring regions from the Global Gas Flaring Reduction Partnership (GGFR), http://www.worldbank.org/en/programs/gasflaringreduction) while the brown dots represent active fires from MODIS (Giglio et al., Citation2003).
3.2. Organic carbon and elemental carbon
Organic carbon (OC) accounts for a significant fraction of the Arctic aerosol masses (Chang et al., Citation2011). OC tends to be elevated, due to biogenic emissions and secondary aerosol formation from biogenic volatile organic compounds, wind-induced bubbles bursting from the sea surface (Frossard et al., Citation2014), fossil fuel combustion (Barrett et al., Citation2015) as well as biomass burning (agricultural and wildfires) (Stohl et al., Citation2007; Warneke et al., Citation2010). The descriptive statistics of PM10 size mode EC/OC measured in Ice Base Cape Baranova station are presented in for the whole study period and per season. The average concentration of OC for the sampling period was estimated as 677 ± 322 ng/m3 and is dominant over other aerosol compounds, with a maximum in winter (760 ± 398 ng/m3).
Table 1. Descriptive statistics (average, stdev, min, max) for EC and OC in ng/m3 per season (Winter: Dec-Feb, Spring: Mar-May, Summer: Jun-Aug, Autumn: Sep-Nov).
shows time-serie concentrations of OC, with maxima of up to 1400 ng/m3 in January. For comparison, OC concentrations at the HMO Tiksi have been found as high as 2300 ng/m3 in winter-spring followed by a decreasing trend in summer-autumn, which is in agreement with typical seasonal trends of Arctic aerosols (Popovicheva et al., Citation2019). However, OC concentrations were found to be higher in September (up to 3600 ng/m3), while some high OC values were also recorded during June 2016. These peak concentrations of OC were observed during periods when Arctic aerosol levels are expected to be low and are likely attributed to local OC pollution.
Fig. 5. Time series of EC and OC in ng/m3 (EC correspond to secondary axis).
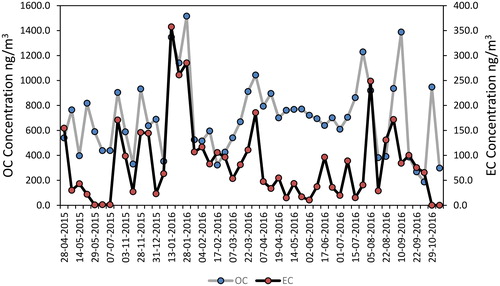
The average concentration of EC was estimated to be 82.0 ± 70.0 ng/m3 in winter (maximum: 142 ± 120 ng/m3) (). EC concentrations were higher than those from other Arctic stations (AMAP, Citation2015) and comparable with those reported by Popovicheva et al., Citation2017a. Popovicheva et al. (Citation2017a) measured eBC concentrations of the order of 200–400 ng/m3 during a research ship cruise in the White, Barents and Kara seas, north of the region characterized by high flaring emissions. The seasonal variation of EC concentrations is more pronounced than for OC showing large peaks attributed to haze events in January followed by significantly lower concentrations in the next month (), although sporadic maxima were present. The average OC/EC ratio was found equal to 12. High OC/EC ratios are typical for natural background sites; they result from high OC concentrations (due to biogenic emissions and secondary organic aerosol formation) coupled with negligible EC concentrations (due to minimum anthropogenic activities, and specifically combustion sources) (Popovicheva et al., Citation2019).
The PSCF analysis for EC and OC is presented in . High PSCFs of continental origin were observed for EC and OC (). As shown in previous studies (Fu et al., Citation2009, Citation2013), primary organic aerosols from biogenic emissions, due to long-range transport, sea-to-air emission of marine organics, and photooxidation of biogenic VOCs, are important factors controlling the organic chemical composition of marine aerosols in the Arctic. This shows that while EC is transported to Arctic regions, OC might be formed as secondary product when solar activity is higher.
Fig. 6. PSCF analysis for EC and OC. The red dots in the map represent the gas flaring regions from (Global Gas Flaring Reduction Partnership (GGFR), http://www.worldbank.org/en/programs/gasflaringreduction) while the brown dots represent active forest fires from MODIS (Giglio et al., Citation2003).
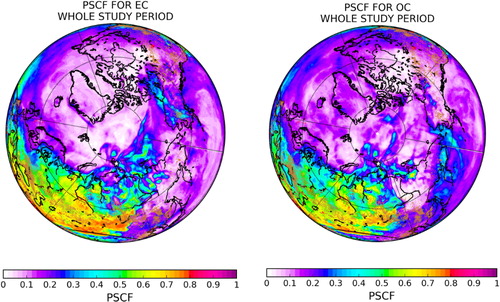
The characteristic contribution from the industrial and gas-flaring sources (red dots) of Northern Siberia (Nenets-Komi, Yamal- Nenetz Okrug, peninsula and Khanty-Mansiysk Okrug) is also shown for all seasons both for EC and OC. As mentioned in the previous section for eBC, gas-flaring is of major importance in the Arctic region (Eckhardt et al., 2015; Stohl et al., Citation2013). Even though EC is higher during winter, it is not negligible during spring as well. This might be due to biomass burning emissions (brown dots), as these emissions has been found to contribute 36% to total BC with the highest peaks occurring in late spring and summer months (Hyvärinen et al., Citation2011). EC concentrations in Ice Cape Baranova are mainly affected by nearby industrial sources in winter and from forest fires and other European and Asian sources during the other seasons, as maximum observed PSCF regions have shifted further south (). OC shows similar maxima as for EC indicating large impact from the Northern Siberian flaring regions throughout the whole year, as these sources are more or less constant (Klimont et al., Citation2017).
3.3. Ionic and elemental composition
Long-term surface measurements indicate that aerosols in the North American, Norwegian, Finnish and Russian Arctic mainly consist of sulfates and to a lesser extent of organics, ammonium, nitrates, and BC during the spring months (March and April) (Quinn et al., Citation2007). Sulfates may originate from biological activity, such as oxidation of dimethyl sulfide. High sulfate concentrations are related to transport from regional sources and secondary sulfates from continental regions (Eckhardt et al., 2015). Sulfates designate the distinct temporal pattern of the Arctic Haze defining whether or not the observed concentration in the sampling site have been affected by long-range transport.
presents the ionic and elemental composition of aerosols observed in the Ice Base Cape Baranova station from April 2015 to December 2016. The average concentration of sulfates was 390 ± 290 ng/m3 for the whole study period. Sulfates were also observed to present high seasonality with an average concentration of 603 ± 462 ng/m3 during winter and 184 ± 170 ng/m3 during summer.
Table 2. Average concentrations ± standard deviation of measured PM components (ions and elements) in ng/m3 from April 2015 to December 2016 (Warm: summer, Cold: winter, spring).
Sulfates present a moderate Pearson correlation with NH4+ and NO3- (0.58 and 0.56 respectively), which indicates that they are influenced by regional sources of secondary aerosol formation and transport. To evaluate whether H2SO4 was neutralized by ammonia or not, the correlation between NH4+ and SO42- was examined showing an R2 of 0.58, which indicates no neutralisation. However, the aforementioned correlation might be misleading, as SO42− can also have sea and crustal origin (Udisti et al., Citation2016).
Cl− and Na+ also present relatively high concentrations at the station, with average concentrations of 270 ± 255 and 230 ± 220 ng/m3 respectively (); similar concentrations were reported by (Sakerin et al., 2019) at the same region. Cl−, Na+, K+ and Mg2+ were correlated moderately (∼ 0.6), while the average Na+/Cl− ratio was estimated as 1.1, which indicates that both ions originate from locally formed sea spray. According to reported results from other Russian high Arctic stations (e.g., HMO Tiksi), Cl depletion can also be important in the region (Popovicheva et al., Citation2019).
To estimate the anthropogenic origin of sulfates, the non-sea salt, non-crustal part of SO42− was calculated following the methodology described in (Becagli et al., Citation2012; Udisti et al., Citation2016). The concentrations of total (tot), sea-salt (ss) and non- sea salts (nss) Ca2+ and Na+ were calculated using the following four equations:
(5)
(5)
(6)
(6)
(7)
(7)
(8)
(8)
where 0.562 represents the Na+/Ca2+ weight-to-weight (w/w) ratio in the crust, and 0.038 is the Ca2+/Na+ w/w ratio in seawater.
The non-sea salt, non-crustal (nss-ncrSO42−) was calculated as the difference between totSO42− and ssSO42− and crSO42−. The ratio of nss-ncrSO42−/totSO42− was found higher than 0.8 during the cold season indicating anthropogenic origin of SO42−, while during the warm season nss-ncrSO42- was in most cases equal to zero, indicating that SO42− is mainly affected by natural sources.
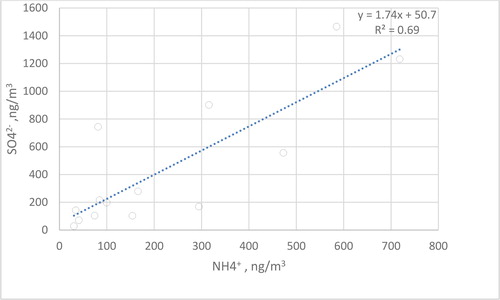
The correlation between nss-ncrSO42− and NH4+ for the cold season is presented in . The correlation coefficient was calculated equal to 0.70 indicating that H2SO4 is neutralized by NH3. Considering that nss-ncrSO42−/totSO42− ratio is highly dependent on the season (close to unity during the cold season), it can be used as an indicator of the anthropogenic origin of the aerosol particles.
Fig. 7. Correlation between nss-ncrSO42- and NH4+ for the cold season.
As regards to the observed elemental composition (), S presents the highest average concentration (151 ± 124 ng/m3) followed by Na and Cl (90.7 ± 56.0 and 113 ± 78.0 ng/m3) and Ca (93.5 ± 71.1 ng/m3). The Na/Cl ratio was calculated to be almost 1 indicating the sea origin of those elements in combination with low Cl depletion (Cesari et al., Citation2016). Elements of crustal origin, such as Ca and Fe, present much higher concentrations during the warm season, due to dust resuspension and lower in wintertime, when snow cover does not allow this process.
The reconstructed PM10 mass was calculated for the warm (summer, autumn) and the cold (winter, spring) periods of the year. Mass reconstruction was based on the carbonaceous, ionic and elemental composition of the PM samples. The average reconstructed PM10 concentration for the cold season was calculated equal to 2.83 ± 2.20 μg/m3 and 2.05 ± 1.81 μg/m3 in the warm season. The average reconstructed PM10 mass concentration was 38% higher during the cold season of the year. PM10 concentrations were comparable with those reported in PM15 at Sevettijarvi (2.9 μg/m3 in winter and 3.9 μg/m3 in summer) (Laakso et al., Citation2003 and references within).
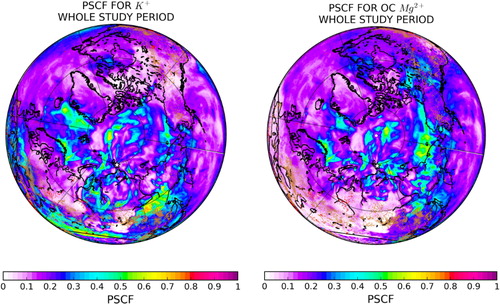
The PSCF analysis for K+, Mg2+, SO42− and NH4+ is depicted in . The source contribution analysis for SO42- and NH4+ reveals that their main origin is rather continental similar to EC. Regarding the K+ and Mg2+, their main origin is sea related emissions, while it is apparent that their concentrations are also affected by forest fires.
Fig. 8. PSCF analysis for K+, Mg2+, SO42- and NH4+. The red dots in the map represent the gas flaring regions from (Global Gas Flaring Reduction Partnership (GGFR), http://www.worldbank.org/en/programs/gasflaringreduction) while the brown dots represent active forest fires from MODIS (Giglio et al., Citation2003).
4. Summary
Chemical composition analysis of aerosols at the research station "Ice Base Cape Baranova" reveals respective levels and seasonality of the PM components. The average concentration of OC was estimated to be 677 ± 322 ng/m3 and was dominant among other aerosol compounds with a maximum in winter (760 ± 398 ng/m3). The average concentration of EC was 82 ± 70 ng/m3, and it reached 142 ± 120 ng/m3 in wintertime. High EC concentrations in winter and early spring were related with continental origin. Regarding EC and OC, gas flaring and wildfires regions were identified as the most important contributors of EC at the station.
The highest monthly averaged Absorption coefficients were observed in January (1.01 ± 0.70 Mm−1) and the lowest ones in April and October (0.39 ± 0.36 Mm−1). Absorption coefficient measurements were used together with the EC data to estimate the MAC for this Arctic site. MAC was calculated equal to 4.12 m2/g. Accordingly, the eBC variation shows the highest monthly averaged concentrations observed in January (245 ± 169 ng/m3) and the lowest ones in April and October (94.6 ± 87.4 ng/m3), in agreement with the winter seasonal trends of eBC concentrations in other Arctic stations. PSCF analysis for continuous eBC measurements showed that air masses coming from the gas flaring regions of Russia are associated with the highest eBC concentrations. Other important source locations are the inhabited/industrial regions of Siberia, as well as north China and Kazakhstan.
For SO42−, the seasonal patterns are very distinct, with very low transport during summer as seen by the respective footprint emission probabilities. Further analysis showed influence from anthropogenic sources in winter and from natural sources in summer. K+ and Mg2+ concentrations originate from sea-salt in winter and from forest fires in summer.
The dominant ion during winter is SO42− and has an average concentration of 390 ± 290 ng/m3 for the study period. The average Na+/Cl- ratio was estimated as 1.1, which leads to the conclusion that Cl- depletion is very low, and both ions have a distinct origin from the locally formed sea spray.
The ratio of nss-ncrSO42−/totSO42− was found higher than 0.8 during the cold season, indicating the anthropogenic origin of SO42-, while during the warm season nss-ncrSO42− is in most cases equal to zero indicating that SO42− is mainly (but not exclusively) affected by natural sources. The nss-ncrSO42−/totSO42− ratio appears to be highly dependent on the season being very close to unity during the cold season, when the transportation of anthropogenic particles is dominant; this ratio can be used as an indicator of the anthropogenic origin of the aerosol particles.
The present study provides, for the first time, quantitative information about several PM components and their respective geographical location of the prevailing sources in a Russian high region, where measurements lack. The chemical characterization of aerosol samples collected in the Ice Cape Baranova station and the identification of the spatial origin of the species is important and will assist researchers in understanding the factors that affect the aerosol concentrations in he high Arctic.
Acknowledgments
Financial support for the performance of aerosol sampling from RFBR project No. 18-05-60084, the development of the methodology of aethalometrical measurements is supported by RSF project No. 19-77-30004, XRF measurements and analysis were supported by “CALIBRA/EYIE” (MIS 5002799) which is implemented under the Action “Reinforcement of the Research and Innovation Infrastructure”, funded by the Operational Program “Competitiveness, Entrepreneurship and Innovation” (NSRF 2014-2020) and co-financed by Greece. It was also partly supported by activities during the European Union's Horizon 2020 research and innovation program under grant agreement no. 689443 (ERA-PLANET) via project iCUPE (Integrative and Comprehensive Understanding on Polar Environments) and the European Union (European Regional Development Fund). Authors are thankful to Dr. A.P. Makshtas (AARI) for organization and support of measurements performed on the research station “Ice Base Cape Baranova”.
Disclosure statement
No potential conflict of interest was reported by the authors.
References
- AMAP. 2015. AMAP assessment 2015: Black carbon and ozone as Arctic climate forcers, AMAP assessment report. Oslo, Norway.
- Asmi, E., Kondratyev, V., Brus, D., Laurila, T., Lihavainen, H. and co-authors. 2016. Aerosol size distribution seasonal characteristics measured in Tiksi, Russian Arctic. Atmos. Chem. Phys. DOI: 10.5194/acp-16-1271-2016.
- Backman, J., Schmeisser, L., Virkkula, A., Ogren, J. A., Asmi, E. and co-authors. 2017. On Aethalometer measurement uncertainties and an instrument correction factor for the Arctic. Atmos. Meas. Tech. 10, 5039–5062. DOI: 10.5194/amt-10-5039-2017
- Barrett, T. E., Robinson, E. M., Usenko, S. and Sheesley, R. J. 2015. Source contributions to wintertime elemental and organic carbon in the western arctic based on radiocarbon and tracer apportionment. Environ. Sci. Technol. 49, 11631–11639. DOI: 10.1021/acs.est.5b03081
- Barrie, L. A. 1986. Arctic air pollution: An overview of current knowledge. Atmos. Environ. 20, 643–663. DOI: 10.1016/0004-6981(86)90180-0
- Becagli, S., Scarchilli, C., Traversi, R., Dayan, U., Severi, M. and co-authors. 2012. Study of present-day sources and transport processes affecting oxidised sulphur compounds in atmospheric aerosols at Dome C (Antarctica) from year-round sampling campaigns. Atmos. Environ. 52, 98–108. DOI: 10.1016/j.atmosenv.2011.07.053
- Bond, S.,D. G., Yarber, K. F., Nelson, S. M., Woo, J.-H. and Klimont, Z. 2004. A technology-based global inventory of black and organic carbon emissions from combustion. J. Geophys. Res. 109, D14203. DOI: 10.1029/2003JD003697
- Breider, T. J., Mickley, L. J., Jacob, D. J., Ge, C., Wang, J. and co-authors. 2017. Multidecadal trends in aerosol radiative forcing over the Arctic: Contribution of changes in anthropogenic aerosol to Arctic warming since 1980. J. Geophys. Res. Atmos. 122, 3573–3594. DOI: 10.1002/2016JD025321
- Cassiani, M., Stohl, A. and Brioude, J. 2015. Lagrangian stochastic modelling of dispersion in the convective boundary layer with skewed turbulence conditions and a vertical density gradient: formulation and implementation in the FLEXPART model. Boundary-Layer Meteorol. 154, 367–390. DOI: 10.1007/s10546-014-9976-5
- Cavalli, F., Viana, M., Yttri, K. E., Genberg, J. and Putaud, J.-P. 2010. Toward a standardised thermal-optical protocol for measuring atmospheric organic and elemental carbon: The EUSAAR protocol. Atmos. Meas. Tech. 3, 79–89. DOI: 10.5194/amt-3-79-2010
- Cesari, D., Donateo, A., Conte, M., Merico, E., Giangreco, A. and co-authors. 2016. An inter-comparison of PM2.5 at urban and urban background sites: Chemical characterization and source apportionment. Atmos. Res. 174-175, 106–119. DOI: 10.1016/j.atmosres.2016.02.004
- Chang, R. Y. W., Leck, C., Graus, M., Müller, M., Paatero, J. and co-authors. 2011. Aerosol composition and sources in the central Arctic Ocean during ASCOS. Atmos. Chem. Phys. 11, 10619–10636. DOI: 10.5194/acp-11-10619-2011
- Diapouli, E., Manousakas, M., Vratolis, S., Vasilatou, V., Maggos, T. and co-authors. 2017. Evolution of air pollution source contributions over one decade, derived by PM 10 and PM 2.5 source apportionment in two metropolitan urban areas in Greece. Atmos. Environ. 164, 416–430.
- Dou, T., Xiao, C., Shindell, D. T., Liu, J., Eleftheriadis, K. and co-authors. 2012. The distribution of snow black carbon observed in the Arctic and compared to the GISS-PUCCINI model. Atmos. Chem. Phys. 12, 7995–8007. DOI: 10.5194/acp-12-7995-2012
- Drinovec, L., Mocnik, G., Zotter, P., Prévôt, A. S. H., Ruckstuhl, C. and coauthors. 2015. The “dual-spot” Aethalometer: an improved measurement of aerosol black carbon with real-time loading compensation. Atmos. Meas. Tech. 8, 1965–1979. DOI: 10.5194/amt-8-1965-2015
- Eckhardt, S., Hermansen, O., Grythe, H., Fiebig, M., Stebel, K. and co-authors. 2013. The influence of cruise ship emissions on air pollution in Svalbard ; A harbinger of a more polluted Arctic?. Atmos. Chem. Phys. 13, 8401–8409. DOI: 10.5194/acp-13-8401-2013
- Eckhardt, S., Quennehen, B., Olivié, D. J. L., Berntsen, T. K., Cherian, R. and co-authors. 2015. Current model capabilities for simulating black carbon and sulfate concentrations in the Arctic atmosphere: A multi-model evaluation using a comprehensive measurement data set. Atmos. Chem. Phys. 15, 9413–9433. DOI: 10.5194/acp-15-9413-2015
- Eleftheriadis, K., Vratolis, S. and Nyeki, S. 2009. Aerosol black carbon in the European Arctic: Measurements at Zeppelin station, Ny-Ålesund, Svalbard from 1998-2007. Geophys. Res. Lett. 36, n/a–5.
- Forster, C., Stohl, A. and Seibert, P. 2007. Parameterization of convective transport in a Lagrangian particle dispersion model and its evaluation. J. Appl. Meteorol. Climatol. 46, 403–422. DOI: 10.1175/JAM2470.1
- Frossard, A. A., Russell, L. M., Burrows, S. M., Elliott, S. M., Bates, T. S. and co-authors. 2014. Atmospheres mass in marine aerosol particles. J. Geophys. Res. 119, 1–27.
- Fu, P., Kawamura, K. and Barrie, L. A. 2009. Photochemical and other sources of organic compounds in the Canadian high Arctic aerosol pollution during winter-spring. Environ. Sci. Technol. 43, 286–292. DOI: 10.1021/es803046q
- Fu, P. Q., Kawamura, K., Chen, J., Charrière, B. and Sempéré, R. 2013. Organic molecular composition of marine aerosols over the Arctic Ocean in summer: Contributions of primary emission and secondary aerosol formation. Biogeosciences 10, 653–667. DOI: 10.5194/bg-10-653-2013
- Giglio, L., Descloitres, J., Justice, C. O. and Kaufman, Y. J. 2003. An enhanced contextual fire detection algorithm for MODIS. Remote Sens. Environ. 87, 273–282. DOI: 10.1016/S0034-4257(03)00184-6
- Grythe, H., Kristiansen, N. I., Zwaaftink, C. D. G., Eckhardt, S., Ström, J. and co-authors. 2017. A new aerosol wet removal scheme for the Lagrangian particle model FLEXPART v10. Geosci. Model Dev. 10, 1447–1466. DOI: 10.5194/gmd-10-1447-2017
- Hsu, Y. K., Holsen, T. M. and Hopke, P. K. 2003. Comparison of hybrid receptor models to locate PCB sources in Chicago. Atmos. Environ 37, 545–562. DOI: 10.1016/S1352-2310(02)00886-5
- Huang, K., Fu, J. S., Prikhodko, V. Y., Storey, J. M., Romanov, A. and co-authors. 2015. Russian anthropogenic black carbon: Emission reconstruction and Arctic black carbon simulation. J. Geophys. Res. Atmos. 120, 11,306–11333. DOI: 10.1002/2015JD023358
- Hyvärinen, A. P., Kolmonen, P., Kerminen, V. M., Virkkula, A., Leskinen, A. and co-authors. 2011. Aerosol black carbon at five background measurement sites over Finland, a gateway to the Arctic. Atmos. Environ. 45, 4042–4050. DOI: 10.1016/j.atmosenv.2011.04.026
- Jacobi, H.-W., Obleitner, F., Da Costa, S., Ginot, P., Eleftheriadis, K. and co-authors. 2019. Deposition of ionic species and black carbon to the Arctic snowpack: Combining snow pit observations with modeling. Atmos. Chem. Phys. 19,10361–10377. DOI: 10.5194/acp-19-10361-2019
- Khan, M. F., Hirano, K. and Masunaga, S. 2012. Assessment of the sources of suspended particulate matter aerosol using US EPA PMF 3.0. Environ. Monit. Assess. 184, 1063–1083. DOI: 10.1007/s10661-011-2021-y
- Klimont, Z., Kupiainen, K., Heyes, C., Purohit, P., Cofala, J. and co-authors. 2017. Global anthropogenic emissions of particulate matter including black carbon. Atmos. Chem. Phys. 17, 8681–8723. DOI: 10.5194/acp-17-8681-2017
- Klonecki, A. 2003. Seasonal changes in the transport of pollutants into the Arctic troposphere-model study. J. Geophys. Res. 108, 1–21.
- Koch, D., Schulz, M., Kinne, S., Bond, T. C., Balkanski, Y. and co-authors. 2009. Evaluation of black carbon estimations in global aerosol models. Atmos. Chem. Phys. Discuss. 9, 15769–15825. DOI: 10.5194/acpd-9-15769-2009
- Laakso, L., Hussein, T., Aarnio, P., Komppula, M., Hiltunen, V. and co-authors. 2003. Diurnal and annual characteristics of particle mass and number concentrations in urban, rural and Arctic environments in Finland. Atmos. Environ. 37, 2629–2641. DOI: 10.1016/S1352-2310(03)00206-1
- Law, K. S. and Stohl, A. 2007. Arctic air pollution: Origins and impacts. Science (80). 315, 1537–1540.
- Manousakas, M., Diapouli, E., Papaefthymiou, H., Kantarelou, V., Zarkadas, C. and co-authors. 2018. XRF characterization and source apportionment of PM10 samples collected in a coastal city. X Ray Spectrom. 47, 190–200. DOI: 10.1002/xrs.2817
- Nguyen, Q. T., Skov, H., Sørensen, L. L., Jensen, B. J., Grube, A. G. and co-authors. 2013. Source apportionment of particles at Station Nord, North East Greenland during 2008-2010 using COPREM and PMF analysis. Atmos. Chem. Phys. 13, 35–49. DOI: 10.5194/acp-13-35-2013
- Pisso, I., Sollum, E., Grythe, H., Kristiansen, N. I., Cassiani, M. and co-authors. 2019. The Lagrangian particle dispersion model FLEXPART version 10.4. Geosci. Model Dev. 12, 4955–4997. DOI: 10.5194/gmd-12-4955-2019
- Polissar, A. V., Hopke, P. K., Paatero, P., Malm, W. C. and Sisler, J. F. 1998. Atmospheric aerosol over Alaska 2. Elemental composition and sources. J. Geophys. Res. 103, 19045–19057. DOI: 10.1029/98JD01212
- Popovicheva, O., Diapouli, E., Makshtas, A., Shonija, N., Manousakas, M. and co-authors. 2019. East Siberian Arctic background and black carbon polluted aerosols at HMO Tiksi. Sci. Total Environ. 655, 924–938. DOI: 10.1016/j.scitotenv.2018.11.165
- Popovicheva, O. B., Evangeliou, N., Eleftheriadis, K., Kalogridis, A. C., Sitnikov, N. and co-authors. 2017a. Black Carbon Sources Constrained by Observations in the Russian High Arctic. Environ. Sci. Technol. 51, 3871–3879. DOI: 10.1021/acs.est.6b05832
- Popovicheva, O. B., Shonija, N. K., Persiantseva, N., Timofeev, M., Diapouli, E. and co-authors. 2017b. Aerosol pollutants during agricultural biomass burning: A case study in Ba Vi Region in Hanoi, Vietnam. Aerosol Air Qual. Res. 17, 2762–2779. DOI: 10.4209/aaqr.2017.03.0111
- Quinn, P. K., Shaw, G., Andrews, E., Dutton, E. G., Ruoho-Airola, T. and co-authors. 2007. Arctic haze: Current trends and knowledge gaps. Tellus, Ser. B Chem. Phys. Meteorol. 59, 99–114. DOI: 10.1111/j.1600-0889.2006.00236.x
- Sakerin, S. M., Bobrikov, A. A., Bukin, O. A., Golobokova, L. P., Pol&Apos;Kin, V. V. and co-authors. 2015. On measurements of aerosol-gas composition of the atmosphere during two expeditions in 2013 along the Northern Sea Route. Atmos. Chem. Phys. 15, 12413–12443. DOI: 10.5194/acp-15-12413-2015
- Sakerin, S. M., Golobokova, L. P., Kabanov, D. M., Kalashnikova, D. A., Kozlov, V. S. and co-authors. 2019. Measurements of Physicochemical Characteristics of Atmospheric Aerosol at Research Station Ice Base Cape Baranov in 2018. Atmos. Ocean. Opt. 32, 511–520. DOI: 10.1134/S1024856019050130
- Schacht, J., Heinold, B., Quaas, J., Backman, J., Cherian, R. and co-authors. 2019. The importance of the representation of air pollution emissions for the modeled distribution and radiative effects of black carbon in the Arctic. Atmos. Chem. Phys. 19, 11159–11183. DOI: 10.5194/acp-19-11159-2019
- Schmeisser, L., Backman, J., Ogren, J. A., Andrews, E., Asmi, E. and co-authors. 2018. Seasonality of aerosol optical properties in the Arctic. Atmos. Chem. Phys. 18, 11599–11622. DOI: 10.5194/acp-18-11599-2018
- Sharma, S., Ishizawa, M., Chan, D., Lavoué, D., Andrews, E. and co-authors. 2013. 16-year simulation of arctic black carbon: Transport, source contribution, and sensitivity analysis on deposition. J. Geophys. Res. Atmos. 118, 943–964. DOI: 10.1029/2012JD017774
- Sharma, S., Lavoué, D., Chachier, H., Barrie, L. A. and Gong, S. L. 2004. Long-term trends of the black carbon concentrations in the Canadian Arctic. J. Geophys. Res 109, 1–10.
- Shindell, D. and Faluvegi, G. 2009. Climate response to regional radiative forcing during the twentieth century. Nature Geosci. 2, 294–300. DOI: 10.1038/ngeo473
- Stock, M., Ritter, C., Herber, A., von Hoyningen-Huene, W., Baibakov, K. and co-authors. 2012. Springtime Arctic aerosol: Smoke versus haze, a case study for March 2008. Atmos. Environ. 52, 48–55. DOI: 10.1016/j.atmosenv.2011.06.051
- Stohl, A. 2006. Characteristics of atmospheric transport into the Arctic troposphere. J. Geophys. Res. 111, 1–17.
- Stohl, A., Berg, T., Burkhart, J. F., Fjǽraa, A. M., Forster, C. and co-authors. 2007. Arctic smoke - Record high air pollution levels in the European Arctic due to agricultural fires in Eastern Europe in spring 2006. Atmos. Chem. Phys. 7, 511–534. DOI: 10.5194/acp-7-511-2007
- Stohl, A., Forster, C., Frank, A., Seibert, P. and Wotawa, G. 2005. Technical note: The Lagrangian particle dispersion model FLEXPART version 6.2. Atmos. Chem. Phys. Discuss. 5, 4739–4799. DOI: 10.5194/acpd-5-4739-2005
- Stohl, A., Klimont, Z., Eckhardt, S., Kupiainen, K., Shevchenko, V. P. and co-authors. 2013. Black carbon in the Arctic: The underestimated role of gas flaring and residential combustion emissions. Atmos. Chem. Phys. 13, 8833–8855. DOI: 10.5194/acp-13-8833-2013
- Stone, R. S., Sharma, S., Herber, A., Eleftheriadis, K. and Nelson, D. W. 2014. A characterization of Arctic aerosols on the basis of aerosol optical depth and black carbon measurements. Elem. Sci. Anth. 2, 000027. DOI: 10.12952/journal.elementa.000027
- Udisti, R., Bazzano, A., Becagli, S., Bolzacchini, E., Caiazzo, L. and co-authors. 2016. Sulfate source apportionment in the Ny-Ålesund (Svalbard Islands) Arctic aerosol. Rend. Fis. Acc. Lincei. 27, 85–94. DOI: 10.1007/s12210-016-0517-7
- Uttal, T., Starkweather, S., Drummond, J. R., Vihma, T., Makshtas, A. P. and co-authors. 2016. International arctic systems for observing the atmosphere: An International Polar Year Legacy Consortium. Bull. Am. Meteorol. Soc. 97, 1033–1056. DOI: 10.1175/BAMS-D-14-00145.1
- Wang, Q., Jacob, D. J., Fisher, J. A., Mao, J., Leibensperger, E. M. and co-authors. 2011. Sources of carbonaceous aerosols and deposited black carbon in the Arctic in winter-spring: Implications for radiative forcing. Atmos. Chem. Phys. 11, 12453–12473. DOI: 10.5194/acp-11-12453-2011
- Warneke, C., Froyd, K. D., Brioude, J., Bahreini, R., Brock, C. A. and co-authors. 2010. An important contribution to springtime Arctic aerosol from biomass burning in Russia. Geophys. Res. Lett. 37, n/a–n/a.,
- Winiger, P., Andersson, A., Eckhardt, S., Stohl, A., Semiletov, I. P. and co-authors. 2017. Siberian Arctic black carbon sources constrained by model and observation. Proc. Natl. Acad. Sci. USA. 114, E1054–E1061. DOI: 10.1073/pnas.1613401114
- Yun, Y., Penner, J. E. and Popovicheva, O. 2013. The effects of hygroscopicity on ice nucleation of fossil fuel combustion aerosols in mixed-phase clouds. Atmos. Chem. Phys. 13, 4339–4348. DOI: 10.5194/acp-13-4339-2013
- Zanatta, M., Laj, P., Gysel, M., Baltensperger, U., Vratolis, S. and co-authors. 2018. Effects of mixing state on optical and radiative properties of black carbon in the European Arctic. Atmos. Chem. Phys. 18, 14037–14057. DOI: 10.5194/acp-18-14037-2018