
Abstract
With the rapid development of industry and economy, the problem of ozone (O3) pollution in China is of increasing concern in recent years. The problem of ozone pollution has become worse in Baicheng City which belongs to the province of Jilin. We analyze the spatial and temporal distribution of surface ozone and its correlation with precursors and meteorological factors during 2015 and 2019 using data from the automatic Atmospheric Environmental Quality Monitoring Station located in Baicheng. Results showed that the daily and monthly mean values of O3 concentration were both single-peak patterns, and interannual variation presented a inverted ‘V’ pattern in Baicheng. The high concentration of O3 in a year generally occurs from May to July, with the highest daily concentration occurring in the afternoon. The total number of days with O3 concentration exceeding the limits was 35 days from 2015 to 2019, among which the number of days exceeding the maximal daily average eight-hour (MDA8) O3 of 100 μg/m3 was the highest in 2018, and the 90th percentile MDA8 showed an overall growth pattern. Seasonal variations in O3 concentration in 2018 and 2019 were not consistent with the three previous years.
1. Introduction
In recent years, China’s air pollution has received increasing amounts of attention (Li et al., Citation2019). Among numerous photochemical pollutants, O3 concentration has become one of the most important pollutants besides PM2.5 (Moghani et al., Citation2018). Although most O3 concentration is located in the stratosphere, which has a protective effect on the environment and human health (Anton et al., Citation2011), near-surface O3 concentration in the troposphere can damage the human respiratory system and destroy the leaf tissue of plants (Wang et al., Citation2017). At the same time, it is also one of the initiators of the greenhouse effect and photochemical smog (Young et al., 2018; Wang et al., Citation2019). Tropospheric ozone (O3) is produced via a series of cyclic reactions between nitrogen oxides (NOx) and volatile organic compounds (VOCs) under solar radiation (Wang et al., Citation2009; Li et al., Citation2016), and its concentration is affected by many factors, such as precursors, meteorological conditions, and chemical cycles (Huang et al., Citation2018).
Foreign scholars have done a lot of research on the process, transmission routes, and concentration prediction of O3 concentration pollution (Simon et al., Citation2015; Fang et al., Citation2019). The O3 concentration research of China is mainly concentrated in economically developed cities such as the Yangtze river delta and Beijing–Tianjin–Hebei (Huang et al., Citation2019). There is very little research on O3 concentration pollution in Northeast China. This paper focuses on analysis of the variation of O3 concentration in the city of Baicheng.
2. Research methods
2.1. Research area
The research area of this article is Baicheng, which is shown in the upper-left corner of , northeast of Jilin province. The total area of Baicheng is about 26,000 square kilometers. The terrain from the northwest to the southeast is low mountains, hills, and plains, and the southwest is a submerged desert area. The two sampling points used in this article are relatively close, and there are major roads and enterprises with serious pollution in Baicheng near the sampling points.
Fig. 1. Changes in ozone concentration in Jilin province between 2015 and 2019.
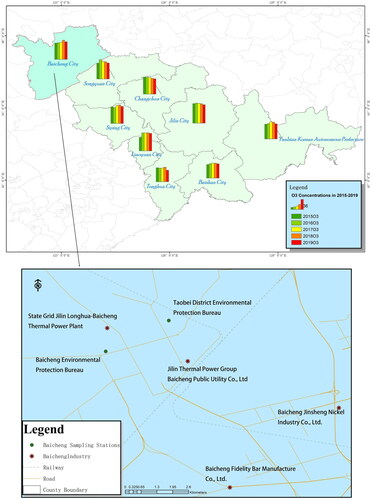
The sampling points in this article are Taobei District Environmental Protection Bureau and Baicheng Environmental Protection Bureau. There are several major point sources within 8 kilometers of the monitoring site, nickel industry and bar companies. Three thermal power plants are distributed within 3 kilometers and 13 kilometers.
Baicheng is located in the northwest of Jilin province, west of the Nenjiang plain, and east of the Horqin grassland. It has a temperate continental monsoon climate, with sufficient light time and less rainfall. In recent years, the problems of soil salinization, desertification, and grassland degradation have become serious in Baicheng. O3 concentration there has gradually increased over the past five years. However, the increase in 2018 was the most significant, and the variation pattern have been abnormal since 2018 ( and ). Therefore, on the basis of analysis of the five-year O3 concentration-variation characteristics of Baicheng, we focused on analyzing the characteristics of O3 concentration changes in 2018 and their causes by combining them with meteorological factors.
In the past two years, Baicheng has focused on the development of special products such as petroleum machinery, electrical machinery, automobile production, logistics machinery, vigorously promoted oilfield development, and construction projects, resulting in increased emissions of local hydrocarbons. In addition, the number of local motor vehicles in 2018 was 296,000, an increase of 6.7% over 2017.
2.2. Pollutants and season division
The research period in this paper is from 2015 to 2019, and the used data come from real-time monitoring released by the official website of the Baicheng Ecological Environment Bureau. The involved area is the entire city of Baicheng. Except when otherwise stated, all O3 concentrations in this paper are given as ozone maximal eight-hour daily average (MDA8, O3-8 h), and the annual evaluation index is the ozone 90th percentile MDA8 (O3-8 h-90). The concentration standard in O3 concentration of environmental-quality assessment is deemed to exceed the standard when the O3-8 h concentration value exceeds 160 μg/m3 according to the Environmental Air Quality Index (AQI) Technical Regulations (Trial) (HJ, Citation2012) issued by the Ministry of Environmental Protection. The validity of the data statistics was implemented in accordance with the Ambient Air Quality Standards (GB3095-2012) and the Technical Specifications for Environmental Air Quality Assessment (Trial) (HJ663-2013) (HJ, Citation2013). In this paper, all monitoring data were selected according to the Ambient Air Quality Monitoring Specifications (HJ, Citation2005) for abnormal values; unreasonable values were removed and data-quality control was performed. Values less or greater than three times the standard deviation of the geometric mean were classified as unrealistic or data-entry errors. The data used in this paper include O3 concentration hourly value (O3-1 h), O3-8 h, sulfur dioxide (SO2), nitric oxide (NO), nitrogen dioxide (NO2), carbon monoxide (CO), and particulate matter. Meteorological data used are data such as temperature, relative humidity, and wind speed in 2018. The seasonal division of Baicheng refers to the meteorological industry standard Climate Season Division (QX/T152-2012) (X/T, Citation2012). On the basis of this standard, adjustment was made according to the annual situation. The spring of Baicheng is 15 April– 14 June (61 days), summer is from 15 June to 24 August (71 days), autumn is from 25 August to 24 October (61 days), and winter is from 25 October to 14 April (172 days).
3. Results and discussion
3.1. Overall pollution status
shows that, different from the adjacent cities, annual mean O3 concentration in Baicheng has increased in the past five years, especially in 2018. Baicheng’s O3 concentration ranked second in Jilin province in 2018, second only to the city of Jilin, which is more developed in industry.
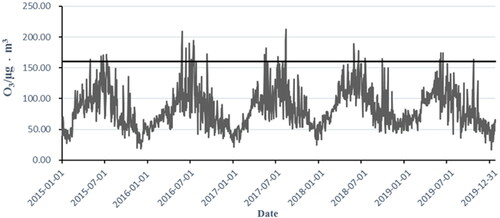
As shown in , the daily concentration of O3 during 2015 and 2019 was a minimum of 17 μg/m3 and maximum of 213 μg/m3, with an average of 83 μg/m3. Among the mean concentrations of pollutants in the table, O3 had the highest mean. In addition, the concentration deviation of the pollutants was large, of which PM10 had the largest deviation, the range between minimum and maximum concentrations is 4–873 μg/m3.
Table 1. Comprehensive indicators of various pollutants in 2015–2019.
3.2. Analysis of ozone variability
3.2.1. Diurnal variation
shows that daily mean O3 concentration has a single-peak characteristic, that is, O3 concentration increase from around 7 am reaching a maximum between 13 and 16 pm and starts to decrease from 16 pm reaching a minimum between 5 and 7 am in the next morning. The accumulation of O3 concentration generally involves three processes: the photochemical cycle reaction of the precursor, the participation of O3 in the cycle reaction, and O3 depletion (Liu et al., Citation2017). After sunrise, as the light intensity gradually increases, the O3 gradually accumulates and peaks in the afternoon. After sunset, the intensity of solar radiation decreases, resulting in weak photochemical intensity and ultimately a reduction in O3 concentration. (Faridi et al., Citation2018; Yusoff et al., Citation2019). After nightfall, O3 concentration continues to decrease due to the NO titration effect (Xu et al., Citation2019) and reaches a minimum before sunrise (7:00) the next day. In areas with limited VOCs, an increase in NOx concentration causes a decrease in O3 concentration (Gao et al., Citation2016). O3 pollution is related to human activities and industrial production (Wang et al., Citation2020).
Fig. 2. Diurnal (a) and monthly (b) mean O3 concentration in five years.
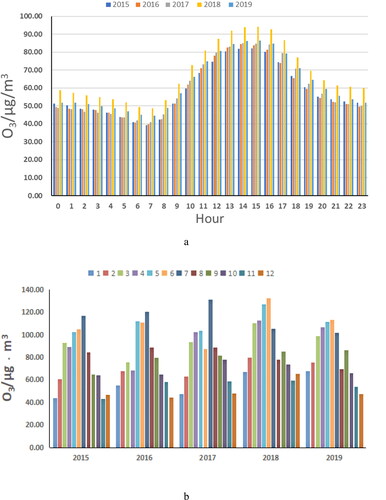
3.2.2. Monthly and seasonal variation
The overall variation trend of the five years () shows a inverted ‘V’ pattern, which is similar to the distribution of the previous studies (Li et al., Citation2018). From the 24 hours contour map of Baicheng (), we can see that there are obvious elliptical red areas in the map. successively shows the seasonal variation pattern of O3 concentration between 2015 and 2019. In these five years, the model calculated daily variation of O3 was similar, with high concentrations in the 13:00–16:00 period. This is consistent with the observations shown in .
Fig. 3. 24-hour average monthly concentration change chart for 2015–2019. Y axis represents month, X axis represents time.
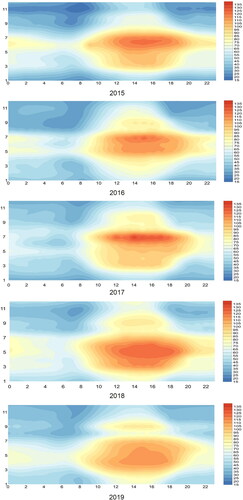
Fig. 4. Seasonal variation of O3 concentration for 2015–2019.
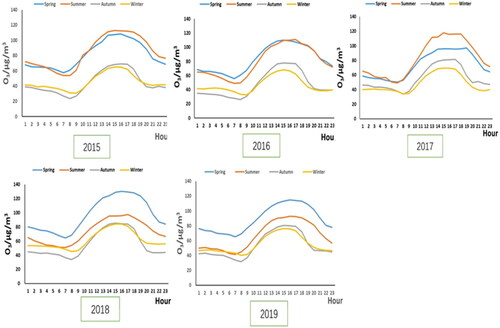
In 2015–2017, the high O3 concentration appeared from May to July, the peak shows a law of summer > spring > autumn > winter. In 2016, O3 concentration in summer was higher than that in spring during the period from 15:00 to 20:00. It showed the same pattern at 11:00–20:00 in autumn and winter, which may have been caused by temperature. In 2017, O3 concentration was higher in spring than in summer from 6:00 to 8:00, it was higher in winter than in autumn at 7:00–8:00, and it presented as summer > spring > autumn > winter the rest of the time, which could also have been caused by temperature. In addition to 12:00–18:00 in 2018 and 2019, characteristics of total O3 concentration variation in each period were shown as spring > summer > winter > autumn. In 2018 and 2019, high O3 concentration appeared from April to June (spring in Baicheng).
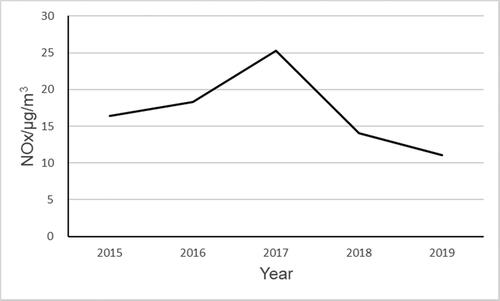
Usually, O3 pollution is a problem in summer. O3 production is usually restricted by the supply of non-methane volatile organic compounds (NMVOCs) and NOx (Society, Citation2008). The generation of ozone is greatly affected by temperature. High temperature is often accompanied by strong solar radiation, which is conducive to photochemical reactions to produce large amounts of O3 (Choi and Souri, Citation2015). From the variation trend of the seasonal average temperature in the past ten years (), it can be seen that the temperature in spring, autumn and winter increased significantly, and the temperature in summer decreased in 2018 and 2019. The temperature in spring of 2018 and 2019 has been relatively high in the past decade. From , we can know that the NOx concentration decreased significantly in the spring of 2018 and 2019. Other studies found that when tropospheric folding occurs, intrusion of stratospheric O3 increases tropospheric O3 concentration (Ahammed et al., Citation2006; Ordonez et al., Citation2007; Nopmongcol et al., Citation2017). These factors may contribute to higher O3 concentrations in spring than in summer.
Fig. 5. Seasonal variation of average temperature for 2010–2019.
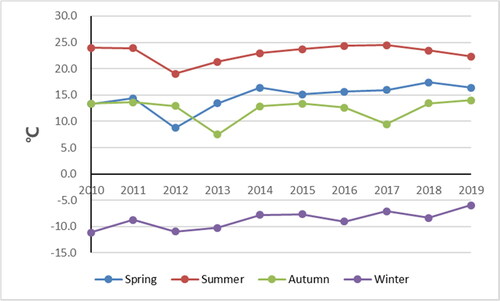
Fig. 6. Spring variation of NOx for 2015–2019.
In addition to 12:00–18:00 in five years, O3 concentration in winter is basically higher than that in autumn. Solar radiation is related to ground-reflection radiation. When ground reflection increases, solar radiation accordingly increases (Li, Citation2017). High solar radiation and temperature are often accompanied by high O3 concentration (Yi et al., Citation2017). When entering winter, the accumulation of snow in Baicheng increases surface reflection and the amount of solar radiation, thus increasing the concentration of O3. Due to the low temperature and the weak photochemical intensity in Baicheng in winter, O3 concentration from 12:00 to 18:00 was low in the winter. Moreover, emissions of NOx increase due to the increasing consumption of coal and oil so increased NOx titration results in reduced O3 concentrations.
3.2.3. Annual variation
From the , we can also clearly find that the O3 concentration increased year by year and reached the maximum in 2018. In addition to the impact of interannual meteorological variability, local pollution sources may have also contributed. The MDA8 of O3 between 2015 and 2019 is shown in . The peak of O3-8 h concentration significantly advanced since 2018; it appeared in August 2017. O3-8 h exceeded 100 μg/m3 for 134 days in 2018, and 113, 96, 87, and 86 days in 2019, 2017, 2016, and 2015, respectively. The value of O3-8 h-90 was 124,119, 123, 134, and 119 μg/m3 in 2015–2019, respectively, and the total number of days exceeding the standard for three years is 35 days, of which the maximal number of days in 2016 was 12.
Fig. 7. 2016–2018 ozone eight-hour moving average.
3.3. Impact-factor analysis
3.3.1. Relationship with meteorological factors
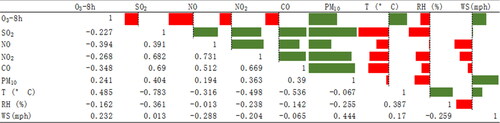
Since seasonal changes in ozone began to differ from in 2018 and 2019. lists the correlations between O3-8 h and NO, NO2, CO, SO2, and PM10 meteorological factors in 2018, where red indicates negative correlation, green indicates positive correlation, and the length of the data bar indicates the magnitude of the correlation. O3 correlation coefficients with temperature, wind speed, and relative humidity were 0.455, 0.232, and −0.162, respectively, of which O3 concentration had the highest positive correlation with temperature.
Fig. 8. Correlation between ozone temperature and other indicators.
The photochemical reaction generating O3 has higher intensity when temperature is high and the solar radiation is strong (Jacob and Winner, Citation2009), which leads to an increase in O3 concentration and a decrease in the concentration of CO, NO2, and other precursors. When temperature is low and solar radiation is weak, the photochemical reaction is weakened, leading to the accumulation of the concentration of CO, NO2, and other precursors (). This shows that temperature is an important factor affecting O3 concentration in Baicheng. O3 concentrations are also affected by wind diffusion and humidity interference. Wind speed has a diffusion and transport effect on O3 (Bloomfield et al., Citation1996). The prevailing wind direction in Baicheng is west, which may bring particulate matter there that leads to the increase of O3 concentration. Higher humidity facilitates the dry deposition of O3, and may however improve the uptake of O3 in plants (Chen et al., Citation2019; Clifton et al., Citation2020).
Fig. 9. Monthly variation values of O3 with NO, NO2, and NOx.
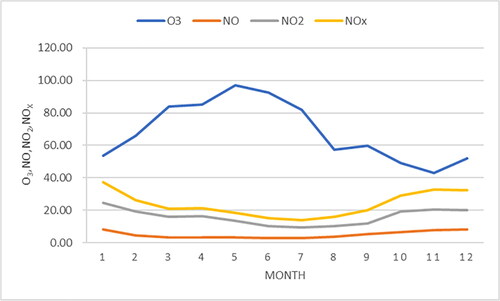
3.3.2. Relationship with other species
Based on the above, we analyzed the correlation between ozone and local pollutants. In the case of significant significance, we obtained a negative correlation between O3 concentrations and concentrations of SO2, NO, NO2, and CO. shows that O3 concentration decreased with the increase of NOx, NO, and NO2 concentration. A negative correlation with NOx is a result of ozone titration. In the NOx cycle, NO and NO2 act together on O3 concentration (Mukherjee et al., Citation2018). For SO2, it had a positive correlation with NO and NO2, so the negative correlation between O3 and SO2 is probably because SO2 is emitted from the same (or nearby) sources as NOx. O3 had no significant correlation with PM2.5 and PM10.
4. Conclusion
The daily and monthly mean values of O3 concentration in Baicheng are both single-peak patterns. The daily high O3 concentration appeared in the time period between 13:00 and 16:00, decreasing between 16:00 and 07:00 the next day, reaching the lowest value between 5:00 and 7:00 in the morning. The minimal value of O3 was 17 μg/m3, the maximal value was 213 μg/m3, and the average value was 83 μg/m3 during the three years. The number of days in which O3-8 h exceeded 100 μg/m3 in 2018 is the highest year of 134 days. The O3-8 h-90 value increased in the order of 124, 119, 123, 134, and 119 μg/m3 between 2015 and 2019, with a total of 35 days exceeding the standard in five years.
The high O3 concentration in Baicheng generally appeared from May to July, while it advanced to March in 2018 and 2019. Seasonal variation in the graph showed that O3 concentration basically follows the rule of summer > spring > autumn > winter at the peak of 2015 and 2017. Beginning in 2018, the valley was spring > summer > winter > autumn. Overall O3 concentration was spring > summer > winter > autumn. The abnormal situation in 2018 was related to the O3 precursor and other meteorological factors. In addition, we found O3 had negative correlation with SO2, NO, NO2, CO, and relative humidity, and positive correlation with, temperature, and wind speed in 2018, among which temperature had the strongest correlation. This result differs from those of previous research, and it may have been affected by various factors. This provides a basis for future research.
Disclosure statement
No potential conflict of interest was reported by the authors.
Notes
1 SPSS is a general term for a series of software products and related services for statistical analysis operations, data mining, predictive analysis and decision support tasks launched by IBM. It is the world's leading statistical analysis and data mining tool, and one of the most widely used professional statistical and data modeling software.
2 Surfer is a software developed by American Golden Software company to draw 3D images. It can produce base maps, data point bit maps, classified data maps, contour maps, wire frames, topographic maps, trend maps, vector diagrams, and 3D surface maps.
References
- Ahammed, Y. N., Reddy, R. R., Gopal, K. R., Narasimhulu, K., Basha, D. B. and co-authors. 2006. Seasonal variation of the surface ozone and its precursor gases during 2001-2003, measured at Anantapur (14.62 degrees N), a semi-arid site in India. Atmos. Res. 80, 151–164. doi:https://doi.org/10.1016/j.atmosres.2005.07.002
- Anton, M., Bortoli, D., Costa, M. J., Kulkarni, P. S., Domingues, A. F. and co-authors. 2011. Temporal and spatial variabilities of total ozone column over Portugal. Remote Sens. Environ. 115, 855–863. doi:https://doi.org/10.1016/j.rse.2010.11.013
- Bloomfield, P., Royle, J. A., Steinberg, L. J. and Yang, Q. 1996. Accounting for meteorological effects in measuring urban ozone levels and trends. Atmos. Environ. 30, 3067–3077. doi:https://doi.org/10.1016/1352-2310(95)00347-9
- Chen, Z., Shao, T. and Zhao, J. 2019. Spatial and temporal variation of ozone concentration and its influencing factors in Inner Mongolia in recent 3 years. Arid Zone Res. 36, 990–996.
- Choi, Y. and Souri, A. H. 2015. Seasonal behavior and long-term trends of tropospheric ozone, its precursors and chemical conditions over Iran: A view from space. Atmos. Environ. 106, 232–240. doi:https://doi.org/10.1016/j.atmosenv.2015.02.012
- Clifton, O. E., Fiore, A. M., Massman, W. J., Baublitz, C. B., Coyle, M. and co-authors. 2020. Dry deposition of ozone over land: Processes. Rev. Geophys. 58, 2019RG000670.
- Fang, C., Wang, L. and Wang, J. 2019. Analysis of the spatial-temporal variation of the surface ozone concentration and its associated meteorological factors in Changchun. Environments 6, 46. doi:https://doi.org/10.3390/environments6040046
- Faridi, S., Shamsipour, M., Krzyzanowski, M., Kunzli, N., Amini, H. and co-authors. 2018. Long-term trends and health impact of PM2.5 and O3 in Tehran, Iran, 2006-2015. Environ. Int. 114, 37–49. doi:https://doi.org/10.1016/j.envint.2018.02.026
- Gao, M., Carmichael, G. R., Saide, P. E., Lu, Z., Yu, M. and co-authors. 2016. Response of winter fine particulate matter concentrations to emission and meteorology changes in North China. Atmos. Chem. Phys. 16, 11837–11851. doi:https://doi.org/10.5194/acp-16-11837-2016
- HJ. 2005. Ambient Air Quality Monitoring Specifications. China Environmental Science Press, Beijing.
- HJ. 2012. Technical Regulation on Ambient Air Quality Index (on Trial). China Environmental Science Press, Beijing.
- HJ. 2013. Technical Regulation for Ambient Air Quality Assessment (on Trial). China Environmental Science Press, Beijing.
- Huang, X., Zhao, J., Cao, J. and Song, Y. 2019. Temporal and spatial variation characteristics and driving factors of ozone concentration in Chinese cities. Environ. Sci. 40, 1120–1131.
- Huang, Z., Hong, L., Yin, P., Wang, X. and Zhang, Y. 2018. Study on the source of ozone pollution and the influence of atmospheric transmission in Baoding City in summer. J. Peking Univ. (Nat. Sci. Ed.) 54, 665–672.
- Jacob, D. J. and Winner, D. A. 2009. Effect of climate change on air quality. Atmos. Environ. 43, 51–63. doi:https://doi.org/10.1016/j.atmosenv.2008.09.051
- Li, L., An, J. Y., Huang, L., Yan, R. S., Huang, C. and co-authors. 2019. Ozone source apportionment over the Yangtze River Delta region, China: Investigation of regional transport, sectoral contributions and seasonal differences. Atmos. Environ. 202, 269–280. doi:https://doi.org/10.1016/j.atmosenv.2019.01.028
- Li, L., An, J. Y., Shi, Y. Y., Zhou, M., Yan, R. S. and co-authors. 2016. Source apportionment of surface ozone in the Yangtze River Delta, China in the summer of 2013. Atmos. Environ. 144, 194–207. doi:https://doi.org/10.1016/j.atmosenv.2016.08.076
- Li, N. 2017. Discussion on calculation method of solar irradiance. In: The 7th National Conference on Building Environment and Energy Application Technology Exchange. Taiyuan, Shanxi, China, p. 3.
- Li, X., Li, S., Liu, P., Kong, Y. and Song, H. 2018. Temporal and spatial variation of ozone concentration in Chinese cities in 2016. J. Environ. Sci. 38, 1263–1274.
- Liu, M., Wang, C., Hou, L., Yu, X. and Lin, H. 2017. Temporal and spatial distribution characteristics and trends of ozone pollution in Shenyang. China Environ. Monit. 33, 126–131.
- Moghani, M., Archer, C. L. and Mirzakhalili, A. 2018. The importance of transport to ozone pollution in the US Mid-Atlantic. Atmos. Environ. 191, 420–431. doi:https://doi.org/10.1016/j.atmosenv.2018.08.005
- Mukherjee, A., Agrawal, S. B. and Agrawal, M. 2018. Intra-urban variability of ozone in a tropical city-characterization of local and regional sources and major influencing factors. Air Qual. Atmos. Health 11, 965–977. doi:https://doi.org/10.1007/s11869-018-0600-6
- Nopmongcol, U., Liu, Z., Stoeckenius, T. and Yarwood, G. 2017. Modeling intercontinental transport of ozone in North America with CAMx for the Air Quality Model Evaluation International Initiative (AQMEII) Phase 3. Atmos. Chem. Phys. 17, 9931–9943. doi:https://doi.org/10.5194/acp-17-9931-2017
- Ordonez, C., Brunner, D., Staehelin, J., Hadjinicolaou, P., Pyle, J. A. and co-authors. 2007. Strong influence of lowermost stratospheric ozone on lower tropospheric background ozone changes over Europe. Geophys. Res. Lett. 34, L07805.
- Simon, H., Reff, A., Wells, B., Xing, J. and Frank, N. 2015. Ozone trends across the United States over a period of decreasing NOx and VOC emissions. Environ. Sci. Technol. 49, 186–195. doi:https://doi.org/10.1021/es504514z
- Society, T. R. 2008. Ground-level ozone in the 21st century: future trends, impacts and policy implications. Royal Society policy document. 15/08, RS1276.
- Wang, M. Y., Yim, S. H. L., Wong, D. C. and Ho, K. F. 2019. Source contributions of surface ozone in China using an adjoint sensitivity analysis. Sci. Total Environ. 662, 385–392. doi:https://doi.org/10.1016/j.scitotenv.2019.01.116
- Wang, T., Xue, L., Brimblecombe, P., Lam, Y. F., Li, L. and co-authors. 2017. Ozone pollution in China: A review of concentrations, meteorological influences, chemical precursors, and effects. Sci. Total Environ. 575, 1582–1596. doi:https://doi.org/10.1016/j.scitotenv.2016.10.081
- Wang, X., Li, J., Zhang, Y., Xie, S. and Tang, X. 2009. Ozone source attribution during a severe photochemical smog episode in Beijing, China. Sci. China Ser. B Chem. 52, 1270–1280. doi:https://doi.org/10.1007/s11426-009-0137-5
- Wang, X., Zhao, W., Li, L. and Yang, X. 2020. Analysis of the temporal and spatial distribution characteristics of ozone in China and its influence on social and economic factors. Earth Environ. 48, 66–75.
- X/T, Q. 2012. Division of Climate Season. China Meteorological Administration, Meteorological Publishing House, Beijing.
- Xu, X., Zhang, T. and Su, Y. 2019. Temporal variations and trend of ground-level ozone based on long-term measurements in Windsor, Canada. Atmos. Chem. Phys. 19, 7335–7345. doi:https://doi.org/10.5194/acp-19-7335-2019
- Yi, K., Liu, J., Ban-Weiss, G., Zhang, J., Tao, W. and co-authors. 2017. Response of the global surface ozone distribution to Northern Hemisphere sea surface temperature changes: Implications for long-range transport. Atmos. Chem. Phys. 17, 8771–8788. doi:https://doi.org/10.5194/acp-17-8771-2017
- Young, P. J., Naik, V., Fiore, A. M., Gaudel, A., Guo, J. and co-authors. 2018. Tropospheric ozone assessment report: Assessment of global-scale model performance for global and regional ozone distributions, variability, and trends. Elementa Sci. Anthrop. 6, 10.
- Yusoff, M. F., Latif, M. T., Juneng, L., Khan, M. F., Ahamad, F. and co-authors. 2019. Spatio-temporal assessment of nocturnal surface ozone in Malaysia. Atmos. Environ. 207, 105–116. doi:https://doi.org/10.1016/j.atmosenv.2019.03.023