
 ?Mathematical formulae have been encoded as MathML and are displayed in this HTML version using MathJax in order to improve their display. Uncheck the box to turn MathJax off. This feature requires Javascript. Click on a formula to zoom.
Abstract
Temperature inversions inhibit the transfer of momentum, heat and moisture in the atmosphere and have led to severe air pollution in China. This study investigated the spatiotemporal variation in temperature inversions in China using sounding data for the past four decades. Surface-based inversion, elevated inversion, and both in one sounding dataset were analysed. Statistical analyses of inversion parameters included frequency, strength and depth. The annual frequency of total inversions showed no significant increasing or decreasing trend with mean values of 0.78, 0.33, 0.24, 0.28, 0.5 and 0.36 at six stations representing different climate zones—Beijing, Harbin, Haikou, Shaowu, Ruoqiang, and Xining, respectively. The annual inversion strength and depth showed downward trends. Monthly variation in inversion frequency and strength differed among stations. The weakest surface-based inversion was found in summer at Beijing and Harbin with mean values of 1 and 1.3 °C, respectively; the strongest surface-based inversion was found in winter with respective mean values of 3.5 and 3.6 °C. Higher surface temperature in summer and subsidence aloft in winter may explain the monthly variation in inversion depth with a minimum in summer, with mean values of 165, 334, 135, 267, 363 and 420 m, and a maximum in winter, with mean values of 250, 646, 140, 591, 806 and 664 m, at the six respective stations. Total inversion was least frequent in southwestern China (mean 0.15), surface-based inversion was most frequent in the north (mean 0.78), and elevated inversion was most frequent in the southeast (mean 0.42). The strongest, deepest surface-based inversion dominated in the north (mean 3.4 °C and 398 m). Elevated inversion strength did not significantly differ among regions (mean 2.5 °C). The deepest elevated inversion dominated in the southeast (mean 654 m). Future efforts should focus on the interactions between aerosols and temperature inversions and accurate model simulations of temperature inversions.
1. Introduction
Temperature inversion, which is defined meteorologically as a layer of air where the temperature increases with altitude (Bilello, Citation1968), plays an essential role in determining atmospheric stability and has a considerable influence on meteorological and environmental issues (Anfossi et al., Citation1976). The temperature inversion layer generally acts as a ‘lid’ that constrains vertical airflow through the layer (Hudson and Brandt, Citation2005; Gramsch et al., Citation2014) and strongly depresses the transfer of momentum, heat, and moisture in the air (Serreze et al., Citation1992; Kahl et al., Citation1996), resulting in high humidity and weak winds. The presence of temperature inversions is not favourable for the development of deep local circulations, because the vertical extension of local circulations is hindered by strong stratification (Ganbat and Baik, Citation2016). Pollutants that are emitted into an inversion layer are difficult to dilute by vertical mixing (Abdul-Wahab, Citation2003; Abdul-Wahab et al., Citation2004). The stagnant conditions resulting from temperature inversion also favour chemical reactions in liquid and heterogeneous phases that benefit the formation of new secondary aerosols (Silva et al., Citation2007). Serious atmospheric pollution events have been attributed to continuous long-lived temperature inversion layers (Gao et al., Citation2015, 2016; Yang et al., Citation2015; Zhang et al., Citation2015; Zhong et al., Citation2018).
It is important to study the behaviour of temperature inversions and the variation in their general characteristics because of their strong link with physical processes and air pollution (Abdul-Wahab et al., Citation2004). Moreover, temperature inversion is a prominent climate feature and long-term changes in temperature inversions may even reflect climate change (Kahl et al., Citation1996). Temperature inversions may be distinct in different regions because of the influence of different terrains, surface land, and atmospheric circulation. The inversion layers are generated at different heights above the ground, with different strengths and depths, which are caused by different mechanisms, including surface cooling resulting from a negative radiation budget, warm air advection over a colder surface layer, subsidence and topography (Kassomenos and Koletsis, Citation2005; Liu et al., Citation2006; Vihma et al., Citation2011). Therefore, it is important to investigate long-term trends and spatial variation in temperature inversions. There has been much research on temperature inversions over the last several decades (Rouch, Citation1920; Douglas, Citation1932; Mai et al., Citation1932; Kahl, Citation1990; Kahl et al., Citation1996; Abdul-Wahab et al., Citation2004; Bourne et al., Citation2010; Wolf et al., Citation2014; Liu et al., Citation2016). Using nearly 30,000 Arctic Ocean temperature profiles for 1950–1990, Kahl et al. (Citation1996) investigated long-term changes in the low-level tropospheric inversion layer and found that the temperature difference across the inversion layer increased significantly during winter and autumn. Focusing on monthly changes in inversion frequency, depth and strength, Abdul-Wahab et al. (Citation2004) reported a reduction in surface-based inversion depths, accompanied by increases in both the strength of surface-based inversions and surface temperatures in Oman. Wolf et al. (Citation2014) studied a 2-year record of ground-based and elevated inversions in the Bergen Valley, Norway, and found that ground-based inversions were common during winter nocturnal hours, whereas elevated inversions were recorded mostly in spring and summer. Bourne et al. (Citation2010) analysed surface-based temperature inversions in Alaska and found that the relationship between Alaskan inversions and the Pacific Decadal Oscillation changes over time and was stronger before 1989 than in recent years.
In recent decades, China, a vast country in East Asia, has been experiencing temperature changes related to variation in the global atmospheric circulation and synoptic pattern (Yan et al., Citation2002; You et al., Citation2011). Moreover, local circulation, topography, and land cover can also result in regional variation in temperature (Gao et al., Citation2007; Soon et al., Citation2011; Li et al., Citation2015b). Thus, temperature inversions in different regions may be distinct due to differences in topography, land cover, and climate in China. The differences in temperature inversions from the north to south and west to east could be significant. In recent years, severe air pollution events related to large-scale emission of air pollutants and disadvantageous meteorological conditions have frequently occurred in China and have attracted a great deal of attention (Guinot et al., Citation2007; Jung et al., Citation2009; Zhang et al., Citation2012; Wang et al., Citation2015; Cui et al., Citation2016). Temperature inversions in China have previously been investigated (Chan et al., 2005; Ji et al., Citation2012; Zhao et al., Citation2013; Gao et al., Citation2016), but most of these studies focused on short-term periods of air pollution. Although Li et al. (Citation2012) investigated temperature inversions from 1990 to 2010, radiosonde data at only seven stations were analysed, of which five stations were near 30°N. There have been no comprehensive explorations of the spatial and temporal variation in temperature inversion characteristics over China. In this study, the spatiotemporal variation in temperature inversions in China was identified using sounding data from the 40 years from 1976 to 2015. Possible factors responsible for these long-term changes as well as monthly and spatial variation in temperature inversions for the whole of China are discussed.
2. Data and methodology
2.1. Sounding data and quality control
The sounding data used in this study were obtained from the Department of Atmospheric Science, University of Wyoming. The global data are available twice daily (00:00 and 12:00 UTC) and updated every day. Pressure, height, temperature, dew-point temperature, mixing ratio, humidity, wind speed, wind direction, and potential temperature are all included in the data, and vertical height ranges from dozens of meters to tens of thousands of meters.
The data period extends from 1976 to 2015. Stations for which more than 50% of data were available were selected. Ultimately, data from 82 stations were used in this study (; South China Sea is not included in the maps of China in this study; more detailed information is listed in ). Only approximately 0.08% of recorders were excluded, e.g., those lacking temperature data, geopotential height increase with pressure decrease. Temperature profiles as a function of height were used to investigate the temperature inversions in China. As the atmospheric boundary layer exceeds 2000 m in the Qinghai-Tibet plateau region in China and deep mixed layers may develop up to 4000–6000 m above many deserts (Gamo, Citation1996), temperature data up to 4000 m were used in this study. In this study, six stations were selected to study the temporal patterns of temperature inversions, both yearly and monthly. Station Beijing is located in northern China and represents a warm temperate continental monsoon climate; station Harbin is in northeast China and represents a temperate continental monsoon climate; station Haikou is in south China and represents a tropical oceanic monsoon climate; station Shaowu is in southeast China and represents a subtropical monsoon climate; station Ruoqiang is in northwest China and represents a typical continental arid climate; and station Xining is on the Qinghai-Tibet Plateau and represents a plateau and mountain climate ().
Fig. 1. Spatial distribution of 82 national meteorological stations in China (red solid circle).
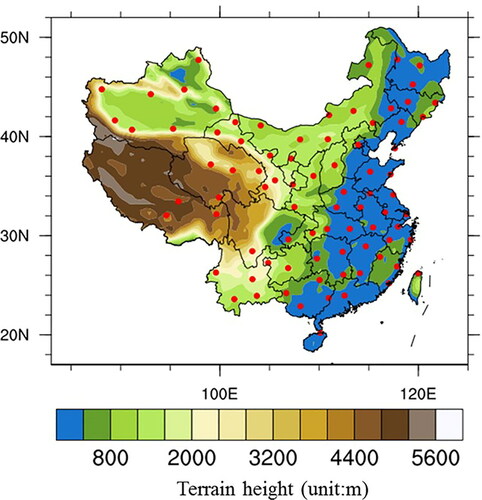
Table 1. Inversion depth in summer and winter at six stations.
2.2. Methodology
In this study, temperature inversions were divided into three different types: surface-based inversion (SI), elevated inversion (EI), and both surface-based and elevated temperature inversions in one sounding dataset (SEI). SI is defined as a temperature profile with ΔT1 > 0 and ΔTi < 0 for i ∈ (2,…, n). The SI layer is primarily driven by a deficit of solar radiation at the Earth’s surface (Kahl, Citation1990); it usually occurs on long nights, as in winter when outgoing radiation from the Earth exceeds incoming solar radiation, and it is favoured by clear skies with calm conditions or weak winds (Abdul-Wahab, Citation2003). Within the surface-based inversion layer, pollutants can accumulate, favouring chemical reactions. EI is defined as a temperature profile with ΔT1 < 0 and ΔTi > 0 for at least one i ∈ (2,…, n). The EI layer generally results from advection of warm air from low latitudes or high-pressure systems (Busch et al., Citation1982). Sinking motions and wind shear can also result in an EI layer (Kassomenos and Koletsis, Citation2005; Cassano et al., Citation2016). This EI layer traps pollutants within it as the height of both smoke stacks and other emission sources emitting the pollutants is generally lower than the top of the EI layer. SEI is defined as a temperature profile with ΔT1 > 0 and ΔTi > 0 for at least one i ∈ (3,…, n). This multilayer temperature inversion may be generated under many scenarios, such as when surface radiation and advection of warm air occur simultaneously, and tends to be more stable than SI and EI. ΔT is defined as Ti + 1–Ti, where i represents the number of layers (Kahl, Citation1990; Wolf et al., Citation2014). Three fundamental parameters described by Kahl et al. (Citation1996) were used to investigate inversion characteristics throughout the analysis period: inversion frequency, inversion depth, and inversion strength. The frequencies of total inversions (FTI), SI (FSI), EI (FEI) and SEI (FSEI) are defined as:
(1)
(1)
(2)
(2)
(3)
(3)
(4)
(4)
where NSI, NEI and NSEI are the numbers of SI, EI and SEI, respectively. NT is the total amount of sounding data and NI is the number of total inversions.
The inversion strength is defined as the difference between minimum and maximum temperatures within the inversion layer (), which is an index of low tropospheric stability. The inversion depth is defined as the height difference between the bottom and top of the inversion layer (), and it describes the vertical extent of an inversion. A thicker inversion has a greater impact on convection, requires more energy to dissipate, and therefore lasts longer (Kassomenos et al., Citation2014). Both stronger and deeper inversions are more effective at trapping moisture, permitting greater cloud cover, and benefiting secondary reactions between air pollutants, thus leading to more severe air pollution (Wood and Bretherton, Citation2006). When successive inversion layers were detected, inversion strength and depth were analysed by combining successive layers together to consider the total inversion depth and strength and create a stronger and deeper inversion (Kassomenos and Koletsis, Citation2005). When discontinuous EI layers were present in any single sounding dataset, only the first EI layer parameters were calculated. Analyses of temperature inversion frequency, strength, and depth were carried out temporally and spatially. More detailed descriptions of inversion strength and depth can be found in our earlier study (Xu et al., Citation2019).
3. Results and discussion
3.1. Temporal variation
3.1.1. Interannual variability
The annual frequencies of total inversions, surface-based inversions, elevated inversions, and both surface-based and elevated temperature inversions (FTI, FSI, FEI and FSEI) from 1976 to 2015 showed no significant increasing or decreasing trends were found for annual FTI over the past four decades (). On average, annual FTI values were 0.78, 0.33, 0.24, 0.28, 0.5 and 0.36 at Beijing, Harbin, Haikou, Shaowu, Ruoqiang and Xining, respectively. The range of FTI was 0.64–0.88, 0.15–0.48, 0.14–0.56, 0.16–0.4, 0.37–0.61 and 0.22–0.58 at the six respective stations. TI was more frequent in north China than in south China. Annual FSI and FSEI were both 0.25 and showed slight downward trends, the ranges of FSI and FSEI were 0.13–0.47 and 0.1–0.37, respectively. The annual FEI was 0.5 and showed an increasing trend; the range of FEI was 0.3–0.63 at Beijing. Annual FSI, FEI and FSEI were 0.77, 0.21 and 0.02 and showed no significant increasing or decreasing trend at Harbin. The ranges of FSI, FEI and FSEI were 0.6–0.96, 0.1–0.36 and 0–0.04, respectively. Annual FSI and FSEI were 0.71 and 0.02, with ranges of 0.25–0.97 and 0–0.1, respectively, and showed slight downward trends, while the annual FEI was 0.27, with a range of 0.1–0.6, and showed an increasing trend at Haikou. The annual FSI was 0.63, with a range of 0.3–0.8, and showed a slight increasing trend (annual increase 0.0076), whereas annual FEI and FSEI were 0.36 and 0.01, with ranges of 0.18–0.6 and 0–0.13, respectively, and showed a decreasing trend at Shaowu. Annual FSI, FEI and FSEI were 0.89, 0.09 and 0.02 with no significant increasing or decreasing trends, with respective ranges of 0.73–0.95, 0.03–0.12 and 0–0.07 at Ruoqiang. Annual FSI was 0.82, with a range of 0.39–1, and showed a slight increasing trend (annual increase 0.01), whereas annual FEI and FSEI were 0.11 and 0.07, with ranges of 0–0.43 and 0–0.25, respectively, and showed decreasing trends at Xining (most of these trends in frequency variation were significant at the ≥ 95% confidence level in t-tests; the null hypothesis for the t-tests assumed that the inversion characteristics did not vary from 1976 to 2015).
Fig. 2. Annual relative frequencies of total inversion (FTI), surface-based temperature inversion (FSI), elevated temperature inversion (FEI) and both surface-based and elevated temperature inversion (FSEI) from 1976 to 2015.
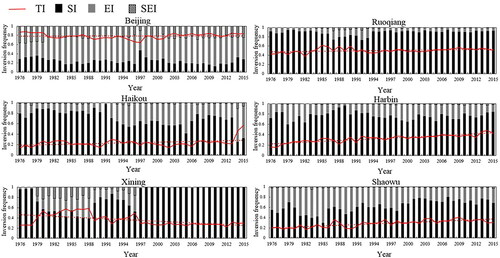
At Beijing station, FSI and FSEI showed slight downward trends, which may have resulted from increases in surface temperature related to land cover changes and urbanization over the past four decades (Zhou et al., Citation2004; Ren et al., Citation2008). Because each SEI included two inversion layers—surface-based SEIs and elevated SEIe, once the SEI was broken, the SEI was converted into an EI and thus annual FEI showed the opposite trend. At Harbin and Ruoqiang, there were no significant increasing or decreasing trends in the temperature inversion, possibly attributable to the comprehensive effects of land cover change, urbanization, and continental climate. At Haikou, there was an increasing trend of FEI and little SEI, and thus the opposite trend of FSI could be partly due to changes in ocean circulation (Hua et al., Citation2015). At Shaowu and Xining, the increasing trend of FSI and downward trends of FEI and FSEI may have resulted from changes in urbanization and land cover (Zhou et al., Citation2004; Gong et al., Citation2012; Zhang et al., Citation2019). Moreover, interannual trends of FSI, FEI and FSEI were different at different stations, which may have been due to local circulation and regional climate.
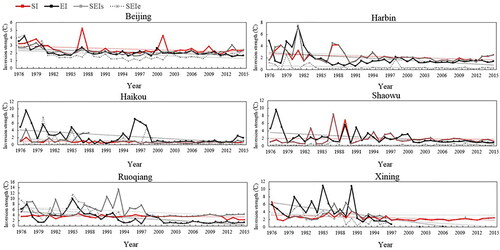
The annual inversion strengths of SI, EI, and SEI from 1976 to 2015 at the six stations showed that the inversion strengths of SI, EI and SEI at all stations decreased over time (most were significant at the ≥95% confidence level in t-tests) (). The strengths of SI, EI, SEIs and SEIe were, respectively, close to 2.6, 2.6, 2.4 and 2.3 °C at Beijing (annual decrease 0.02, 0.02, 0.01 and 0.02, respectively); 2.7, 2.9, 3.1 and 0.7 °C at Harbin (annual decrease 0.03, 0.05, 0.04 and 0.01, respectively); 1.1, 4.2, 1.4 and 1.5 °C at Haikou (annual decrease 0.01, 0.09, 0.04, and 0.01, respectively); 2, 3.6, 1.7 and 3.4 °C at Shaowu (annual decrease 0.06, 0.07, 0.01 and 0.06, respectively); 3.7, 5.3, 6.9, and 6.9 °C at Ruoqiang (annual decrease 0.01, 0.12, 0.08 and 0.17, respectively); and 3.1, 6.3, 3.1 and 2.8 °C at Xining (annual decrease 0.03, 0.21, 0 and 0.09, respectively).
Fig. 3. Annual inversion strength from 1976 to 2015 at six stations.
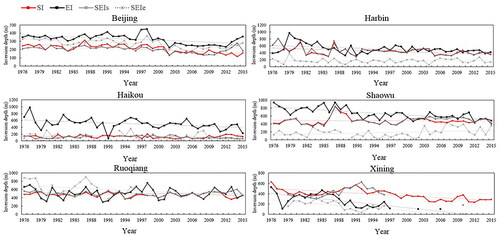
The annual inversion depths of SI, EI and SEI from 1976 to 2015 at the six stations showed overall downward trends in depth (most were significant at the ≥95% confidence level in t-tests) (). The depths of SI, EI, SEIs and SEIe were, respectively, close to 272, 382, 232 and 333 m at Beijing (annual decrease 2.96, 2.74, 2.85 and 1.47, respectively); 537, 611, 524 and 172 m at Harbin (annual decrease 4.87, 4.75, 4.85 and 0.09, respectively); 126, 623, 105 and 144 m at Haikou (annual decrease 1.44, 5.9, 1.45 and 1.47, respectively); 491, 838, 466 and 794 m at Shaowu (annual decrease 0.3, 8.47, 1.82 and 3, respectively); 491, 527, 501 and 705 m at Ruoqiang (annual decrease 0.092, 0.63, 6.29 and 0.47, respectively); and 507, 412, 402 and 199 m at Xining (annual decrease 5.95, 11.39, 0.39 and 8.56, respectively).
Fig. 4. Annual inversion depth from 1976 to 2015 at six stations.
The reductions in inversion strength and depth may have been due to shifts in atmospheric circulation over the last 40 years. Surface temperatures may have increased and inversions may have become shallower and weaker due to systematic increases in warm air advection. Urbanization and land cover changes, which may have led to increases in surface temperature, could result in reductions in inversion strength and depth. Moreover, increasing levels of greenhouse gases would increase atmospheric opacity to outgoing long-wave radiation and increase downward long-wave radiation, which could also result in higher surface temperatures and reductions in the depth and strength of the inversion layer (Bradley and Keimig, Citation1993; Abdul-Wahab et al., Citation2004). Absorbing aerosols, such as black carbon and brown carbon, which are known to have warming effects (Ramanathan and Carmichael, Citation2008; Ding et al., Citation2016), could also lead to a decline of inversion strength and depth by warming the land surface. Although inversion frequency showed different decreasing or increasing trends among the six stations, inversion strength and depth decreased over the past four decades.
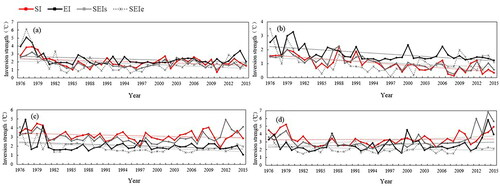
Moreover, this study examined the seasonal variation in the temperature inversions at Beijing. This station was chosen as an example to study the seasonal variation in temperature inversions because the sounding data there has finer vertical resolution and can reflect temperature inversion characteristics better than the data from other stations (Wolf et al., Citation2014; Li et al., Citation2015a). However, there were no significant increasing or decreasing trends in inversion frequency across the four seasons (all significant at the ≥95% confidence level in t-tests) (). Mean FTI was about 0.71, 0.62, 0.85 and 0.9 in spring, summer, autumn and winter, respectively; mean FSI was 0.22, 0.17, 0.33 and 0.24; mean FEI was 0.6, 0.72, 0.31 and 0.38; and mean FSEI was 0.18, 0.11, 0.36 and 0.38. Inversion depth decreased slightly in all four seasons () (significant at the ≥95% confidence level in t-tests). Mean SI depths were 188, 165, 241 and 249 m in spring, summer, autumn and winter, respectively; and mean EI depths were 320, 270, 307 and 364 m. Although annual inversion strength decreased overall, seasonal inversion strength showed different variation at Beijing station (). In spring, inversion strength decreased from 1976 to 1981 and showed no significant increasing or decreasing trend from 1982 to 2015 (non-significant at the ≥95% confidence level in t-tests). The mean strengths of SI, EI, SEIs and SEIe were 2, 2.3, 1.7 and 1.7 °C, respectively. A slight decreasing trend was found in summer (annual decrease 0.03, 0.026, 0.028 and 0.017, respectively) (significant at the ≥95% confidence level in t-tests). Mean strengths of SI, EI, SEIs and SEIe were 1, 1.8, 1 and 1 °C, respectively. No significant increasing or decreasing trends were found in autumn (non-significant at the ≥95% confidence level in t-tests). The mean strengths of SI, EI, SEIs and SEIe were 3.1, 2.1, 2.9 and 1.8 °C, respectively. The mean strengths of SI, EI, SEIs and SEIe were 3.5, 2.6, 3.1 and 2.1 °C in winter. However, inversion strength showed a significant increase from 2012 to 2015 and SI reached 4.9 °C in 2015, EI reached 5.8 °C, and SEIs reached 6.8 °C in 2014, which may have been related to severe air pollution in the winter months in these years in Beijing. Further diagnostic work and general circulation model studies are needed to provide additional insight into the causative mechanisms for the interannual variability of temperature inversions.
Fig. 5. Seasonal inversion strength in every year in Beijing ((a) for spring, (b) for summer, (c) for autumn and (d) for winter).
3.1.2. Monthly variability
For monthly FTI, similar trends were found among the six stations, with a maximum in winter months and minimum in summer months (). The values were 0.9, 0.63, 0.3, 0.5, 0.7 and 0.63 in winter and 0.62, 0.05, 0.08, 0.05, 0.38 and 0.23 in summer at Beijing, Harbin, Haikou, Shaowu, Ruoqiang and Xining, respectively. In winter, cold advection occurs southward in the lower troposphere, whereas warm advection occurs northward in the middle troposphere; temperature inversion appears when cold air is located under warm air, and it is usually accompanied by a cold front system. Conversely, in July, the northerly wind always dominates below 370 hPa, and the same wind direction is relatively unfavourable for the formation of a mid-level inversion (Li et al., Citation2012). However, FSI, FEI and FSEI were inconsistent between stations. At Beijing and Harbin, SI was most frequent in autumn with respective frequencies of 0.33 and 0.79, followed by winter with respective frequencies of 0.24 and 0.74, while it was least frequent in summer with respective mean values of 0.17 and 0.71, and FSI was 0.23 and 0.73, respectively, in spring. Surface heating by solar radiation reduces stability and leads to turbulent mixing in the boundary layer, which results in a reduced FSI in summer. During the summer months in Oman, the passage of fronts and episodes of strong advection with turbulent mixing often disrupt the inversion layer (Abdul-Wahab, Citation2003). Such conditions are also found in China and rare in autumn (Matsui et al., Citation2009; Wang et al., Citation2012; Chen et al., Citation2013), allowing SI to persist undisturbed for longer periods. On the other hand, in winter, the net emission exceeds energy input from the sun. The resulting negative radiative imbalance is mainly responsible for the relatively high FSI in winter compared to summer when this imbalance is either weak or positive (Devasthale et al., Citation2010). In addition, increasing FSI during the autumn and winter months can be explained by the longer nights than in summer that promote surface cooling (Abdul-Wahab et al., Citation2004). As FEI is the complement of FSI and FSEI, and SEI was so infrequent that the opposite FEI trend was seen, a higher FEI was found during the summer months with mean values of 0.72 and 0.28 at Beijing and Harbin, followed by spring months with mean values of 0.6 and 0.21, respectively.
Fig. 6. Monthly FTI, FSI, FEI and FSEI at six stations.
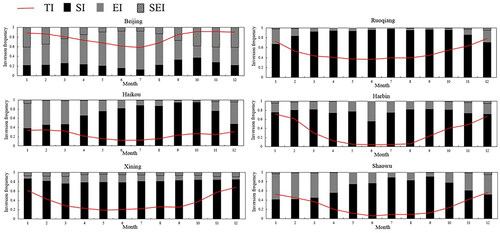
The trends in FSI, FEI and FSEI differed at other stations. At Haikou and Shaowu stations, TI was most frequent in winter with respective mean values of 0.3 and 0.5, followed by 0.25 and 0.26 in autumn; it was least frequent in summer with respective mean values of 0.13 and 0.08. At Haikou, SI was most frequent in autumn with a mean value of 0.89, followed by 0.86 in spring; it was least frequent in winter with a mean value of 0.44. At Shaowu, SI was most frequent in summer with a mean value of 0.83, followed by 0.76 in autumn; it was least frequent in winter with a mean value of 0.45. At Haikou and Shaowu, FEI was highest in winter with mean values of 0.5 and 0.51, respectively, followed by spring months with mean values of 0.25 and 0.4, respectively; FEI was lowest in summer with mean values of 0.13 and 0.17, respectively, which may have been due to seasonal variation in the ocean circulation. EI is closely linked to the development of the so-called marine inversions, which are initiated by the cooling effect of a large body of water on the warmer air masses above (Palarz et al., 2019). Interestingly, the opposite was observed at Ruoqiang in that FSI was higher in summer (0.96) than in winter (0.74). Ruoqiang is located in northwest China dominated by the Gobi Desert. Surface sand has a lower specific heat capacity than urban land, and therefore less energy is needed for the temperature to change; that is, it warms and cools rapidly, which results in large temperature differences between the surface land and air. Surface land warming and cooling are much quicker in summer than in winter, and the temperature difference between the surface land and air in this region is much larger, so radiation inversion is more common, particularly on summer nights. The Xinjiang region is controlled by the cold Siberian High in winter; the air temperature is much lower than in summer, and the temperature inversion layer may be destroyed as the cold air sinks. Therefore, FSI in summer was higher than in winter at Xinjiang. EI showed the opposite monthly variation in that FEI was highest in winter with a mean value of 0.3, followed by spring with a mean value of 0.06; it was lowest in summer with a mean value of 0.03. FSEI was almost zero in spring.
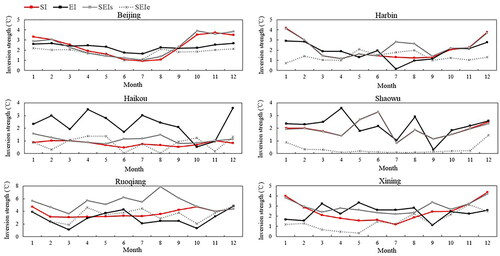
The monthly strengths of SI, EI and SEI in the various months for the whole period of the study showed that the monthly variation in inversion strength differed among stations (). At Beijing, strengths were weakest in summer and strongest in winter; monthly SI strength was about 1 °C in summer and 3.5 °C in winter, EI strength was about 1.8 °C in summer and 2.6 °C in winter, SEIs strength was 1.2 °C in summer and 3.3 °C in winter, and SEIe strength was 1.4 °C in summer and 2.1 °C in winter. The same monthly variation in inversion was found at Harbin; monthly SI strength was 1.3 °C in summer and 3.6 °C in winter, EI strength was 1 °C in summer and 2.8 °C in winter, SEIs strength was 2 °C in summer and 3.6 °C in winter, and SEIe strength was 1.1 °C in summer and 1.7 °C in winter.
Fig. 7. Monthly inversion strength at six stations.
Given the strong coupling of surface temperature and inversion strength by radiative cooling, trends in surface temperature should be correlated with trends in inversion strength (Liu et al., Citation2006). Stations with decreasing trends in inversion strength generally showed increasing trends in surface skin temperature, and thus inversion strength decreased with increases in surface skin temperature from spring to summer. While stations with decreasing trends in inversion strength generally showed increasing surface skin temperature trends, inversion strength increased with the decrease in surface skin temperature from autumn to winter at Beijing and Harbin. In addition, Blanchet and Girard (Citation1995) proposed a hypothesis involving the water vapour dehydration cycle: as an air mass cools, its dehydration is strongly dependent on water uptake by hygroscopic, anthropogenic aerosols. Enhanced removal of water vapour increases surface radiative cooling rates and produces a stronger inversion layer (Kahl et al., Citation1996). In addition, the warm temperate continental monsoon climate at Beijing and temperate continental monsoon climate at Harbin could also impact monthly variation in inversion strength.
There were different patterns in monthly variation at other stations. At Ruoqiang, monthly SI was strongest in autumn (mean 4.3 °C) and weakest in spring (mean 3.1 °C), monthly EI was strongest in winter (mean 3.7 °C) and weakest in autumn (mean 2.3 °C), monthly SEIs was strongest in summer (mean 6.5 °C) and weakest in spring (mean 4.8 °C), and monthly SEIe was strongest in winter (mean 3.7 °C) and weakest in autumn (mean 3.2 °C). These distinct patterns may be related to the sand surface and typical continental arid climate at Ruoqiang, which is markedly different from Beijing and Harbin in that urban land and a temperate continental monsoon climate dominate. It is windy in autumn in the Xinjiang region, so EI was more easily affected by stronger winds at high altitude, such that it was weakest in autumn. At Haikou, monthly SI was strongest in winter (mean 0.9 °C) and weakest in summer (mean 0.6 °C), monthly EI was strongest in winter (mean 2.9 °C) and weakest in autumn (mean 1.2 °C), monthly SEIs was strongest in winter (mean 1.3 °C and weakest in autumn (mean 0.8 °C), and monthly SEIe was strongest in spring (mean 1.2 °C) and weakest in summer (mean 0.3 °C). At Shaowu, monthly SI was strongest in spring (mean 1.9 °C) and weakest in autumn (mean 1.5 °C), monthly EI was strongest in spring (mean 2.6 °C) and weakest in autumn (mean 1.4 °C), monthly SEIs was strongest in winter (mean 2 °C) and weakest in autumn (mean 1.5 °C), and monthly SEIe was strongest in winter (mean 0.8 °C) and weakest in summer (mean 0.1 °C). This monthly variation in inversion strength at Haikou and Shaowu may be related to the ocean circulation, surface temperature, and monsoon climate. In the tropical oceanic monsoon climate region, the strengthened barrier layer during winter leads to a shallower mixed layer; relatively suppressed mixing below the mixed layer warms the subsurface layer, leading to stronger temperature inversion (Seo et al., Citation2009). At Xining, monthly SI was strongest in winter (mean 3.7 °C) and weakest in summer (mean 1.5 °C), monthly EI was strongest in spring (mean 2.9 °C) and weakest in autumn (mean 1.9 °C), monthly SEIs was strongest in winter (mean 3.6 °C) and weakest in summer (mean 2.3 °C), and monthly SEIe was strongest in winter (mean 1.6 °C) and weakest in spring (mean 0.5 °C). This monthly variation in inversion strength could be related to the topography, surface temperature, and plateau and mountain climate at Xining. Large seasonal variation in the temperature lapse rate can be seen in northeast China, where plateaus and a mountain climate dominate, and there was a steep temperature lapse rate in spring and summer with a strong surface temperature vertical gradient inversion in winter (Qin et al., Citation2018).
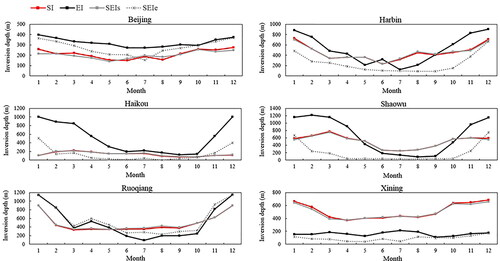
The monthly inversion depths of SI, EI and SEI showed a consistent trend in that the depth was maximum in winter months and shallowest in summer months at the six stations (), consistent with previous studies (Kahl et al., Citation1996; Tjernstrom and Graversen, Citation2009; Kassomenos et al., Citation2014). At Beijing, the SI depth was approximately 165 m in summer and 250 m in winter, the EI depth was approximately 270 m in summer and 360 m in winter, the SEIs depth was 183 m in summer and 232 m in winter, and the SEIe depth was 200 m in summer and 354 m in winter. The EI layers were deeper than the SI layers. lists the inversion depths at the other stations. Cooling of the overlying atmosphere causes the inversion to progressively increase in thickness. Thus, lower surface temperatures are associated with deeper inversion layers (Bradley et al., Citation1992; Bradley and Keimig, 1993). Synoptic conditions, which lead to strong surface cooling (clear sky, anti-cyclonic conditions), are generally correlated with the development of the deepest SI layers and may also produce deeper EI layers, due to subsidence aloft (Busch et al., Citation1982). In addition, the inversion depth increases with decreasing relative humidity (Vihma et al., 2011), and therefore deeper inversion was found in winter as relative humidity was lower compared to that in summer.
Fig. 8. Monthly inversion depth at six stations.
3.2. Spatial variation
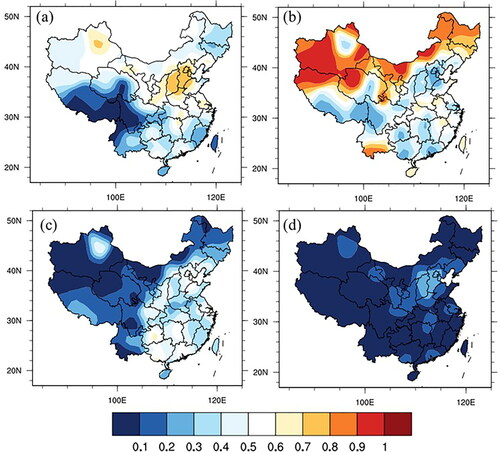
Overall, FTI in summer was lower than in the other seasons (), consistent with the temporal variation in FTI at each station. Similar spatial variation in four seasons was found in that TI was least frequent in southwestern China (including the Qinghai and Tibetan Plateaus, Chongqing, and Sichuan province) (mean 0.15) (), which was possibly related to local circulation, regional climate and topography. TI was most frequent in north China (including the Xinjiang Uygur Autonomous Region, Ningxia Hui Autonomous Region, Gansu province, Inner Mongolia Autonomous Region, Heilongjiang province, Jilin province and Liaoning province) (mean 0.49), where dust storms occur frequently, especially in winter and early spring. TI was less frequent in southeast China (including Fujian province, Guangdong province, Guangxi province, Anhui province, Hunan province, Hubei province, Zhejiang province, Jiangsu province, Jiangxi province and Hainan province) (mean 0.41), which has a sub-tropical climate under the influence of the Asian monsoon, in which air masses mainly come from northern China during winter. FSI showed similar spatial variation in the four seasons () and was highest in north China (mean 0.78) (), possibly due to lower surface temperatures, longer winters, and greater temperature differences between day and night there. SI was less frequent in southwest China (mean 0.51), which has a moist, cloudy environment unfavourable for radiation cooling and where the temperature inversion intensity is relatively weak (Li et al., Citation2012). SI was least frequent in the southeast (mean 0.47). Typically, SI are rarely found over marine areas with subtropical monsoon climate, which is thought to be a consequence of large heat capacity of water providing the possibility of absorbing large amounts of solar energy without significant changes in near-surface air temperature (Palarz et al., Citation2018; Palarz et al., 2019). FEI showed similar spatial variation in the four seasons () and EI was most frequent in the southeast (mean 0.42) (), consistent with the temporal variation in that FEI was higher at Haikou and Shaowu. Southeast China with monsoon climate is closer to the Pacific than other regions, and more EI possibly results from upper-level warming related to atmospheric circulation generated on the ocean, which is agreement with previous study that the inversions over the open water zone were elevated (Tian et al., 2020). EI was less frequent in north China (mean 0.17) and least frequent in the southwest (mean 0.13). SEI was much less frequent than SI and EI; it was slightly more frequent in winter than in the other seasons () and did not differ significantly throughout China (mean 0.06) (). Over different regions, SI development may be attributed to surface radiation and EI development may be attributed to surface radiation and large-scale subsidence and adiabatic heating of air parcels in extensive high-pressure systems (Palarz et al., 2019). Therefore, stronger surface radiation in north China and more frequent subsidence in south China may be responsible for the uniformity of the SEI frequency over China.
Fig. 9. Spatial variation of FTI (a), FSI (b), FEI (c) and FSEI (d).
The inversion strength of SI and SEIs showed similar spatial variation in the four seasons () and the strongest inversion dominated in northern China () with mean values of 3.4 and 3.3 °C, respectively, consistent with the temporal variation in that stronger SI and SEIs were found at Ruoqiang and Harbin, which are located in the north. Generally, the inversion strength of the SI layer is negatively correlated with surface temperature, and surface temperature is lower in northern China than in the south, which may result in deeper inversion.
Fig. 10. Spatial variation of SI strength (a) and SEIs strength (b).
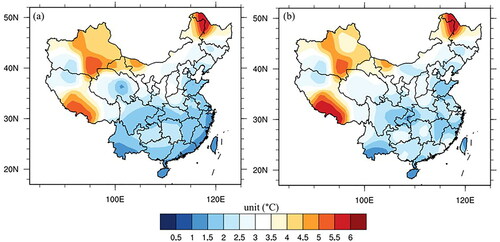
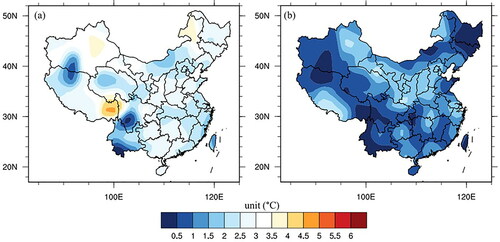
Moreover, Harbin station is close to Russia with temperate continental monsoon climate, as discussed in precious study that higher values of SI depth and strength was associated with the influence of a seasonal high pressure system found over Russia (Palarz et al., Citation2018). SI strength was anti-correlated with surface temperature (Zhang et al., Citation2011), surface temperature in southwest China with monsoon climate is generally higher than in North China with continental monsoon climate. Thus weaker SI and SEIs were found in the southwest with values of 2.6 and 2.3 °C, respectively. The weakest SI and SEIs were found in the southeast with mean values of 1.7 and 2 °C, respectively. The inversion strengths of EI and SEIe also showed similar spatial variation in the four seasons, with no significant differences between different regions with mean values of 2.5 and 1 °C, respectively ( and ). The strength of the EI layer is affected by many factors, such as subsidence aloft, wind shear, circulation, frontal systems, non-uniform oceanic warming, and large-scale synoptic conditions (Wolf et al., Citation2014; Qu et al., Citation2015). Similarly, stronger subsidence aloft and wind shear in north China and deeper ocean circulation in south China may be responsible for the uniformity of the EI layer strength over China.
Fig. 11. Spatial variation of EI strength (a) and SEIe strength (b).
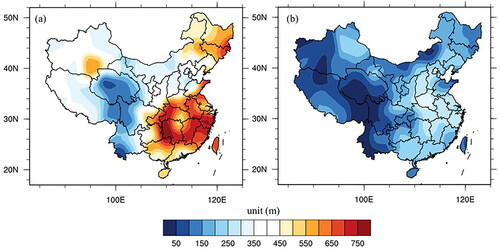
The inversion depths of both SI and SEIs showed the same spatial distribution in the four seasons, with deeper inversion in winter (), which was also consistent with the temporal variation at the six stations mentioned above. With regard to the spatial variation, although deeper SI and SEIs were found at several stations located in southern China, they dominated in the north () with mean values of 398 m and 337 m, respectively, which is likely related to the lower surface temperatures in the north. The inversion depth of the SI layer is negatively correlated with surface temperature, and therefore lower surface temperature results in deeper inversion in northern China. Thinner SI and SEIs were found in the southwest, with mean values of 280 and 305 m, respectively. The thinnest SI and SEIs were found in the southeast, with mean values of 261 and 257 m, respectively. The inversion depths of both EI and SEIe also showed the same spatial distribution in the four seasons, in that deeper EI and SEIe dominated in the southeast (except a deeper EI also occurred in the northwest region in winter), consistent with the temporal variation at the six stations ( and ). The mean values were 654 and 221 m, respectively, consistent with the temporal variation in that a deeper EI was found at Haikou and Shaowu located in the southeast. A stronger influence of ocean circulation may result in deeper upper-level inversion. Southeast China is next to the Pacific, and the EI layer mainly results from warm advection, and the western Pacific subtropical high has a stronger influence in southeast China than other regions of the country. Thinner EI and SEIe were found in north China, with mean values of 427 and 143 m, respectively. The thinnest EI and SEIe were found in the southwest, with mean values of 251 and 108 m, respectively.
Fig. 12. Spatial variation of SI depth (a) and SEIs depth (b).
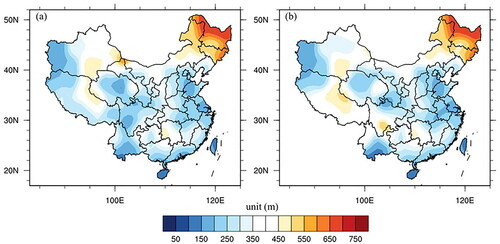
Fig. 13. Spatial variation of EI depth (a) and SEIe depth (b).
3.3. Strong temperature inversions lead to severe air pollution
Stronger inversion results in not only a more stable boundary layer, which leads to aggravation of primary air pollutants, but also a moister and cloudier boundary layer (Qu et al., Citation2015). Moister air benefits the formation of secondary pollutants, such as sulphates and nitrates (Wang et al., Citation2005; Huang et al., Citation2014b), causing air pollution to become increasingly more serious.
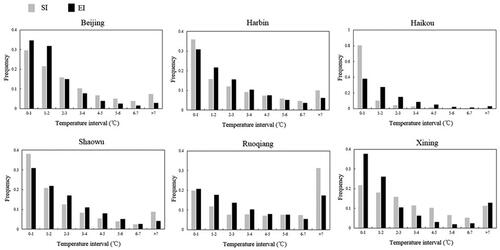
The frequencies of SI and EI strengths at the six stations, in 1 °C intervals, reflected the exclusion of SEI from this analysis as it was much less frequent than SI and EI (except at Beijing station) (). Strong inversion (defined as an inversion strength ≥5 °C in this study) showed a certain proportion at all six stations. The frequencies of strong SI and EI were 0.16 and 0.07, respectively, at Beijing; 0.2 and 0.15 at Harbin; 0.02 and 0.06 at Haikou; 0.15 and 0.12 at Shaowu; 0.46 and 0.3 at Ruoqiang; and 0.23 and 0.17 at Xining. Moreover, 82% of strong SI and 50% of strong EI at Beijing, 72% and 66% at Harbin, 48% and 41% at Haikou, 49% and 74% at Shaowu, 84% and 50% at Ruoqiang, and 88% and 32% at Xining occurred in autumn and winter, respectively. Strong inversions were more frequent in autumn and winter, which coincides with the period of severe air pollution in China.
Fig. 14. Frequency of different inversion strengths at six stations, in 1 °C intervals.
From 10 to 13 January 2013, extremely severe and persistent haze occurred over north China. The record-breaking high concentrations of fine particulate matter (PM2.5) > 700 μg m−3 (hourly average) and the persistence of the episodes have raised widespread concern (Huang et al., Citation2014a; Sun et al., Citation2014). In response to the extremely severe and persistent haze pollution, temperature inversions were investigated at Beijing from 8 to 16 January 2013 (). Although temperature inversions appeared on 8 and 9 January, their strengths were lower than 2 °C and PM2.5 concentrations were 24 and 83 μg m−3, respectively. Stronger SI or EI began from 10 January and persisted; the inversion strengths exceeded 5 °C, which resulted in PM2.5 pollution with increased concentrations of 201 and 222 μg m−3 on 10 and 11 January, respectively. The strongest inversion occurred on 12 January with an inversion strength of 8 °C, accompanied by the most serious pollution with a PM2.5 concentration of 375 μg m−3 (). The temperature inversion remained from 13 to 14 January but was much weaker than on 12 January; the inversion strengths were lower than 4 °C, which resulted in slightly less pollution with lower PM2.5 concentrations of 242 and 131 μg m−3. Temperature inversion continued to become weaker on 15 January, with an inversion strength lower than 3 °C accompanied by decreasing PM2.5 with a concentration of 91 μg m−3. On 16 January, the temperature inversion disappeared and the PM2.5 concentration decreased to 60 μg m−3. This serious and persistent air pollution indicates that temperature inversions, particularly strong inversions, have a profound negative impact on air quality.
4. Conclusions
Temporal and spatial characteristics of atmospheric temperature inversions were analysed with sounding data from 82 stations covering the period from 1976 to 2015 in China. The frequency, strength and depth of surface-based inversion, elevated inversion and both surface-based inversion and elevated inversion in sounding data were investigated.
Annual FTI showed no significant increasing or decreasing trend over the 40 years included in the dataset with mean values of 0.78, 0.33, 0.24, 0.28, 0.5 and 0.36 at Beijing, Harbin, Haikou, Shaowu, Ruoqiang and Xining, respectively. Annual FSI, FEI and FSEI showed different trends at different stations. Annual inversion strength and depth showed overall downward trends, which may have been caused by increases in surface temperature over the past four decades. At the six stations, the respective surface-based inversion strength and depth were close to 2.6 °C and 272 m, 2.7 °C and 537 m, 1.1 °C and 126 m, 2 °C and 491 m, 3.7 °C and 491 m, and 3.1 °C and 507 m; the strength and depth of elevated inversions were close to 2.6 °C and 382 m, 2.9 °C and 611 m, 4.2 °C and 623 m, 3.6 °C and 838 m, 6.9 °C and 527 m, 6.3 °C and 412 m, respectively. Seasonal variation in temperature inversions at Beijing was also investigated. The inversion frequency had no significant increasing or decreasing trend, although inversion depth decreased slightly in all four seasons. Although annual inversion strength decreased overall, seasonal inversion strength showed different variation and inversion strength showed significant increases in winter from 2012 to 2015. Similar trends in the monthly frequency of all inversions were found among the stations, with the maximum in winter and minimum in summer. Monthly FSI, FEI and FSEI were inconsistent at the six stations. The monthly inversion depth showed consistent trends, with the maximum in winter and minimum in summer. The monthly inversion strengths were different at the six stations. Severe air pollution in winter time was attributable to strong and deep inversions. High PM2.5 concentrations related to strong inversions were found in winter at Beijing station.
Spatially, a lower FTI was found in southwestern China (mean 0.15). A higher FSI was found in north China (mean 0.78), which may have been caused by the longer winter than in the south. EI was more frequent in the southeast (mean 0.42) and SEI showed no significant difference throughout the country (mean 0.06). Stronger SI and SEIs dominated in the north (mean 3.4 °C and 3.3 °C, respectively), which may have been due to lower surface temperatures there. The inversion strengths of EI and SEIe showed similar spatial variation in that there were no significant differences between different regions (mean 2.5 °C and 1 °C). Deeper SI and SEIs dominated in north China (mean 398 and 337 m, respectively), which was likely related to lower surface temperatures in the north. Deeper EI and SEIe dominated in the southeast (mean 654 and 221 m, respectively), possibly due to the stronger influence of ocean circulation in that region.
This is the first spatiotemporal analysis of atmospheric temperature inversion characteristics over all of China. Further research should include other datasets (e.g., long-term air pollution, sunshine duration and intensity, larger-scale climate change) to understand the causes of the variation in inversion characteristics, and more detailed model simulation studies are also required. Our results could be used in many other studies, such as studies of air pollution related to temperature inversions, the interactions between aerosols and temperature inversion from a spatiotemporal perspective, and the influence of temperature inversion on spatiotemporal wet-cooling tower performance based on the conclusions regarding the spatiotemporal variation in temperature inversions in this study. Moreover, our study can also serve as a reference for studies of atmospheric stable boundary layer development in India, which also suffers from severe air pollution. We plan to investigate the long-term interactions between aerosols and TI based on the spatiotemporal variation in temperature inversions.
Acknowledgments
The sounding data were obtained from the department of atmospheric science in University of Wyoming. This research was supported by National Key R&D Program of China (2017YFC0209904), the National Natural Science Foundation of China (91644212 & 41675142) and the National Research Program for Key Issues in Air Pollution Control (DQGG0208).
References
- Abdul-Wahab, S. A. 2003. Analysis of thermal inversions in the Khareef Salalah region in the Sultanate of Oman. J. Geophys. Res.-Atmospheres 109, 4274.
- Abdul-Wahab, S. A., Al-Saifi, S. Y., Alrumhi, B. A., Abdulraheem, M. Y. and Al-Uraimi, M. 2004. Determination of the features of the low-level temperature inversions above a suburban site in Oman using radiosonde temperature measurements: Long-term analysis. J. Geophys. Res. 109, D20101. doi:https://doi.org/10.1029/2004JD004543
- Anfossi, D., Bacci, P. and Longhetto, A. 1976. Forecasting of vertical temperature profiles in atmosphere during nocturnal radiation inversions from air temperature trend at screen height. QJ. Royal Met. Soc. 102, 173–180. doi:https://doi.org/10.1002/qj.49710243114
- Bilello, M. A. 1968. Survey of arctic and subarctic temperature inversions. Bull. Am. Meterol. Soc. 49, 426.
- Blanchet, J. P. and Girard, E. 1995. Water-vapor temperature feedback in the formation of continental arctic air - its implication for climate. Sci. Total Environ. 160–161, 793–802. doi:https://doi.org/10.1016/0048-9697(95)04412-T
- Bourne, S. M., Bhatt, U. S., Zhang, J. and Thoman, R. 2010. Surface-based temperature inversions in Alaska from a climate perspective. Atmos. Res. 95, 353–366. doi:https://doi.org/10.1016/j.atmosres.2009.09.013
- Bradley, R. S., Keimig, F. T. and Diaz, H. F. 1992. Climatology of surface-based inversions in the North-American Arctic. J. Geophys. Res. 97, 15699–15712. doi:https://doi.org/10.1029/92JD01451
- Bradley, R. S., Keimig, F. T. and Diaz, H. F. 1993. Recent changes in the North-American arctic boundary-layer in winter. J. Geophys. Res. 98, 8851–8858. doi:https://doi.org/10.1029/93JD00311
- Busch, N., Ebel, U., Kraus, H. and Schaller, E. 1982. The structure of the sub-polar inversion-capped ABL. Arch. Meteorol. Geophys. Bioclimatol. Ser. A-Meteorol. Atmos. Phys. 31, 1–18. doi:https://doi.org/10.1007/BF02257738
- Cassano, J. J., Nigro, M. A. and Lazzara, M. A. 2016. Characteristics of the near-surface atmosphere over the Ross Ice Shelf. J. Geophys. Res. Atmos. 121, 3339–3362. doi:https://doi.org/10.1002/2015JD024383
- Chan, C. Y., Xu, X. D., Li, Y. S., Wong, K. H., Ding, G. A., co-authors. Characteristics of vertical profiles and sources of PM2.5, PM10 and carbonaceous species in Beijing. 2005. Atmos. Environ. 39, 5113–5124., doi:https://doi.org/10.1016/j.atmosenv.2005.05.009
- Chen, S., Huang, J., Zhao, C., Qian, Y., Leung, L. R. and co-authors. 2013. Modeling the transport and radiative forcing of Taklimakan dust over the Tibetan Plateau: a case study in the summer of 2006. J. Geophys. Res. Atmos. 118, 797–812. doi:https://doi.org/10.1002/jgrd.50122
- Cui, Y., Lin, J., Song, C., Liu, M., Yan, Y., co-authors. 2016. Rapid growth in nitrogen dioxide pollution over Western China, 2005-2013. Atmos. Chem. Phys. 16, 6207–6221. doi:https://doi.org/10.5194/acp-16-6207-2016
- Devasthale, A., Willen, U., Karlsson, K. G. and Jones, C. G. 2010. Quantifying the clear-sky temperature inversion frequency and strength over the Arctic Ocean during summer and winter seasons from AIRS profiles. Atmos. Chem. Phys. 10, 5565–5572. doi:https://doi.org/10.5194/acp-10-5565-2010
- Ding, A. J., Huang, X., Nie, W., Sun, J. N., Kerminen, V. M., and co-authors. 2016. Enhanced haze pollution by black carbon in megacities in China. Geophys. Res. Lett. 43, 2873–2879. doi:https://doi.org/10.1002/2016GL067745
- Douglas, C. K. M. 1932. Structure and development of temperature inversions in the atmosphere. Nature 129, 245–246. doi:https://doi.org/10.1038/129245b0
- Gamo, M. 1996. Thickness of the dry convection and large-scale subsidence above deserts. Boundary-Layer Meteorol. 79, 265–278. doi:https://doi.org/10.1007/BF00119441
- Ganbat, G. and Baik, J. J. 2016. Wintertime winds in and around the Ulaanbaatar metropolitan area in the presence of a temperature inversion. Asia-Pacific J. Atmos. Sci. 52, 309–325. doi:https://doi.org/10.1007/s13143-016-0007-y
- Gao, M., Carmichael, G. R., Wang, Y., Saide, P. E., Yu, M., co-authors. 2016. Modeling study of the 2010 regional haze event in the North China Plain. Atmos. Chem. Phys. 16, 1673–1691. doi:https://doi.org/10.5194/acp-16-1673-2016
- Gao, X., Zhang, D., Chen, Z., Pal, J. S. and Giorgi, F. 2007. Land use effects on climate in China as simulated by a regional climate model. Sci. China Ser. D. 50, 620–628. doi:https://doi.org/10.1007/s11430-007-2060-y
- Gao, Y., Zhang, M., Liu, Z., Wang, L., Wang, P., co-authors. 2015. Modeling the feedback between aerosol and meteorological variables in the atmospheric boundary layer during a severe fog-haze event over the North China Plain. Atmos. Chem. Phys. 15, 4279–4295. doi:https://doi.org/10.5194/acp-15-4279-2015
- Gong, P., Liang, S., Carlton, E. J., Jiang, Q., Wu, J. and co-authors. 2012. Urbanisation and health in China. Lancet 379, 843–852. doi:https://doi.org/10.1016/S0140-6736(11)61878-3
- Gramsch, E., Cáceres, D., Oyola, P., Reyes, F., Vásquez, Y., co-authors. 2014. Influence of surface and subsidence thermal inversion on PM2.5 and black carbon concentration. Atmos. Environ. 98, 290–298. doi:https://doi.org/10.1016/j.atmosenv.2014.08.066
- Guinot, B., Cachier, H., Sciare, J., Tong, Y., Xin, W., co-authors. 2007. Beijing aerosol: atmospheric interactions and new trends. J. Geophys. Res. 112, D14314. doi:https://doi.org/10.1029/2006JD008195
- Hua, Q., Webb, G. E., Zhao, J-X., Nothdurft, L. D., Lybolt, M. and co-authors. 2015. Large variations in the Holocene marine radiocarbon reservoir effect reflect ocean circulation and climatic changes. Earth Planet. Sci. Lett. 422, 33–44. doi:https://doi.org/10.1016/j.epsl.2015.03.049
- Huang, R.-J., Zhang, Y., Bozzetti, C., Ho, K.-F., Cao, J.-J., co-authors. 2014a. High secondary aerosol contribution to particulate pollution during haze events in China. Nature 514, 218–222. doi:https://doi.org/10.1038/nature13774
- Huang, X., Song, Y., Zhao, C., Li, M. M. and Zhu, T. and co-authors 2014b. Pathways of sulfate enhancement by natural and anthropogenic mineral aerosols in China. J. Geophys. Res.-Atmos. 119, 14165–14179. doi:https://doi.org/10.1002/2014JD022301
- Hudson, S. R. and Brandt, R. E. 2005. A look at the surface-based temperature inversion on the Antarctic plateau. J. Climate 18, 1673–1696. doi:https://doi.org/10.1175/JCLI3360.1
- Ji, D., Wang, Y., Wang, L., Chen, L., Hu, B. and co-authors. 2012. Analysis of heavy pollution episodes in selected cities of northern China. Atmos. Environ. 50, 338–348. doi:https://doi.org/10.1016/j.atmosenv.2011.11.053
- Jung, J., Lee, H., Kim, Y. J., Liu, X., Zhang, Y. and co-authors. 2009. Optical properties of atmospheric aerosols obtained by in situ and remote measurements during 2006 Campaign of Air Quality Research in Beijing (CAREBeijing-2006). J. Geophys. Res. 114,
- Kahl, J. D. 1990. Characteristics of the low-level temperature inversion along the Alaskan Arctic Coast. Int. J. Climatol. 10, 537–548. doi:https://doi.org/10.1002/joc.3370100509
- Kahl, J. D. W., Martinez, D. A. and Zaitseva, N. A. 1996. Long-term variability in the low-level inversion layer over the Arctic Ocean. Int. J. Climatol. 16, 1297–1313. doi:https://doi.org/10.1002/(SICI)1097-0088(199611)16:11<1297::AID-JOC86>3.0.CO;2-T
- Kassomenos, P. A. and Koletsis, I. G. 2005. Seasonal variation of the temperature inversions over Athens, Greece. Int. J. Climatol. 25, 1651–1663. doi:https://doi.org/10.1002/joc.1188
- Kassomenos, P. A., Paschalidou, A. K., Lykoudis, S. and Koletsis, I. 2014. Temperature inversion characteristics in relation to synoptic circulation above Athens, Greece. Environ. Monit. Assess. 186, 3495–3502. doi:https://doi.org/10.1007/s10661-014-3632-x
- Li, J., Chen, H., Li, Z., Wang, P., Cribb, M. and co-authors. 2015a. Low-level temperature inversions and their effect on aerosol condensation nuclei concentrations under different large-scale synoptic circulations. Adv. Atmos. Sci. 32, 898–908. doi:https://doi.org/10.1007/s00376-014-4150-z
- Li, M. M., Mao, Z. C., Song, Y., Liu, M. X. and Huang, X. 2015b. Impacts of the decadal urbanization on thermally induced circulations in eastern China. J. Appl. Meteorol. Climatol. 54, 259–282. doi:https://doi.org/10.1175/JAMC-D-14-0176.1
- Li, Y. Y., Yan, J. P. and Sui, X. B. 2012. Tropospheric temperature inversion over central China. Atmos. Res. 116, 105–115. doi:https://doi.org/10.1016/j.atmosres.2012.03.009
- Liu, Y., Key, J. R., Schweiger, A. and Francis, J. 2006. Characteristics of satellite-derived clear-sky atmospheric temperature inversion strength in the Arctic, 1980. J. Climate 19, 4902–4913. doi:https://doi.org/10.1175/JCLI3915.1
- Liu, Y., Mamtimin, A., Huo, W., Yang, X., Liu, X. and co-authors. 2016. Nondimensional wind and temperature profiles in the atmospheric surface layer over the Hinterland of the Taklimakan Desert in China. Adv. Meteorol. 2016, 1–8.
- Mai, S., Basu, S. and Desai, B. N. 1932. Structure and development of temperature inversions in the atmosphere. Nature 129, 97–97.
- Matsui, H., Koike, M., Kondo, Y., Takegawa, N., Kita, K., co-authors. 2009. Spatial and temporal variations of aerosols around Beijing in summer 2006: model evaluation and source apportionment. J. Geophys. Res. 114, and
- Palarz, A., Celiński-Mysław, D. and Ustrnul, Z. 2018. Temporal and spatial variability of surface-based inversions over Europe based on ERA-Interim reanalysis. Int. J. Climatol. 38, 158–168. doi:https://doi.org/10.1002/joc.5167
- Palarz, A., Celiński‐Mysław, D. and Ustrnul, Z. 2020. Temporal and spatial variability of elevated inversions over Europe based on ERA-Interim reanalysis. Int. J. Climatol. 40, 1335–1347. doi:https://doi.org/10.1002/joc.6271
- Qin, Y., Ren, G., Zhai, T., Zhang, P. and Wen, K. 2018. A new methodology for estimating the surface temperature lapse rate based on grid data and its application in China. Remote Sens. 10, 1617. doi:https://doi.org/10.3390/rs10101617
- Qu, X., Hall, A., Klein, S. A. and Caldwell, P. M. 2015. The strength of the tropical inversion and its response to climate change in 18 CMIP5 models. Clim. Dyn. 45, 375–396. doi:https://doi.org/10.1007/s00382-014-2441-9
- Ramanathan, V. and Carmichael, G. 2008. Global and regional climate changes due to black carbon. Nat. Geosci. 1, 221–227. doi:https://doi.org/10.1038/ngeo156
- Ren, G., Zhou, Y., Chu, Z., Zhou, J., Zhang, A. and co-authors. 2008. Urbanization effects on observed surface air temperature trends in north China. J. Climate 21, 1333–1348. doi:https://doi.org/10.1175/2007JCLI1348.1
- Rouch, J. 1920. Temperature inversions in low layers of the atmosphere in the Antartic. CR Hebd Acad. Sci. 171, 498–500.
- Seo, H., Xie, S.-P., Murtugudde, R., Jochum, M. and Miller, A. J. 2009. Seasonal effects of indian ocean freshwater forcing in a regional coupled model. J. Climate 22, 6577–6596. doi:https://doi.org/10.1175/2009JCLI2990.1
- Serreze, M. C., Kahl, J. D. and Schnell, R. C. 1992. Low-level temperature inversions of the Eurasian Arctic and comparisons with soviet drifting station data. J. Climate 5, 615–629. doi:https://doi.org/10.1175/1520-0442(1992)005<0615:LLTIOT>2.0.CO;2
- Silva, P. J., Vawdrey, E. L., Corbett, M. and Erupe, M. 2007. Fine particle concentrations and composition during wintertime inversions in Logan, Utah, USA. Atmos. Environ. 41, 5410–5422. doi:https://doi.org/10.1016/j.atmosenv.2007.02.016
- Soon, W., Dutta, K., Legates, D. R., Velasco, V. and Zhang, W. J. 2011. Variation in surface air temperature of China during the 20th century. J. Atmos. Sol. Terr. Phys. 73, 2331–2344. doi:https://doi.org/10.1016/j.jastp.2011.07.007
- Sun, Y., Jiang, Q., Wang, Z., Fu, P., Li, J. and co-authors. 2014. Investigation of the sources and evolution processes of severe haze pollution in Beijing in January 2013. J. Geophys. Res. Atmos. 119, 4380–4398. doi:https://doi.org/10.1002/2014JD021641
- Tian, Z., Zhang, D., Song, X., Zhao, F., Li, Z., co-authors. 2020. Characteristics of the atmospheric vertical structure with different sea ice covers over the Pacific sector of the Arctic Ocean in summer. Atmos. Res. 245, 105074. doi:https://doi.org/10.1016/j.atmosres.2020.105074
- Tjernstrom, M. and Graversen, R. G. 2009. The vertical structure of the lower Arctic troposphere analysed from observations and the ERA-40 reanalysis. QJR. Meteorol. Soc. 135, 431–443. doi:https://doi.org/10.1002/qj.380
- Vihma, T., Kilpeläinen, T., Manninen, M., Sjöblom, A., Jakobson, E., co-authors. 2011. Characteristics of Temperature and Humidity Inversions and Low-Level Jets over Svalbard Fjords in Spring. Adv. Meteorol. 2011, 1–14., and doi:https://doi.org/10.1155/2011/486807
- Wang, L., Li, J., Lu, H., Gu, Z., Rioual, P. and co-authors. 2012. The East Asian winter monsoon over the last 15,000 years: its links to high-latitudes and tropical climate systems and complex correlation to the summer monsoon. Quat. Sci. Rev. 32, 131–142. doi:https://doi.org/10.1016/j.quascirev.2011.11.003
- Wang, Y., Zhuang, G., Tang, A., Yuan, H., Sun, Y. and co-authors. 2005. The ion chemistry and the source of PM2.5 aerosol in Beijing. Atmos. Environ. 39, 3771–3784. doi:https://doi.org/10.1016/j.atmosenv.2005.03.013
- Wang, Y. Q., Zhang, X. Y., Sun, J. Y., Zhang, X. C., Che, H. Z., co-authors. 2015. Spatial and temporal variations of the concentrations of PM10, PM2.5 and PM1 in China. Atmos. Chem. Phys. 15, 13585–13598. doi:https://doi.org/10.5194/acp-15-13585-2015
- Wolf, T., Esau, I. and Reuder, J. 2014. Analysis of the vertical temperature structure in the Bergen valley, Norway, and its connection to pollution episodes. J. Geophys. Res.-Atmos. 119, 10645–10662.
- Wood, R. and Bretherton, C. S. 2006. On the relationship between stratiform low cloud cover and lower-tropospheric stability. J. Climate 19, 6425–6432. doi:https://doi.org/10.1175/JCLI3988.1
- Xu, T., Song, Y., Liu, M., Cai, X., Zhang, H., co-authors. 2019. Temperature inversions in severe polluted days derived from radiosonde data in North China from 2011 to 2016. Sci. Total Environ. 647, 1011–1020., and doi:https://doi.org/10.1016/j.scitotenv.2018.08.088
- Yan, Z., Jones, P. D., Davies, T. D., Moberg, A., Bergström, H., co-authors. 2002. Trends of extreme temperatures in Europe and China based on daily observations. Climatic Change 53, 355–392. doi:https://doi.org/10.1023/A:1014939413284
- Yang, Y., Liu, X., Qu, Y., Wang, J., An, J., co-authors. 2015. Formation mechanism of continuous extreme haze episodes in the megacity Beijing, China, in. Atmos. Res. 155, 192–203. doi:https://doi.org/10.1016/j.atmosres.2014.11.023
- You, Q., Kang, S., Aguilar, E., Pepin, N., Flügel, W.-A., co-authors. Changes in daily climate extremes in China and their connection to the large scale atmospheric circulation during 1961-2003. 2011. A. and Clim. Dyn. 36, 2399–2417. doi:https://doi.org/10.1007/s00382-009-0735-0
- Zhang, L., Wang, T., Lv, M. Y. and Zhang, Q. 2015. On the severe haze in Beijing during January 2013: Unraveling the effects of meteorological anomalies with WRF-Chem. Atmos. Environ. 104, 11–21. doi:https://doi.org/10.1016/j.atmosenv.2015.01.001
- Zhang, S., Fang, C., Kuang, W. and Sun, F. 2019. Comparison of changes in urban land use/cover and efficiency of Megaregions in China from 1980 to 2015. Remote Sens. 11, 1834. doi:https://doi.org/10.3390/rs11151834
- Zhang, X. Y., Wang, Y. Q., Niu, T., Zhang, X. C., Gong, S. L. and co-authors. 2012. Atmospheric aerosol compositions in China: spatial/temporal variability, chemical signature, regional haze distribution and comparisons with global aerosols. Atmos. Chem. Phys. 12, 779–799. doi:https://doi.org/10.5194/acp-12-779-2012
- Zhang, Y. H., Seidel, D. J., Golaz, J. C., Deser, C. and Tomas, R. A. 2011. Climatological characteristics of arctic and antarctic surface-based inversions. J. Climate 24, 5167–5186. doi:https://doi.org/10.1175/2011JCLI4004.1
- Zhao, X. J., Zhao, P. S., Xu, J., Meng, W., Pu, W. W. and co-authors. 2013. Analysis of a winter regional haze event and its formation mechanism in the North China Plain. Atmos. Chem. Phys. 13, 5685–5696. doi:https://doi.org/10.5194/acp-13-5685-2013
- Zhong, J. T., Zhang, X. Y., Wang, Y. Q., Liu, C. and Dong, Y. S. 2018. Heavy aerosol pollution episodes in winter Beijing enhanced by radiative cooling effects of aerosols. Atmos. Res. 209, 59–64. doi:https://doi.org/10.1016/j.atmosres.2018.03.011
- Zhou, L., Dickinson, R. E., Tian, Y., Fang, J., Li, Q. and co-authors. 2004. Evidence for a significant urbanization effect on climate in China. Proc Natl Acad Sci U S A 101, 9540–9544.