
 ?Mathematical formulae have been encoded as MathML and are displayed in this HTML version using MathJax in order to improve their display. Uncheck the box to turn MathJax off. This feature requires Javascript. Click on a formula to zoom.
Abstract
Aerosol absorption constitutes a significant component of the total radiative effect of aerosols, and hence its representation in general circulation models is crucial to radiative forcing estimates. We use here multiple observations to evaluate the performance of CAM5.3-Oslo with respect to its aerosol representation. CAM5.3-Oslo is the atmospheric component of the earth system model NorESM1.2 and shows on average an underestimation of aerosol absorption in the focus region over East and South Asia and a strong aerosol absorption overestimation in desert and arid regions compared to observations and other AeroCom phase III models. We explore the reasons of the model spread and find that it is related to the column burden and residence time of absorbing aerosols, in particular black carbon and dust. We conduct further sensitivity simulations with CAM5.3-Oslo to identify processes which are most important for modelled aerosol absorption. The sensitivity experiments target aerosol optical properties, and contrast their impact with effects from changes in emissions and deposition processes, and the driving meteorology. An improved agreement with observations was found with the use of a refined emission data set, transient emissions and assimilation of meteorological observations. Changes in optical properties of absorbing aerosols can also reduce the under- and overestimation of aerosol absorption in the model. However, changes in aerosol absorption strength between the sensitivity experiments are small compared to the inter-model spread among the AeroCom phase III models.
1. Introduction
Aerosol particles play an important role in the Earth’s energy budget since they interact directly with incoming solar radiation by scattering and absorption, and have the ability to change cloud properties such as albedo and lifetime (Twomey, Citation1977; Albrecht, Citation1989; Boucher et al., 2013; Bellouin et al., Citation2020). Absorbing aerosols are of particular interest since their radiative forcing is estimated to be positive, reducing the magnitude of the net aerosol cooling (Bond et al., Citation2013). The main absorbing aerosols are black carbon (BC), mineral dust and brown carbon (BrC) (Samset et al., Citation2018). Particularly, BC has a strong positive radiative forcing which is estimated to be in the range from +0.05 to +1.37 W m−2 (Myhre et al., Citation2013; Peng et al., Citation2016). Rapid adjustments of the atmosphere can further amplify or decrease the warming effect of BC (Hodnebrog et al., Citation2014). Circulation changes induced by the heating of an atmospheric layer by aerosol absorption, can lead to cloud dissipation, or cloud thickening, dependent on the cloud type and vertical position of the aerosol particles relative to the cloud (e.g. Koch and Del Genio, Citation2010; Wilcox, Citation2010; Wilcox et al., Citation2016). Taken together, the aerosol-radiation and aerosol-cloud interactions of absorbing as well as scattering aerosols are estimated to have a net negative radiative effect. The latest assessment of the Intergovernmental Panel on Climate Change gave an estimate of the total aerosol forcing over the industrial era of −0.9 W m−2, with a 90% confidence interval of −1.9 to −0.1 W m−2, and according to a more recent estimate (Bellouin et al., 2020) the total aerosol forcing is within −1.6 to −0.65 W m−2 at 68% confidence, or −2.0 to −0.4 W m−2 at 90% confidence.
Hence, an accurate representation of absorbing aerosols in general circulation models is crucial for estimating the total radiative forcing of aerosol-cloud-radiation interactions. However, there are large inter-model differences, and major discrepancies between models and observations of aerosol absorption (Bond et al., 2013; Shindell et al., Citation2013; Samset et al., Citation2018; Gliß et al., Citation2020). As shown by Wang et al. (Citation2016a), this could be a methodological issue related to the representativeness of observing sites and also discrepancies between in-situ and co-located remote sensing estimates make model validation difficult (Andrews et al., Citation2017). Furthermore, sampling errors can be induced by the lack of spatial and temporal co-location between model output and observational data (Schutgens et al., Citation2016, Citation2017).
BC as a product of fossil fuel combustion and biomass burning is the most widely studied absorbing aerosol component due to its strong absorptivity. BC is typically hydrophobic but ageing processes lead to changes in its ability to serve as cloud condensation nuclei (CCN) and also changes in its absorption strength (Wittbom et al., Citation2014; Dalirian et al., Citation2018). For instance absorption enhancement can occur due to the lensing effect (Peng et al., Citation2016; Saleh et al., 2015; Nakayama et al., Citation2014). However, this absorption enhancement can further affect wet removal and hence transport as well as lifetime (Boucher et al., Citation2016). General circulation models are limited in representing the specific transformation processes of BC (Samset et al., Citation2018). Typically, an aerosol mixing rule is used to calculate the absorption enhancement or they assume a constant value; some models even treat BC as only externally mixed which means that no absorption enhancement is included (Saleh et al., 2015; Samset et al., Citation2018).
Recent studies have also drawn attention to the representation of BrC (i.e. the absorbing fraction of organic carbon) in general circulation models (e.g. Saleh et al., 2015; Brown et al., 2018). BrC which is produced by the combustion of organic matter exhibits a highly variable absorption strength which strongly depends on the burning conditions (Saleh et al., Citation2014; Brown et al., 2018). During its ageing, BrC can experience a so called photochemical bleaching (Zhong and Jang, Citation2014; Forrister et al., Citation2015; Zhao et al., Citation2015; Dasari et al., Citation2019), but also a photochemical browning has been observed (Tsigaridis and Kanakidou, Citation2018). BrC and the associated transformation processes are typically not specified in general circulation models, it is simply included in organic aerosol (OA). However, Brown et al. (2018) and Wang et al. (2016a) showed that implementing BrC as a separate aerosol component improves the agreement of aerosol absorption in general circulation models with observations.
Further discrepancies in aerosol absorption between models and observations can be caused by the representation of mineral dust. Dust as a natural aerosol component is primarily emitted due to friction over arid and semi-arid regions and global models often calculate dust emissions on-line depending on wind speed and soil moisture. Models often assume a globally constant refractive index even though the optical properties of mineral dust can be very different depending on the source region, composition, size distribution, particle shape and ageing processes during atmospheric transport (Petzold et al., Citation2009; Samset et al., Citation2018).
In general, the model representation of aerosol absorption, and resulting radiative forcing, is dependent on the representation of the life cycle of the different types of absorbing aerosols, including the aerosol emissions, transport and deposition processes, microphysical aerosol processes and variations in particle optical properties. It has been suggested that a lack of refined representations of variations in aerosol properties constitutes a primary reason for discrepancies between models and observations (Gustafsson and Ramanathan, Citation2016; Peng et al., Citation2016). Improved microphysical treatment of aerosols in global models is one of several recommendations towards improved constraints on aerosol absorption made by Samset et al. (Citation2018). In this study, we investigate the relative importance of detailed and accurate representation of aerosol properties, compared to the more general representation of physical processes such as sources, sinks and transport.
The representation of absorption by aerosol particles is investigated in the atmospheric model CAM5.3-Oslo with the focus on large parts of Asia, ranging from the Arabian peninsula in the West to the Japanese sea in the East and from the equator to Mongolia in the North. This region is particularly interesting because all three absorbing aerosol types described above can be found in a high concentration either simultaneously or individually, depending on the specific area. It is well known that parts of the focus area are hotspots for pollution aerosol from fossil fuel combustion and biomass burning. Several desert areas as the Arabian peninsula or the Gobi desert are also included in the focus region.
We evaluate the model performance with a multi-model intercomparison, reanalysis and remote sensing observations. We identify processes which can help to improve aerosol absorption in this specific model through sensitivity experiments targeting aerosol emissions, deposition, and meteorology, as well as optical properties. We focus here on aerosol-radiation interactions by absorbing aerosols and do not investigate effects of absorbing aerosols on clouds. A description of the aerosol representation in CAM5.3-Oslo can be found in section 2, followed by a description of the utilised data and methods in section 3. We present and discuss our results in section 4 and summarise our findings in section 5.
2. CAM5.3-Oslo and its aerosol representation
We use the atmospheric component CAM5.3-Oslo (Kirkevåg et al., Citation2018) of the earth system model NorESM1.2, which has an atmospheric core based on the Community Atmosphere Model (CAM) version 5.3 (CAM5.3; Neale et al., Citation2012; Liu et al., Citation2016), and is coupled to a sophisticated aerosol module OsloAero5.3 with 30 vertical model layers and a horizontal resolution of 0.9 in latitude by 1.25
in longitude. NorESM1.2 is an intermediate model version (between NorESM1 and NorESM2) which has not been published with results from fully coupled (with the ocean component) simulations. In this study, we use an AMIP-type configuration of the model, i.e. prescribed sea surface temperatures and sea ice.
Aerosol types represented in the model are dust, sea salt, sulphate, BC and OA, which includes both primary and secondary organic aerosols. Dust and sea salt emissions are wind- and temperature-driven and calculated online; sea-salt emissions are based on the parameterisation by Salter et al. (Citation2015) while dust emissions follow Zender et al. (Citation2003). Anthropogenic aerosol emissions are from the Coupled Model Intercomparison Project (CMIP) phase 5 (CMIP5). Fossil fuel and biofuel emissions are thereby emitted at the surface, while biomass burning emissions are inserted at 13 model levels following the recommendations by Dentener et al. (Citation2006). Precursor emissions of secondary organic aerosol (consisting of monoterpene and isoprene) come from the Model of Emissions of Gases and Aerosols from Nature (MEGAN) 2.1 module in the Community Land Model (CLM). The treatment of secondary organic aerosol is based on Makkonen et al. (Citation2014) and has been updated as described by Kirkevåg et al. (2018).
The aerosol number concentration is not a prognostic variable in the model, but is ’production-tagged’, i.e. the size-resolved aerosol mass and number concentration is calculated offline using look-up tables and is tagged to the different production mechanisms. Both aerosol-radiation and aerosol-cloud interactions are parameterised, so that the predefined ’background’ lognormal modes can be changed by condensation, coagulation and cloud processing (Kirkevåg et al., 2018). Also, optical properties are calculated a posteriori using look-up tables. For the pure aerosol components, prescribed refractive indices are used. Sea salt and sulphate aerosols are prescribed as reflecting, dust and organic aerosols are mainly reflecting and partly absorbing, whereas BC is mainly absorbing. All aerosol types can be internally and externally mixed, so that also absorbing particles can become hygroscopic and activated as CCN. The refractive index of internally mixed BC with less absorptive aerosols is calculated from the Maxwell-Garnett mixing rule, otherwise the volume mixing rule is applied (Kirkevåg et al., Citation2008).
All aerosol particles can be removed by dry and wet deposition in the model. Dry deposition includes gravitational settling, which depends on the size of the particles. Bigger particles in the coarse mode, such as e.g. dust are thereby more affected by dry deposition compared to smaller particles. Wet scavenging is divided into in-cloud and below-cloud scavenging, where in-cloud scavenging represents the formation of cloud droplets from aerosols by impaction and nucleation and below-cloud scavenging refers to wet removal of aerosols by precipitation. A detailed model description can be found in Kirkevåg et al. (2018).
3. Data and methods
We use ground and satellite based observations, the Modern-Era Retrospective Analysis for Research and Applications version 2 (MERRA-2) reanalysis as well as multi-model output of the model intercomparison project Aerosol Comparisons between Observations and Models (AeroCom) phase III to evaluate the performance of CAM5.3-Oslo, in an Asian region largely influenced by the three types of absorbing aerosols, BC, OA and mineral dust. Observational data and MERRA-2 reanalysis is used for the years 2006 to 2012 while multi-model output is only available for the year 2010.
3.1. Focus region
We define the focus domain as 0–50 N latitude and 40–150
E longitude, thereby including heavily polluted regions such as East Asia (mostly China) and the Indo-Gangetic Plain (IGP) in the northern part of the Indian subcontinent. Aerosols in these areas are well known to have effects on radiation, clouds, atmospheric circulation and not least on human health (Ramanathan and Carmichael, Citation2008; Pan et al., Citation2015). In particular, high emissions of biomass burning aerosols are found in the focus area due to crop burning and wild fires in South and South East Asia. Furthermore, natural mineral dust has a large contribution in the studied domain, due to seasonal transport from the Middle East, e.g. the Arabian Peninsula and Iran, or from the Thar desert at the border between Pakistan and India, towards South and Central Asia (Pan et al., 2015).
A large seasonal variability of absorbing aerosols occurs due to the Asian monsoon. The monsoon cycle affects large parts of the focus region and leads to dry polluted conditions during winter and strong precipitation in summer. The transition periods, pre- and post-monsoon, are often characterised by dust events and/or heavy biomass burning (e.g. Ramana and Ramanathan, Citation2006; Gautam et al., Citation2013; Singh et al., Citation2019). Pollution aerosol has also been found to be transported to higher altitudes by convection and form so called atmospheric brown clouds mostly over southern Asia and the northern Indian Ocean, thereby heating higher altitude atmospheric layers, while cooling the surface and thereby changing the thermal stability of the atmosphere (Ramanathan and Carmichael, Citation2008; Gustafsson et al., Citation2009).
3.2. Observations
The Level 1.5 total AOD calculated from sun-photometer measurements and subsequently retrieved AAOD provided by the Aerosol Robotic Network (AERONET; Holben et al., Citation1998) version 3 (Giles et al., Citation2019) is used for several stations in the studied area. The AOD and AAOD are the vertical column integrated aerosol extinction and absorption, respectively. AERONET provides both variables at different wavelengths, but AOD and AAOD at 550 nm are not available and were here derived using the Ångström exponent in order to match the model output. The uncertainty in AOD is estimated to range from 0.01 to 0.02, with a maximum at shorter wavelengths (340 and 380 nm; Giles et al., 2019). The AAOD is retrieved from an inversion routine and can be highly uncertain (±0.015) for measurements with low aerosol concentration (AOD(440 nm) < 0.2) (Andrews et al., 2017). Level 2.0 AAOD retrievals exclude all measurements with too low AOD (< 0.4) to reduce this uncertainty. This might lead to a bias towards high AAOD (Andrews et al., 2017) and therefore Level 1.5 data is used in this study.
Here, the observations from all available AERONET stations within the focus region with a minimum number of provided monthly means (> 12 months for long-term data from 2006 to 2012 and > 5 months for the year 2010) are used to allow a quantitative comparison. Furthermore, six AERONET stations are selected by their different aerosol and meteorological signature for a detailed discussion of the model performance. First, the stations Kanpur located in the IGP and Beijing in China represent heavily polluted urban areas with strong fossil fuel and biofuel emissions. Both stations are also highly influenced by mineral dust during spring and summer (Sessions et al., Citation2015; Eck et al., Citation2010). Second, we use the stations Solar Village in Saudi Arabia and Karachi at the coast in southern Pakistan since they are dominated by mineral dust emissions. Moreover, the station Pokhara has been chosen, which is located in the densely populated and elevated Pokhara valley in Nepal and receives pollution aerosol and dust from west and southwest during winter and the pre-monsoon season (Singh et al., 2019). Last, Chiang Mai in Thailand has been selected for its yearly recurring high aerosol concentration in the pre-monsoon season which is caused by strong biomass burning activity on the Indochina peninsula (Gautam et al., Citation2013). A list of all utilised AERONET stations with location information can be found in .
Table 1. Summary and short description of the used AERONET data.
Additionally, the model was evaluated with monthly averaged satellite retrievals of clear-sky AOD from MODIS (Remer et al., Citation2005) aboard the Terra satellite in the A-train constellation. The satellite was launched in 2003, and we use here data from 2006 to 2012 of the MODIS Level 3 Collection 6 data set, with a spatial horizontal resolution of 1 latitude by 1
longitude (Platnick et al., Citation2015).
3.3. MERRA-2 reanalysis
The MERRA-2 aerosol reanalysis assimilates besides meteorological also aerosol observations (Randles et al., Citation2017). The reanalysis is built with the GOCART aerosol module, coupled to the GEOS5 Earth system model. The AOD is thereby fitted to the bias-corrected AOD from the Advanced Very High Resolution Radiometer (AVHRR), the Moderate Resolution Imaging Spectroradiometer (MODIS), AERONET ground stations, and over desert regions to AOD from the Multi-angle Imaging SpectroRadiometer (MISR). No observations of AAOD are assimilated, but aerosol mass which is used to derive AAOD is constrained by the AOD assimilation (Buchard et al., Citation2017). Aerosol types represented in MERRA-2 are dust, sea salt, sulphate, OA and BC. Optical properties (complex refractive indices) of the absorbing aerosols are listed in . Aerosol emissions are transient, i.e. synchronous with the actual year. Dust and sea salt emissions are wind-driven. Anthropogenic aerosol emissions additionally include ship and aircraft emissions (Randles et al., Citation2017). We use the monthly mean output from MERRA-2 of total clear-sky AOD, total clear-sky AAOD, as well as emissions, deposition and column burden for individual aerosol types. A detailed description of MERRA-2 is found in Gelaro et al. (Citation2017), Randles et al. (Citation2017) and Buchard et al. (Citation2017).
Table 2. Summary and short description of MERRA-2 and AeroCom phase III models.
3.4. Aerocom phase III models
Model output of the model intercomparison project AeroCom phase III was used to compare CAM5.3-Oslo to other state-of-the-art models. Only a subset of four models (CAM5.3-Oslo, GEOS5-assimilate (GEOS-A), GEOS5-freegcm (GEOS-F), HadGEM3-GA7.1 (HadGEM)) out of 12 models provides aerosol absorption as output for the control experiment. All models assimilate meteorological fields from reanalysis (nudging) to simulate the year 2010, except GEOS-F, which is run in a coupled ocean-atmosphere configuration. HadGEM and CAM5.3-Oslo are nudged to the ERA-interim reanalysis while GEOS is nudged to MERRA-2. Aerosol types represented in all models are dust, sea salt, sulphate, OA and BC. HadGEM is the only model which includes representation of nitrate. The GEOS and HadGEM model use the aerosol emission inventory from the CMIP phase 6 (CMIP6; see Hoesly et al. (Citation2018) for anthropogenic and van Marle et al. (Citation2017) for biomass burning emissions) with transient emissions, i.e. emissions are for the given year. CAM5.3-Oslo uses the CMIP5 emission inventory with aerosol emissions of the year 2000. Dust and sea salt emissions are wind-driven in all models. Optical properties of the individual aerosol types differ among the models (see ). We analyse monthly mean model output of total AOD, total AAOD, and emissions, deposition and column burden for individual aerosol species. Note, HadGEM provides a clear-sky AOD and AAOD while GEOS provides all-sky. CAM5.3-Oslo provides all-sky and clear-sky diagnostics, and we present here all-sky. For detailed model descriptions see the references in .
3.5. CAM5.3-Oslo simulations
We perform a nudged control simulation (experiment Control, see ) with the CAM5.3-Oslo model for the years 2006 to 2012. The model is thereby nudged to ERA-interim reanalysis, i.e. assimilating horizontal winds and surface pressure while keeping the sea surface temperature fixed, following the recommendations by Zhang et al. (Citation2014) for studying aerosol-cloud interactions. As in the AeroCom control experiment setup, the aerosol emissions are monthly prescribed and of the year 2000, using emissions provided by CMIP5. We perform further sensitivity simulations and the results are compared with the control simulation that serves as a reference. The sensitivity experiments have the same configuration as the control simulation, except that they are conducted only for the year 2010, for a better comparison with the AeroCom model output, which is only available for the year 2010. Aerosol absorption in the model can be affected by changes in the emitted aerosol mass, transport and removal processes and optical characteristics of the individual aerosol types. Hence, the chosen sensitivity simulations target these processes and are split into the four categories: emissions, deposition, meteorology, and optical properties. All changes in the sensitivity experiments are applied globally, so that the studied domain may also be affected by changes in the surrounding areas. The model simulations are described in detail in the following and a summary of the experiments can be found in .
Table 3. Summary and short description of the control and sensitivity experiments.
3.5.1. Emissions
Although it has been suggested that representation of aerosol transport, residence time and deposition is of greater importance for inter-model variations in modelled aerosol properties than a harmonisation of aerosol emissions (Textor et al., Citation2007), it has also been found that BC emissions are underestimated in current climate models (Chung et al., Citation2012; Gustafsson and Ramanathan, Citation2016; Wang et al., Citation2016b). In addition to the default emission data set, we therefore here use the new emission inventory provided by CMIP6, using the emission year 2000 (experiment CMIP6_PD) as in the control simulation. While the default emission data set provides monthly mean data only until the year 2005, the new CMIP6 emission data set reaches until December 2014 for anthropogenic and until December 2015 for biomass burning emissions, allowing for an additional experiment with a transient emission cycle (CMIP6_transient), i.e. emissions are synchronous with the simulated year 2010, to support analysis of year-to-year variability in emissions.
Moreover, we evaluate the model configuration in terms of emissions of OA and dust. The representation of OA in CAM5.3-Oslo includes primary organic matter and secondary organic aerosols. Organic carbon emissions are normally converted to organic matter by applying a prescribed factor of 2.6 for emissions from biomass burning and a factor of 1.4 for emissions from fossil fuel combustion. In one of the sensitivity experiments, we choose a ratio of 1.7 for all organic carbon emissions (OM-OC_1.7) following Wang et al. (2016a).
Dust emissions in CAM5.3-Oslo were found to be overestimated (Kirkevåg et al., 2018). The model uses a tuning factor to scale dust emissions, and to test the sensitivity of aerosol absorption to dust emissions, especially in desert and arid parts of the focus domain, we halve the emission fluxes (DUemissions_tuned).
3.5.2. Deposition
Aerosol particles can be removed through dry and wet deposition in the model. To test the influence of deposition processes on aerosol absorption, in one of the experiments we change the efficiency of below-cloud scavenging, which is parameterised using scavenging coefficients. The scavenging coefficients for BC are decreased by a factor of two (BCscav_lower), opposed to an increase for dust, also by a factor of two (DUscav_higher). In the focus region, with large parts dominated by mineral dust, we test the sensitivity to dry deposition by increasing the fall velocity of dust by 10% (DUdrydep_increased).
3.5.3. Meteorology
The control simulation is nudged to ERA-interim reanalysis but with fixed sea surface temperature and sea ice. To test the influence of meteorological variation and thereby differences in wind-driven emissions, transport and deposition processes, we assimilate the model here to the new ERA5 reanalysis (ERA5). In addition, we conduct a 10-year AMIP-type simulation with no assimilation of meteorological fields, and with aerosol emissions of the year 2000 as in the control simulation.
3.5.4. Optical properties
In this category of sensitivity experiments, we implement changes concerning the absorption ability of pure aerosol components. This experiment category evaluates thereby model-specific configurations rather than the representation of physical processes which influence the life cycle.
The absorption ability of a pure aerosol component is defined through the wavelength dependent imaginary part of the refractive index in the model. We increase the default value of 0.79 for BC, which is based on Bond and Bergstrom (Citation2006) to a value of 1.0 for the entire visible spectrum (BCrefrac_1.0), so that BC is prescribed as fully absorbing.
The imaginary part of the refractive index at 550 nm for OA is fairly low in CAM5.3-Oslo compared to the other AeroCom models and MERRA-2 reanalysis included in this study (see ). In one of the experiments we adjust the absorptivity of OA and choose a higher absorption ability according to MERRA-2 (OArefrac_MERRA).
In contrast, the absorptivity of dust in CAM5.3-Oslo is high compared to the included AeroCom models and MERRA-2 reanalysis (see ). We choose here the imaginary part of the dust refractive index at 550 nm of MERRA-2, so that dust becomes more reflecting (DUrefrac_MERRA).
3.6. Analysis methods
We evaluate the representation of absorption by aerosols in the model CAM5.3-Oslo in the focus domain in section 4.1.1 by comparing the model control simulation with observations from MODIS and AERONET and include also MERRA-2 reanalysis. We evaluate further the model performance compared to three additional AeroCom phase III models in section 4.1.2.
We compare both the spatial and temporal variability of AAOD especially between the models and remote sensing observations. In that way, model spreads in AAOD can be broadly linked to e.g. the representation of aerosol species and emission strength.
In section 4.2, the sensitivity of the modelled aerosol absorption in CAM5.3-Oslo to the aforementioned changes in emissions, deposition, meteorology and optical aerosol properties is studied. We focus on relative changes in AAOD between the control and sensitivity simulations in order to identify the main processes which influence the absorbing ability of aerosols in the model and compare further changes in aerosol burden, emissions and residence time. The seasonal variability in comparison with other models and selected AERONET stations is analysed in section 4.2.5.
4. Results and discussion
4.1. CAM5.3-Oslo model evaluation
4.1.1. Regional distribution of AOD and AAOD
shows the AOD spatial distribution of the observations (MODIS, AERONET), reanalysis (MERRA-2) and the model’s control simulation for the temporal mean of the years 2006 to 2012 (, c, e) as well as the direct comparison between monthly mean AERONET AOD and monthly mean AOD of MODIS, MERRA-2 and the control simulation (, d, f). Note, that the AOD of MODIS, MERRA-2 and AERONET is for clear-sky while the modelled AOD is all-sky. MERRA-2 reanalysis seems to be in agreement with MODIS and AERONET observations with a similar AOD distribution and a low mean difference of 14% between MERRA-2 and MODIS, owing to the fact that MERRA-2 AOD assimilation includes these observations, among others. The control simulation () shows an overestimation of AOD by more than 100% over desert and arid regions, and locally even more than 200% compared to MODIS observations, but underestimates over East Asia, the Indian subcontinent, Tibet and the oceans often by more than 50%.
Fig. 1. Left: Temporal mean of the years 2006 to 2012 of aerosol optical depth (AOD) for MODIS (a), MERRA-2 reanalysis (c) and the model control simulation (e) in the focus region. AERONET observations are illustrated as coloured circles. Right: Scatter plots of MODIS (b), MERRA-2 (d) and modelled AOD (f) against AERONET retrievals (monthly average). Note, the AOD of MODIS, MERRA-2 and AERONET is clear-sky while the modelled AOD is for all-sky.
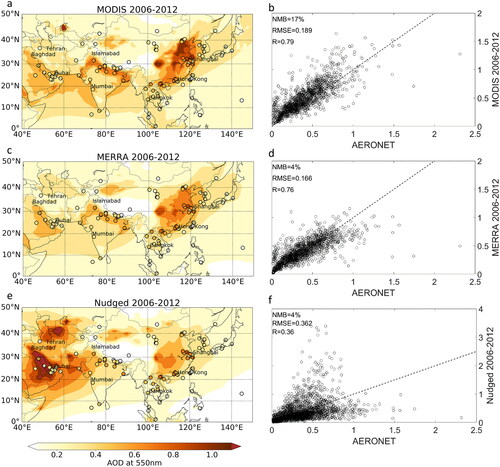
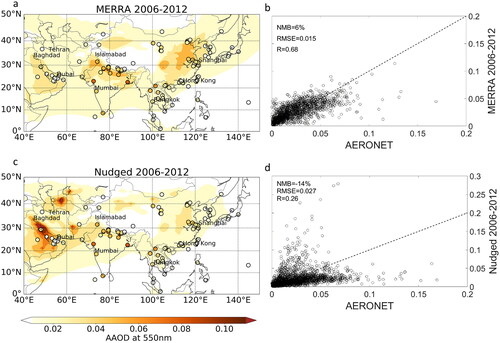
Comparing further the modelled AAOD with MERRA-2 and AERONET observations, the model underestimates absorption by aerosols in large parts of the focus region (). However, a similar spatial variability as seen in the AOD distribution is found; AAOD is underestimated compared to MERRA-2 data, especially over the IGP, East Asia as well as ocean areas and strongly overestimated over dust-dominated areas within the focus domain, locally by over 100% (see ). While Buchard et al. (Citation2017) showed that MERRA-2 AAOD agrees with estimates from observations on the global scale, we find that MERRA-2 still underestimates the AAOD in some parts of the focus region if compared to ground-based AERONET stations, especially over the Indian subcontinent. Note, that the AAOD of MERRA-2 and AERONET is for clear-sky while the modelled AAOD is all-sky.
Fig. 2. Left: Temporal mean of the years 2006 to 2012 of absorption aerosol optical depth (AAOD) for MERRA-2 reanalysis (a) and the model control simulation (c) in the focus region. AERONET observations are illustrated as coloured circles. Right: Scatter plots of MERRA-2 (b) and modelled AAOD (d) against AERONET retrievals (monthly average). Note, the AAOD of MERRA-2 and AERONET is clear-sky while the modelled AAOD is for all-sky.
To evaluate whether the model CAM5.3-Oslo reproduces seasonal and interannual variability in aerosol absorption, we compare monthly mean AAOD of the control simulation with MERRA-2 reanalysis and AERONET observations from 2006 to 2012 at selected measurement stations within the focus region (see ). Moreover, to distinguish the contribution of the three absorbing aerosol types BC, dust and OA in the model simulation, the AAOD of each component is shown. Note, the AAOD of these three components does not add up to their sum due to the technical method used for decomposition of total absorption from each of the aerosol species in internal mixtures in the model. The model output has been linearly interpolated to the exact station location from data of the two closest grid points according to Schutgens et al. (2016).
Fig. 3. AAOD timeseries from the nudged control (blue) and AMIP (black, dashed) simulations compared to AERONET (grey bars) and MERRA-2 (grey line) AAOD monthly means (Level 1.5) of selected AERONET stations. The AAOD contribution of BC (red), dust (yellow) and OA (green) to the nudged control simulation is shown as well. Note, the AAOD of BC, OA and dust does not add up to their sum due to the technical realisation of internal mixing in the model. The map in the bottom left corner shows the respective locations of the AERONET stations.
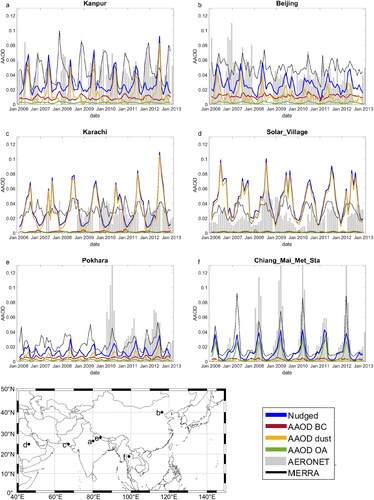
In accordance with the results above, the highest simulated AAOD is periodically evident at the two dust-dominated stations Solar Village and Karachi (), with a mean AAOD overestimation of as high as +142% at Solar Village compared to AERONET retrievals. The strong seasonality in the nudged model simulation is driven primarily by dust at these two locations since neither BC nor OA contribute significantly to the modelled AAOD. Both timeseries indicate that most likely the dust column burden or the absorptivity of mineral dust is overestimated in CAM5.3-Oslo.
On the contrary, the clear signal of high AAOD values during spring in Chiang Mai is reproduced well in the model as seen in . However, the modelled AAOD reaches only one third of the observed maximum, and the underestimation in AAOD is with −58% highest among all stations. In accordance with the biomass burning influence at the station, CAM5.3-Oslo shows a large contribution of OA absorption to the total AAOD and discrepancies with the observations might be explained by too low OA emissions, the relatively low imaginary part of the refractive index or also the coarse model resolution. As discussed in Sessions et al. (2015), model biases are also known to be high at this station in the biomass burning season.
The largest temporal variability in absorption strength, with irregular maxima, is found at the urban stations Kanpur and Beijing. However, the mean magnitude of modelled AAOD is not underestimated by more than −28% and −37% respectively for Beijing and Kanpur. Besides a strong seasonality in dust column burden and hence in dust AAOD, both urban stations exhibit significant contributions from BC and OA to the total AAOD with a dominance of BC often during winter months (see ). Reasons for the underestimation could be too low emissions for large metropolitan areas as for instance seen in Pan et al. (2015) where anthropogenic fossil fuel and biofuel emissions were underestimated for several cities in the IGP, including Kanpur.
Another underestimation of AAOD with as high as −53% in the control simulation compared to the observations occurs at the remote Pokhara station (see ). Reasons for this discrepancy might be a deficiency in emissions and an incorrect representation of air mass transport in high mountain areas in the model (Pan et al., 2015; Schutgens et al., 2017). Consistent with Singh et al. (2019), dust dominates the AAOD during the pre-monsoon season in the model while BC affects the AAOD mainly in other seasons. In summertime, most of the aerosols are washed out due to the strong monsoon precipitation.
MERRA-2 reanalysis represents the AAOD timeseries in many cases much better with for instance negligible differences for Kanpur if compared to the AERONET retrieval. Even though the AAOD is considerably overestimated for Beijing, the temporal evolution corresponds reasonably well with the observations at both urban stations. The largest discrepancy between MERRA-2 and AERONET occurs for Solar Village with +47% overestimation while the AAOD is also underestimated in Chiang Mai (–44%) and Pokhara (–16%), similarly to CAM5.3-Oslo.
To summarise, CAM5.3-Oslo is able to reproduce seasonal and also interannual variability to some extent, but the model performance varies between dust-dominated and polluted areas. At dust dominated stations an overestimation of AAOD occurs compared to an underestimation of AAOD in polluted regions which is smaller in magnitude. Here, it is also important to note that differences between observations and the model can be caused by differences in aerosol emissions since CAM5.3 Oslo has monthly prescribed emissions of the year 2000 (see section 3.5).
4.1.2. Aerocom multi-model intercomparison and evaluation
In the following, we compare AOD and AAOD output of four AeroCom phase III models and evaluate model performances in the representation of aerosol absorption in the focus region using observations from AERONET. and show the AOD and AAOD distribution of four AeroCom phase III models (left side), including CAM5.3-Oslo, for the year 2010 in the focus domain, in comparison with AERONET station data for the year 2010. Furthermore, both figures show on the right side a direct comparison between the monthly mean AOD () and AAOD () from the AeroCom phase III models and the monthly mean clear-sky AOD and AAOD retrievals from various AERONET stations.
Fig. 4. Left: Annual mean of the year 2010 of aerosol optical depth (AOD) for four AeroCom phase III models in the focus region (a, c, e, g). Note, HadGEM uses a clear-sky AOD while GEOS and CAM5.3-Oslo use all-sky. AERONET clear-sky AOD observations as annual mean of the year 2010 are illustrated as coloured circles. Right: Scatter plots of modelled AOD against AERONET (monthly average) observations (b, d, f, h).
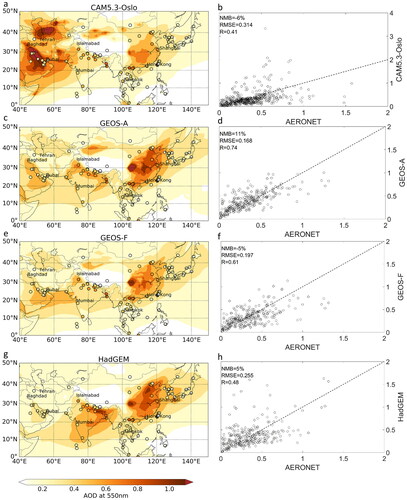
Fig. 5. Left: Annual mean of the year 2010 of absorption aerosol optical depth (AAOD) for four AeroCom phase III models in the focus region (a, c, e, g). Note, HadGEM uses a clear-sky AOD while GEOS and CAM5.3-Oslo use all-sky. AERONET clear-sky AAOD observations as annual mean of the year 2010 are illustrated as coloured circles. Right (b, d, f, h): Scatter plots of modelled AAOD against AERONET observations (monthly average).
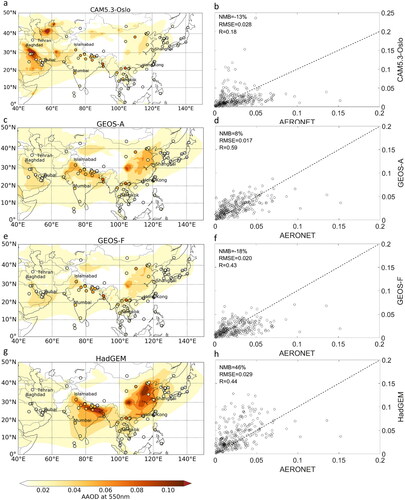
As mentioned in section 4.1.1, CAM5.3-Oslo overestimates AOD and AAOD over desert and arid areas within the focus domain compared to remote sensing observations. A comparison to the other AeroCom models reveals that this model bias in CAM5.3-Oslo does not occur in the other models. Dust emissions which are wind-driven in all models, vary widely among the models. Gliß et al. (2020) found similar that dust burdens vary largely on the global scale among AeroCom phase III models. CAM5.3-Oslo has the highest dust emissions and the highest averaged dust burden over desert regions, which yields a high AOD and AAOD. In addition, this model prescribes the highest dust absorptivity at 550 nm (see ), which amplifies aerosol absorption over dust-dominated areas. However, the regional mean burden of dust is low compared to the other models, consistent with the short residence time of dust (see ). The residence time of each aerosol type is here defined as the ratio between column burden of an aerosol species and its total deposition (wet and dry). The two GEOS models show a slight overestimation of aerosol absorption over the deserts of the Arabian peninsula and HadGEM with a fairly low dust absorptivity and short dust residence time seems to compare best with AERONET AAOD retrievals over deserts. Model differences in the defined dust size distribution can lead to the spread in residence time of dust due to the size dependence of dry deposition; and moreover can result in diverse absorption strength in the longwave spectrum by larger particles. According to Kok et al. (Citation2017), many models tend to overestimate the fraction of fine mode dust which leads to decreased aerosol absorption and is thought to be less realistic if compared to observations.
Table 4. Mean AAOD, normalised mean bias (NMB) and correlation (R) compared to AERONET, aerosol emissions, column burden and residence times for absorbing aerosols for MERRA-2 and AeroCom phase III models on the regional scale for the year 2010.
Focussing on areas influenced by anthropogenic pollution within the studied domain, CAM5.3-Oslo underestimates AOD and AAOD compared to remote sensing observations, in particular over the IGP (see section 4.1.1). Comparing CAM5.3-Oslo to the other AeroCom models indicates that the underestimation over the IGP seems to be a common model bias, in agreement with Pan et al. (2015). However, HadGEM shows an overestimation over the IGP and the whole Indian subcontinent which is neither supported by AERONET nor MODIS observations as seen in . GEOS-A and HadGEM give relatively high AOD over eastern Asia, for instance over the Sichuan Basin in China. The free running version of the GEOS model, GEOS-F, shows in general lower AOD and AAOD in comparison with the other models. The large discrepancies in AOD and AAOD in polluted areas within the focus domain are consistent with differences in OA and BC emissions among the AeroCom models (see ). CAM5.3-Oslo has the lowest emissions and shortest residence time of BC among the models, which yields the lowest BC burden and is consistent with the underestimated aerosol absorption as for instance seen over the Indian subcontinent in . However, according to Lund et al. (Citation2018) the BC residence time in CAM5.3-Oslo with < 5.5 days agrees better with observations. HadGEM has a similar BC residence time and strong absorptivity (see ) as CAM5.3-Oslo but shows in contrast the highest AAOD in polluted regions. Since HadGEM is the only model which prescribes OA as non-absorbing, the differences in aerosol absorption over the Indian subcontinent and East Asia between HadGEM and CAM5.3-Oslo seem to be related to the higher BC emissions and column burden in HadGEM rather than differences in optical properties. Also, HadGEM is the only model which includes nitrate aerosols, and as shown by Pan et al. (2015) this has at least improved the AOD distribution over South Asia compared to observations. GEOS-A on the other hand also slightly underestimates AAOD in polluted areas even though the burden of BC and OA is higher compared to CAM5.3-Oslo as is the OA absorptivity; the BC absorptivity, however, is lower.
Further, model differences were found for the treatment of aerosol mixtures; all models include external mixing of aerosol components, but differ in their treatment of internal mixing. The two GEOS models do not include internal mixing of aerosol components (Colarco et al., Citation2010), which could result in a lower absorption compared to AERONET observations. However, AAOD underestimation is in the focus domain mainly prominent in CAM5.3-Oslo opposed to the GEOS models (see ). Also, as shown by Klingmüller et al. (Citation2014), the use of different mixing rules for internal mixtures can furthermore lead to differences in the modelled absorption. But here, both CAM5.3-Oslo and HadGEM use the Maxwell-Garnett mixing rule for internal mixtures involving BC (Kirkevåg et al., 2018; Mann et al., Citation2010), so that model discrepancies between these two models are not related to the treatment of refractive index calculations, but there might be other differences such as e.g. the types of mixtures and their sizes.
To conclude, the large model spread seen in the representation of total aerosol absorption in the focus domain has a distinct spatial variability and model performances vary between dust-dominated and heavily polluted areas. Model discrepancies are over desert areas mainly related to dust emissions, burden and residence time whereas differences in BC and OA emissions and their burdens matter most over polluted areas. Optical properties of individual aerosol species seem, in general, to be of less importance concerning model spread, but at least the high absorbing ability of dust in CAM5.3-Oslo could amplify an overestimation in AAOD over deserts.
4.2. CAM5.3-Oslo sensitivity simulations
We present in the following the performed sensitivity simulations, which are motivated by the aforementioned model biases in CAM5.3-Oslo compared to three additional AeroCom models and are targeting aerosol emissions, deposition, driving meteorology and optical properties. Changes in aerosol absorption between the control and sensitivity simulations are visualised in as changes in total AAOD over the focus domain. Furthermore, the mean AAOD for the different sensitivity experiments compared to the other AeroCom models for the focus domain and three subregions, namely India, East Asia and Arabia, are summarised in . To illustrate changes in seasonal variability between the sensitivity experiments in comparison with AeroCom models, we show further the seasonal cycle of the year 2010 at selected AERONET stations in . Relative changes between the control and sensitivity simulations in absorbing aerosol burden, residence time and mean AAOD are given in .
Fig. 6. Absolute differences in AAOD between the nudged model control simulation and the model sensitivity experiments in the categories ’Emissions’ (a, b), ’Meteorology’ (c, d), ’Optics’ (e, f, g) as well as one combined sensitivity experiment (h) for the year 2010 in the focus region.
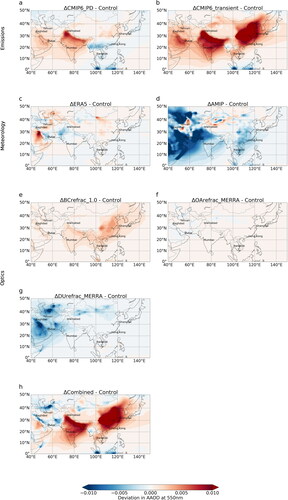
Fig. 7. AAOD seasonal variability for the year 2010 from the AMIP and nudged control simulations compared to AeroCom phase III models and AERONET AAOD monthly means (Level 1.5). The blue shaded area indicates the range of AAOD changes for all sensitivity experiments. The map in the bottom left corner shows the respective locations of the AERONET stations.

Fig. 8. Regionally averaged AAOD for the control simulation, sensitivity experiments as well as MERRA-2 and the AeroCom phase III models. The error bars show the inter-quartile range. The regions are (a) the focus region Asia, (b) India, (c) East China and (d) Arabia.
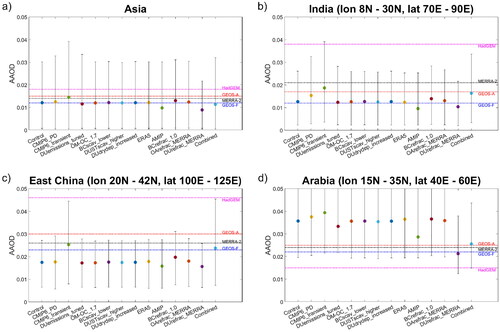
Table 5. Absolute regional mean in AAOD for the year 2010, the normalised mean bias (NMB, in %) and correlation (R) compared to AERONET data.
4.2.1. Emissions
, b illustrate the importance of the aerosol emission data set for the magnitude and spatial distribution of absorption in the model. With the updated CMIP6 emission data set, but with the same emission year as in the control simulation (experiment CMIP6_PD) the AAOD in South and East Asia increases (see ). In particular over the IGP, where the model in section 4.1.1 was found to underestimate absorption compared to observations, the absorption is here enhanced with up to +39%. However, a strong decrease in AAOD occurs over South East Asia (locally up to −86%), so that the regional mean in AAOD increases by only +1%. The global mean AAOD even decreases by −6%.
The updated emission data set alters BC and OA emissions, affecting the burdens of these absorbing aerosols (see ), but does not affect the wind-driven dust emissions which are calculated online in the model. BC emissions and the column burden increases by +7% and +12%, respectively, as opposed to a decrease in OA emissions by −23% and column burden by −11%. However, according to van der Werf et al. (Citation2017, Citation2010) an increase in OA should be expected due to enhanced global fire emissions in the new CMIP6 emission data set which uses GFED4 fire emissions instead of GFED2 in CMIP5.
A high year-to-year variability for aerosol emissions occurs in the studied domain, and a transient emission cycle (CMIP6_transient) yields the strongest increase in AAOD among the sensitivity experiments in the domain with a mean regional change of +21% and an enhancement of up to +88% in remote mountain areas in south-central China and the Himalaya (see ). Globally, the AAOD also increases by 12% with the transient emissions. The regionally substantial AAOD response is here mainly related to an increase in BC emissions, with as much as +51% deviation from the control simulation. Even though the deposition of BC rises as well (not shown), the higher BC emissions are sufficient to give a remarkable net increase in BC column burden of +58%, and the BC residence time is with 5.9 days higher in this experiment than in any of the others (see ). However, the changes in lifetime obtained from the sensitivity experiments are small compared to the spread among the different models. Changes in OA emissions and burden are relatively small for this experiment, so that the strong increase in AAOD is here mainly associated with an increase in BC aerosols.
Comparing the two simulations using CMIP6 emissions (CMIP6_PD and CMIP6_transient, see ) shows that not only the choice of data set but also the actual emission year is crucial for the AAOD, particularly in areas influenced by pollution. Both experiments give a higher absorption by aerosols in the focus domain, especially over the IGP. The global clear-sky radiative effect of aerosol-radiation interactions calculated as the difference in top-of-the-atmosphere short-wave fluxes between control simulation and experiment, however seems to be fairly small (–0.003 and −0.002 W m−2) which is probably related to simultaneous increase in emissions of sulphate.
A small decrease in AAOD of −2% occurs for the experiment with a fixed factor for converting organic carbon emissions to organic matter, independently of the emission source (OM-OC_1.7, not shown). This experiment affects only OA emissions and the reduced conversion factor leads, as expected, to a decline in emissions by −16% which in turn results in a lower OA column burden (–12%), but changes in residence time are small. This highlights that the model configuration in regard to OA emissions is less important for the representation of AAOD and that rather uncertainties in emission inventories contribute to underestimated modelled emissions of biomass burning aerosols, as seen in the experiment CMIP6_PD and CMIP6_transient. However, the aerosol clear-sky radiative effect is with 0.1 W m−2 relatively large compared to the other experiments. As discussed in section 4.1.1, the AAOD over dust-dominated areas is high in CAM5.3-Oslo compared to observations and other AeroCom models. Reducing the dust emissions (DUemissions_tuned) decreases the regional mean AAOD only by −3% but locally by as much as −27% (not shown). The residence time of dust decreases only slightly, so that changes in AAOD seem to be mainly driven by changes in dust burden, which decreases by −6% and is obviously dependent on the dust emission modifications.
4.2.2. Deposition
The aerosol column burden, as an important factor for controlling the total absorption by aerosols, is constrained by deposition. However, decreasing the efficiency of BC below-cloud wet removal by a factor of two (BCscav_lower), leads only to small changes in AAOD of +1% on average (–6% to +9%) in the focus area (not shown). This low response is reasonable since the total BC deposition decreases by less than −1% and only a small change in BC column burden of +1% occurs. The underestimated AAOD found in the control simulation over polluted areas is related to low BC emissions and burden, and reducing the below-cloud wet removal of BC is insufficient in the model for improving the AAOD representation in the focus region.
Similarly, a higher efficiency for dust below-cloud wet removal and dry deposition (DUscav_higher and DUdrydep_increased) results only in negligible changes in AAOD (–1%) on average (globally and regionally), which varies between −6% and +4% in the focus region (not shown). The change in dust dry deposition is below 1% and the dust column burden decreases only by 1%. The below-cloud wet removal and dry deposition of dust is insufficient for reducing the overestimated AAOD over arid and dust-dominated regions, found for the model in section 4.1.1. Deposition is linearly dependent on emissions in CAM5.3-Oslo and hence higher emissions lead to an increased deposition. The model seems to be less susceptible to the changed deposition parameters in this sensitivity category and a negligible change in AAOD was found.
4.2.3. Meteorology
To test the influence of meteorological conditions on aerosol absorption, we use first another reanalysis data set for the nudging approach and second a non-nudged AMIP-type. We use the newer reanalysis ERA5 to assimilate wind and pressure fields in the model, instead of the default configuration with ERA-interim reanalysis (experiment ERA5). In response to this, the AAOD shows a decrease by only −1% on regional average, but the AAOD change can vary thereby between −21% and 25% within the focus domain (see ). Focusing on the regional distribution of AAOD changes, the absorption over e.g. Northern India, where the model underestimates absorption compared to reanalysis and observations in general, does not improve but rather decreases even further. Also, the found AAOD overestimation over the Arabian peninsula seems to increase even more with the use of the ERA5 reanalysis.
Moreover, we performed a simulation with CAM5.3-Oslo in a non-nudged configuration. The regional mean AAOD is decreased by −18.5% in the AMIP experiment compared to the control simulation. Differences in aerosol absorption between the two model simulations can be driven by changes in meteorology due to the assimilation of wind and pressure and subsequent transport processes, wind-driven aerosol emissions, and deposition, in addition to the difference in model resolution that may affect all these processes. A lower AAOD in the AMIP simulation over polluted areas in the focus region is consistent with a shorter residence time and lower burden of BC and OA, by −6% and −8%, respectively (see ). In the dust-dominated western part of the studied domain (see ), a lower absorption compared to the control simulation is consistent with the weaker wind-driven dust emissions and decreased residence time and column burden of dust. This seems also to be the main reason why the global radiative effect is with +1.53 W m−2 strongly positive.
Hence, the nudging of horizontal winds and surface pressure to observed meteorology as in the control simulation leads to improved model representation of aerosol absorption over the polluted areas in the domain, as opposed to the dust-dominated areas where the model overestimate of absorption is larger in the nudged version, most likely due to high dust emissions. Also, a too strong prescribed dust absorptivity in the model can lead to an overestimation in AAOD compared to observations.
4.2.4. Optical properties
, f and g illustrate the changes in AAOD due to altered aerosol optical properties. In , the effect of prescribing fully absorbing BC (BCrefrac_1.0) is displayed. BC is already in the default model configuration strongly absorbing compared to other state-of-the-art climate models, with an imaginary part of the refractive index of 0.79 (see ). The AAOD increases by only +11% on average in the focus region, although the BC absorptivity is saturated in this experiment. Changes in AAOD are here solely caused by the increased absorption ability which leads to a global radiative effect of +0.05 W m−2.
Increasing the absorptivity of OA by choosing the same prescribed refractive index as used in MERRA, leads to a regional mean increase in AAOD of 4.6%, see with changes of up to +23% in South East Asia.
A decreased refractive index of dust at 550 nm (DUrefrac_MERRA) yields the second lowest averaged AAOD and a relative high mean decrease by −16.7% in the focus domain (). The model shows an improvement of the AAOD representation especially over the desert and arid areas with a maximal decrease of −46%.
Overall, the model response to changes in BC and OA optical properties is smaller compared to the effects of a strong emission increase as in the CMIP6_transient experiment. On the other hand, a high negative response of AAOD to changes in dust refractive index was found since mineral dust is dominating the absorbing aerosol burden.
Accordingly, a closing simulation (Combined) was performed with a combination of the experiments that led to the strongest response, namely CMIP6_transient, ERA5 and DUrefrac_MERRA (see ). The result of a combined simulation seems to improve the spatial distribution of AAOD exactly in the correct regions with a decreasing AAOD over desert areas of up to −84% and an increase in AAOD over the IGP and East Asia by a maximum of 103%. On average the AAOD increases only by 3% in the region. These changes would lead to a global negative radiative effect of −0.01 W m−2.
To summarise AAOD changes in the sensitivity experiments compared to the control simulation, the other AeroCom phase III models as well as MERRA-2, shows the regional mean AAOD and also illustrates subregional variability by showing a selection of three additional smaller subregions.
4.2.5. Seasonal cycle
Since the AeroCom model and sensitivity experiment results are given for 2010, shows the seasonal cycle of AAOD only for the year 2010, comparing thereby AeroCom models, the sensitivity experiments and MERRA-2 with the AERONET retrievals at selected stations. The range of AAOD changes (maximum and minimum) due to changes in the sensitivity experiments (described in section 4.2) is indicated and referred to as inter-experiment diversity (blue shading). The results of the AMIP simulation are thereby displayed separately from the other sensitivity experiments since this is the only non-nudged simulation.
First, the inter-model diversity in terms of the absorption strength at the different stations reflects the findings in section 4.1.2 and shows a distinction for model performances between dust-dominated and polluted areas within the focus domain (see ). The overestimation in AADO in CAM5.3-Oslo is still evident at the two dust-dominated stations Solar Village and Karachi (see ) in comparison to the other AeroCom models and AERONET. For the other four stations, CAM5.3-Oslo and the range of its sensitivity experiments is often lower compared to the other AeroCom models. However, the AAOD magnitude and temporal evolution of CAM5.3-Oslo shows a reasonably good agreement with the AERONET observations at the urban stations Kanpur and Bejing, while HadGEM shows a strong overestimation in AAOD at these stations (see ). None of the AeroCom models seem to represent the high AAOD at the Pokhara station (see ) during winter and the pre-monsoon season (January to May) which might be connected to the complex topography not being resolved in the models. The GEOS models reproduce the high AAOD during the biomass burning season in Chiang Mai much better than CAM5.3-Oslo (see ) although not sufficient if compared to AERONET retrievals. HadGEM performs well for this location even though the model does not consider OA as absorbing at all. To disentangle the BC and OA absorption in the model, the absorption at shorter wavelengths would be required.
Focusing on the seasonal cycle for the AeroCom models during the year 2010 in , it becomes clear that besides the absorption strength, there is poor agreement among the models. The models differ in their aerosol emissions as well as assimilation fields. CAM5.3-Oslo uses aerosol emissions of the year 2000 while the two GEOS models and HadGEM use emissions for the given year 2010. CAM5.3-Oslo and HadGEM are nudged to the ERA-interim reanalysis compared to the GEOS models which are nudged to MERRA-2. The seasonal cycle of AAOD in CAM5.3-Oslo does not change in the sensitivity experiments and seems to be preserved. Only the experiment ERA5 which uses different meteorological assimilation fields, is able to change the seasonal cycle slightly (not shown). The substantial change in temporal evolution from AMIP to the other CAM5.3-Oslo simulations indicates best that the seasonal cycle is bound to the driving meteorology. The seasonal cycle does not seem to be influenced by the changes made in the other chosen sensitivity experiments.
It is evident that the large inter-model spread is often well beyond the inter-experiment diversity of CAM5.3-Oslo, which highlights that basic physical processes in the models such as transport and deposition, possibly also cloud processes and precipitation, are causing a large model spread rather than aerosol emissions or optical properties.
However, we emphasise again that the largest inter-experiment diversity is often reached with emission changes just as discussed in sections 4.2.1 to 4.2.4. The strongest increase in AAOD for the urban stations Kanpur and Beijing as seen as the maximum of the blue shaded area in and b are achieved for the CMIP6_transient simulation which reduces the discrepancy to the AERONET observations to only −18% at Kanpur and even to full agreement on average at Beijing. For the dust-dominated station Solar Village, the best agreement with the observations is obtained with the change to the MERRA-2 refractive index (DUrefrac_MERRA) (see ). This points out that the correct parameterisation of dust absorptivity in the model plays a crucial role for the total aerosol absorption. On the other hand, the general AAOD underestimation at the station Chiang Mai (see ) is even enhanced for the CMIP6_PD experiment (–63%) due to a significant decrease in BC and OA burden. Here, the optical experiment with fully absorbing BC yields the highest AAOD in the peak season.
5. Conclusions
In this study, we evaluate the representation of aerosol absorption in the climate model CAM5.3-Oslo in its original configuration and set-up (AMIP type with CMIP5 emissions for year 2000) as described by Kirkevåg et al. (2018). A large spatial variability was found within the studied region, which covers large parts of Asia, with a distinction between polluted and dust-dominated areas. The model underestimates total aerosol absorption over polluted regions, dominated by BC and organic aerosols, compared to AERONET observations and MERRA-2 reanalysis, while an overestimation occurs over dust-dominated areas. Relatively low BC emissions and a short residence time of BC lead to a low BC burden and the coherent underestimation of aerosol absorption in urban areas. Too high wind-driven dust emissions in a nudged simulation are efficient in increasing the column burden and residence time of dust and subsequently leading to an overestimation in AAOD, which is in agreement with Kirkevåg et al. (2018). A comparison between a nudged and AMIP-type model configuration highlights the influence of meteorological variation on aerosol absorption, due to its influence on transport and removal processes as well as wind-driven emissions.
A significant model spread is found for a subset of four AeroCom phase III models. Main differences between the modelled AAOD are related to aerosol residence time and column burden of absorbing aerosols (BC, OA, dust), which reflects in turn differences in transport and deposition processes. Optical properties of BC and OA were found to be of less importance, whereas the absorptivity of dust seems to be crucial for the absorption by aerosols over desert and arid areas.
We performed further sensitivity simulations with CAM5.3-Oslo targeting both the physical processes of aerosol emissions, meteorological conditions and deposition, and variations in optical characteristics of aerosols, to mimic the effects of various observed ageing processes on the aerosol absorption. Changes in aerosol absorption between the sensitivity simulations are mainly driven by changes in the BC column burden. Aerosol emissions are thereby important to capture the magnitude of aerosol absorption on the regional scale and both an updated emission data set and transient emissions (i.e. emissions not fixed to a specific year) yield an improved agreement with AERONET observations of aerosol absorption. Changes in optical properties of absorbing aerosols, such as e.g. a saturated BC absorptivity in the model, are well beyond the inter-model differences in prescribed optical characteristics, and lead to mean changes in AAOD of 10%. However, we found that adapting the refractive index of mineral dust leads to a significant response in CAM5.3-Oslo. Changes in emissions and meteorology corresponding merely to updates in emission inventories and driving reanalysis data lead to mean changes of up to 20%. Thus, the representation of fundamental processes like air mass transport and particle deposition in the model are very important and can be readily addressed. To emphasise this further, we found that the inter-model spread in AAOD and also aerosol residence time is much larger than the changes among the various sensitivity experiments. Hence, our results reveal that for purposes of improving the representation of absorbing aerosols in global models, it is advisable to prioritise improved emission inventories, and processes affecting the aerosol residence time and amount, before refined parameterisations of complex aerosol properties and microphysical processes.
Acknowledgements
Model simulations, data post-processing and data analysis of model output were performed on resources provided by the Swedish National Infrastructure for Computing (SNIC) at the National Supercomputer Centre at Linköping University (NSC). The authors acknowledge furthermore the open database AERONET (https://aeronet.gsfc.nasa.gov/) for providing remote sensing measurements of aerosol physical properties. We are also grateful for the openly available data sets from the satellite based MODIS instrument as well as the MERRA-2 model output. We would further like to acknowledge the NASA Goddard Space Flight Center, the Met Office Hadley Centre, the Norwegian Institute of Meteorology and the University of Oslo for providing model output of the AeroCom phase III control experiment. We would like to thank Inger Helene H. Karset from the University of Oslo for providing ERA-Interim data used for the nudging of CAM5.3-Oslo and Dirk Olivié from the Norwegian Meteorological Institute for providing the CMIP6 emission data set. Further, we would like to thank Annica Ekman and Dirk Olivié for valuable input during the writing process. We would like to acknowledge the Swedish Research Council (Vetenskapsrådet), DNR 2018-04274.
Disclosure statement
The authors declare that they have no conflict of interest.
Data availability statement
Data produced with model simulations using the model CAM5.3-Oslo is available from the corresponding author upon request. Observational data from AERONET and MODIS as well as the MERRA-2 reanalysis is openly available. AeroCom model output is available via the AeroCom archive.
Additional information
Funding
References
- Albrecht, B. A. 1989. Aerosols, cloud microphysics, and fractional cloudiness. Science 245, 1227–1230. doi:https://doi.org/10.1126/science.245.4923.1227
- Andrews, E., Ogren, J. A., Kinne, S. and Samset, B. 2017. Comparison of AOD, AAOD and column single scattering albedo from AERONET retrievals and in situ profiling measurements. Atmos. Chem. Phys. 17, 6041–6072. 2017. doi:https://doi.org/10.5194/acp-17-6041-2017
- Bellouin, N., Quaas, J., Gryspeerdt, E., Kinne, S., Stier, P. and co-authors. 2020. Bounding global aerosol radiative forcing of climate change. Rev. Geophys. 58, e2019RG000660.,
- Bond, T. C. and Bergstrom, R. W. 2006. Light absorption by carbonaceous particles: An investigative review. Aerosol Sci. Technol. 40, 27–67. doi:https://doi.org/10.1080/02786820500421521
- Bond, T. C., Doherty, S. J., Fahey, D. W., Forster, P. M., Berntsen, T. and co-authors. 2013. Bounding the role of black carbon in the climate system: A scientific assessment. J. Geophys. Res. Atmos. 118, 5380–5552. doi:https://doi.org/10.1002/jgrd.50171
- Boucher, O., Balkanski, Y., Hodnebrog, Ø., Myhre, C. L., Myhre, G. and co-authors. 2016. Jury is still out on the radiative forcing by black carbon. Proc. Natl. Acad. Sci. U S A. 113, E5092–E5093. doi:https://doi.org/10.1073/pnas.1607005113
- Boucher, O., Randall, D., Artaxo, P., Bretherton, C., Feingold, G. and co-authors. 2013. Clouds and aerosols. In: Climate Change 2013: Physical Science Basis. Contribution of Working Group I to Fifth Assessment Report of the Intergovernmental Panel on Climate Change, Cambridge University Press, Cambridge, United Kingdom and New York, NY, USA.
- Brown, H., Liu, X., Feng, Y., Jiang, Y., Wu, M. and co-authors. 2018. Radiative effect and climate impacts of brown carbon with the Community Atmosphere Model (CAM5). Atmos. Chem. Phys. 18, 17745–17768. doi:https://doi.org/10.5194/acp-18-17745-2018
- Buchard, V., Randles, C. A., da Silva, A. M., Darmenov, A., Colarco, P. R. and co-authors. 2017. The MERRA-2 aerosol reanalysis, 1980 onward. Part II: Evaluation and case studies. J. Clim. 30, 6851–6872. doi:https://doi.org/10.1175/JCLI-D-16-0613.1
- Chung, C. E., Ramanathan, V. and Decremer, D. 2012. Observationally constrained estimates of carbonaceous aerosol radiative forcing. Proc. Natl. Acad. Sci. U S A 109, 11624–11629. doi:https://doi.org/10.1073/pnas.1203707109
- Colarco, P., da Silva, A., Chin, M. and Diehl, T. 2010. Online simulations of global aerosol distributions in the NASA GEOS-4 model and comparisons to satellite and ground-based aerosol optical depth. J. Geophys. Res. 115, D14207. doi:https://doi.org/10.1029/2009JD012820
- Dalirian, M., Ylisirniö, A., Buchholz, A., Schlesinger, D., Ström, J. and co-authors. 2018. Cloud droplet activation of black carbon particles coated with organic compounds of varying solubility. Atmos. Chem. Phys. 18, 12477–12489. doi:https://doi.org/10.5194/acp-18-12477-2018
- Dasari, S., Andersson, A., Bikkina, S., Holmstrand, H., Budhavant, K. and co-authors. 2019. Photochemical degradation affects the light absorption of water-soluble brown carbon in the South Asian outflow. Sci. Adv. 5, eaau8066. doi:https://doi.org/10.1126/sciadv.aau8066
- Dentener, F., Kinne, S., Bond, T., Boucher, O., Cofala, J. and co-authors. 2006. Emissions of primary aerosol and precursor gases in the years 2000 and 1750 prescribed data-sets for AeroCom. Atmos. Chem. Phys. 6, 4321–4344. doi:https://doi.org/10.5194/acp-6-4321-2006
- Eck, T. F., Holben, B. N., Sinyuk, A., Pinker, R. T., Goloub, P. and co-authors. 2010. Climatological aspects of the optical properties of fine/coarse mode aerosol mixtures. J. Geophys. Res. 115, D19205. doi:https://doi.org/10.1029/2010JD014002
- Forrister, H., Liu, J., Scheuer, E., Dibb, J., Ziemba, L. and co-authors. 2015. Evolution of brown carbon in wildfire plumes. Geophys. Res. Lett. 42, 4623–4630. doi:https://doi.org/10.1002/2015GL063897
- Gautam, R., Hsu, N. C., Eck, T. F., Holben, B. N., Janjai, S. and co-authors. 2013. Characterization of aerosols over the Indochina peninsula from satellite-surface observations during biomass burning pre-monsoon season. Atmos. Environ. 78, 51–59. doi:https://doi.org/10.1016/j.atmosenv.2012.05.038
- Gelaro, R., McCarty, W., Suárez, M. J., Todling, R., Molod, A. and co-authors. 2017. The modern-era retrospective analysis for research and applications, version 2 (MERRA-2). J. Clim. 30, 5419–5454. doi:https://doi.org/10.1175/JCLI-D-16-0758.1
- Giles, D. M., Sinyuk, A., Sorokin, M. G., Schafer, J. S., Smirnov, A. and co-authors. 2019. Advancements in the Aerosol Robotic Network (AERONET) version 3 database – automated near-real-time quality control algorithm with improved cloud screening for Sun photometer aerosol optical depth (AOD) measurements. Atmos. Meas. Tech. 12, 169–209. doi:https://doi.org/10.5194/amt-12-169-2019
- Gliß, J., Mortier, A., Schulz, M., Andrews, E., Balkanski, Y. and co-authors. 2021. AeroCom phase III multi-model evaluation of the aerosol life cycle and optical properties using ground- and space-based remote sensing as well as surface in situ observations. Atmos. Chem. Phys. 21, 87–128. doi:https://doi.org/10.5194/acp-21-87-2021
- Gustafsson, Ö. and Ramanathan, V. 2016. Convergence on climate warming by black carbon aerosols. Proc. Natl. Acad. Sci. U S A 113, 4243–4245. doi:https://doi.org/10.1073/pnas.1603570113
- Gustafsson, Ö., Kruså, M., Zencak, Z., Sheesley, R. J., Granat, L. and co-authors. 2009. Brown clouds over South Asia: Biomass or fossil fuel combustion? Science 323, 495–498. doi:https://doi.org/10.1126/science.1164857
- Hodnebrog, Ø., Myhre, G., and Samset, B. H. 2014. How shorter black carbon lifetime alters its climate effect. Nat. Commun. 5, 5065. doi:https://doi.org/10.1038/ncomms6065
- Hoesly, R. M., Smith, S. J., Feng, L., Klimont, Z., Janssens-Maenhout, G. and co-authors. 2018. Historical (1750–2014) anthropogenic emissions of reactive gases and aerosols from the Community Emissions Data System (CEDS). Geosci. Model Dev. 11, 369–408. doi:https://doi.org/10.5194/gmd-11-369-2018
- Holben, B. N., Eck, T. F., Slutsker, I., Tanre, D.P., B. J., Setzer. and co-authors. 1998. A federated instrument network and data archive for aerosol characterization. Remote Sens. Environ. 66, 1–16. doi:https://doi.org/10.1016/S0034-4257(98)00031-5
- Kirkevåg, A., Grini, A., Olivié, D., Seland, Ø., Alterskjaer, K. and co-authors. 2018. A production-tagged aerosol module for Earth system models. Geosci. Model Dev. 11, 3945–3982. doi:https://doi.org/10.5194/gmd-11-3945-2018
- Kirkevåg, A., Iversen, T., Seland, Ø., Debernard, J. B., Storelvmo, T. and co-authors. 2008. Aerosol-cloud-climate interactions in the climate model CAM-Oslo. Tellus A 60, 492–512. doi:https://doi.org/10.1111/j.1600-0870.2007.00313.x
- Klingmüller, K., Steil, B., Brühl, C., Tost, H. and Lelieveld, J. 2014. Sensitivity of aerosol radiative effects to different mixing assumptions in the AEROPT 1.0 submodel of the EMAC atmospheric-chemistry–climate model. Geosci. Model Dev. 7, 2503–2516. doi:https://doi.org/10.5194/gmd-7-2503-2014
- Koch, D. and Del Genio, A. D. 2010. Black carbon semi-direct effects on cloud cover: Review and synthesis. Atmos. Chem. Phys. 10, 7685–7696. doi:https://doi.org/10.5194/acp-10-7685-2010
- Kok, J. F., Ridley, D. A., Zhou, Q., Miller, R. L., Zhao, C. and co-authors. 2017. Integrative analysis of desert dust size and abundance suggests less dust climate cooling. Nat. Geosci. 10, 274–278. doi:https://doi.org/10.1038/ngeo2912
- Liu, X., Ma, P.-L., Wang, H., Tilmes, S., Singh, B. and co-authors. 2016. Description and evaluation of a new four-mode version of the Modal Aerosol Module (MAM4) within version 5.3 of the Community Atmosphere Model. Geosci. Model Dev. 9, 505–522. doi:https://doi.org/10.5194/gmd-9-505-2016
- Lund, M. T., Samset, B. H., Skeie, R. B., Watson-Parris, D., Katich, J. M. and co-authors. 2018. Short black carbon lifetime inferred from a global set of aircraft observations. Nat. pj Clim. Atmos. Sci. 1, 2397–3722.
- Makkonen, R., Seland, Ø., Kirkevåg, A., Iversen, T. and Kristjánsson, J. E. 2014. Evaluation of aerosol number concentrations in NorESM with improved nucleation parameterization. Atmos. Chem. Phys. 14, 5127–5152. doi:https://doi.org/10.5194/acp-14-5127-2014
- Mann, G. W., Carslaw, K. S., Spracklen, D. V., Ridley, D. A., Manktelow, P. T. and co-authors. 2010. Description and evaluation of GLOMAP-mode: a modal global aerosol microphysics model for the UKCA composition-climate model. Geosci. Model Dev. 3, 519–551. doi:https://doi.org/10.5194/gmd-3-519-2010
- Mollard, J. 2018. Improving the simulation of carbonaceous aerosol in HadGEM3-UKCA, PhD thesis, University of Reading.
- Molod, A., Takacs, L., Suarez, M. and Bacmeister, J. 2015. Development of the GEOS-5 atmospheric general circulation model: evolution from MERRA to MERRA2. Geosci. Model Dev. 8, 1339–1356. doi:https://doi.org/10.5194/gmd-8-1339-2015
- Myhre, G., Shindell, D., Bréon, F.-M., Collins, W., Fuglestvedt, J. and co-authors. 2013. Anthropogenic and natural radiative forcing, In: Climate Change 2013: Physical Science Basis. Contribution of Working Group I to Fifth Assessment Report of the Intergovernmental Panel on Climate Change, Cambridge University Press, pp. 658–740.
- Nakayama, T., Ikeda, Y., Sawada, Y., Setoguchi, Y., Ogawa, S. and co-authors. 2014. Properties of light-absorbing aerosols in the Nagoya urban area, Japan, in August 2011 and January 2012: Contributions of brown carbon and lensing effect. J. Geophys. Res. Atmos. 119, 12,721–12,739. doi:https://doi.org/10.1002/2014JD021744
- Neale, R. B., Chen, C.-C., Gettelman, A., Lauritzen, P. H., Park, S. and co-authors. 2012. Description of the NCAR Community Atmosphere Model (CAM 5.0), NCAR Tech. Note NCAR-TN-486CSTR.
- Pan, X., Chin, M., Gautam, R., Bian, H., Kim, D. and co-authors. 2015. A multi-model evaluation of aerosols over South Asia: Common problems and possible causes. Atmos. Chem. Phys. 15, 5903–5928. doi:https://doi.org/10.5194/acp-15-5903-2015
- Peng, J., Hu, M., Guo, S., Zheng, J., Shang, D. and co-authors. 2016. Markedly enhanced absorption and direct radiative forcing of black carbon under polluted urban environments. Proc Natl Acad Sci U S A. 113, 4266–4271. doi:https://doi.org/10.1073/pnas.1602310113
- Petzold, A., Rasp, K., Weinzierl, B., Esselborn, M., Hamburger, T. and co-authors. 2009. Saharan dust absorption and refractive index from aircraft-based observations during SAMUM 2006. Tellus B 61, 118–130. doi:https://doi.org/10.1111/j.1600-0889.2008.00383.x
- Platnick, S., Hubanks, P., Meyer, K. and King, M. D. 2015. MODIS Atmosphere L3 Monthly Product. NASA MODIS Adaptive Processing System, Technical Report, Goddard Space Flight Center, USA.
- Ramana, M. V., and Ramanathan, V. 2006. Abrupt transition from natural to anthropogenic aerosol radiative forcing: Observations at the ABC-Maldives Climate Observatory. J. Geophys. Res. 111, D20207. doi:https://doi.org/10.1029/2006JD007063
- Ramanathan, V. and Carmichael, G. 2008. Global and regional climate changes due to black carbon. Nat. Geosci. 1, 221–227. doi:https://doi.org/10.1038/ngeo156
- Randles, C. A., da Silva, A. M., Buchard, V., Colarco, P. R., Darmenov, A. and co-authors. 2017. The MERRA-2 Aerosol Reanalysis, 1980 - onward, Part I: System description and data assimilation evaluation. J. Clim. 30, 6823–6850. doi:https://doi.org/10.1175/JCLI-D-16-0609.1
- Remer, L. A., Kaufman, Y. J., Tanré, D., Mattoo, S., Chu, D. A. and co-authors. 2005. The MODIS aerosol algorithm, products, and validation. J. Atmos. Sci. 62, 947–973. doi:https://doi.org/10.1175/JAS3385.1
- Saleh, R., Marks, M., Heo, J., Adams, P. J., Donahue, N. M. and Robinson, A. L. 2015. Contribution of brown carbon and lensing to the direct radiative effect of carbonaceous aerosols from biomass and biofuel burning emissions. J. Geophys. Res. 120, 10285–10296.
- Saleh, R., Robinson, E. S., Tkacik, D. S., Ahern, A. T., Liu, S. and co-authors. 2014. Brownness of organics in aerosols from biomass burning linked to their black carbon content. Nat. Geosci. 7, 647–650. doi:https://doi.org/10.1038/ngeo2220
- Salter, M. E., Zieger, P., Acosta Navarro, J. C., Grythe, H., Kirkevåg, A. and co-authors. 2015. An empirically derived inorganic sea spray source function incorporating sea surface temperature. Atmos. Chem. Phys. 15, 11047–11066. doi:https://doi.org/10.5194/acp-15-11047-2015
- Samset, B. H., Stjern, C. W., Andrews, E., Kahn, R. A., Myhre, G. and co-authors. 2018. Aerosol absorption: Progress towards global and regional constraints. Curr. Clim. Change Rep. 4, 65–83. doi:https://doi.org/10.1007/s40641-018-0091-4
- Schutgens, N. A. J., Gryspeerdt, E., Weigum, N., Tsyro, S., Goto, D. and co-authors. 2016. Will a perfect model agree with perfect observations? The impact of spatial sampling. Atmos. Chem. Phys. 16, 6335–6353.
- Schutgens, N. A. J., Tsyro, S., Gryspeerdt, E., Goto, D., Weigum, N. and co-authors. 2017. On the spatio-temporal representativeness of observations. Atmos. Chem. Phys. 17, 9761–9780. doi:https://doi.org/10.5194/acp-17-9761-2017
- Sessions, W. R., Reid, J. S., Benedetti, A., Colarco, P. R., da Silva, A. and co-authors. 2015. Development towards a global operational aerosol consensus: Basic climatological characteristics of the International Cooperative for Aerosol Prediction Multi-Model Ensemble (ICAP-MME). Atmos. Chem. Phys. 15, 335–362. doi:https://doi.org/10.5194/acp-15-335-2015
- Shindell, D. T., Lamarque, J.-F., Schulz, M., Flanner, M., Jiao, C. and co-authors. 2013. Radiative forcing in the ACCMIP historical and future climate simulations. Atmos. Chem. Phys. 13, 2939–2974. doi:https://doi.org/10.5194/acp-13-2939-2013
- Singh, A., Mahata, K. S., Rupakheti, M., Junkermann, W., Panday, A. K. and co-authors. 2019. An overview of airborne measurement in Nepal – Part 1: Vertical profile of aerosol size, number, spectral absorption, and meteorology. Atmos. Chem. Phys. 19, 245–258. doi:https://doi.org/10.5194/acp-19-245-2019
- Textor, C., Schulz, M., Guibert, S., Kinne, S., Balkanski, Y. and co-authors. 2007. The effect of harmonized emissions on aerosol properties in global models – An AeroCom experiment. Atmos. Chem. Phys. 7, 4489–4501. doi:https://doi.org/10.5194/acp-7-4489-2007
- Tsigaridis, K. and Kanakidou, M. 2018. The present and future of secondary organic aerosol direct forcing on climate. Curr. Clim. Change Rep. 4, 84–98. doi:https://doi.org/10.1007/s40641-018-0092-3
- Twomey, S. 1977. The influence of pollution on the shortwave Albedo of clouds. J. Atmos. Sci. 34, 1149–1152. doi:https://doi.org/10.1175/1520-0469(1977)034<1149:TIOPOT>2.0.CO;2
- van der Werf, G. R., Randerson, J. T., Giglio, L., Collatz, G. J., Mu, M. and co-authors. 2010. Global fire emissions and the contribution of deforestation, savanna, forest, agricultural, and peat fires (1997–2009. Atmos. Chem. Phys. 10, 11707–11735. doi:https://doi.org/10.5194/acp-10-11707-2010
- van der Werf, G. R., Randerson, J. T., Giglio, L., van Leeuwen, T. T., Chen, Y. and co-authors. 2017. Global fire emissions estimates during 1997–2016. Earth Syst. Sci. Data 9, 697–720. doi:https://doi.org/10.5194/essd-9-697-2017
- van Marle, M. J. E., Kloster, S., Magi, B. I., Marlon, J. R., Daniau, A.-L. and co-authors. 2017. Historic global biomass burning emissions for CMIP6 (BB4CMIP) based on merging satellite observations with proxies and fire models (1750–2015). Geosci. Model Dev. 10, 3329–3357. doi:https://doi.org/10.5194/gmd-10-3329-2017
- Veselovskii, I., Goloub, P., Podvin, T., Tanre, D., da Silva, A. and co-authors. 2018. Characterization of smoke and dust episode over West Africa: Comparison of MERRA-2 modeling with multiwavelength Mie-Raman lidar observations. Atmos. Meas. Technol. 11, 949–969. doi:https://doi.org/10.5194/amt-11-949-2018
- Wang, Q., Saturno, J., Chi, X., Walter, D., Lavric, J. V. and co-authors. 2016a. Modeling investigation of light-absorbing aerosols in the Amazon Basin during the wet season. Atmos. Chem. Phys. 16, 14775–14794. doi:https://doi.org/10.5194/acp-16-14775-2016
- Wang, R., Balkanski, Y., Boucher, O., Ciais, P., Schuster, G. L. and co-authors. 2016b. Estimation of global black carbon direct radiative forcing and its uncertainty constrained by observations. J. Geophys. Res. Atmos. 121, 5948–5971. doi:https://doi.org/10.1002/2015JD024326
- Wilcox, E. M. 2010. Stratocumulus cloud thickening beneath layers of absorbing smoke aerosol. Atmos. Chem. Phys. 10, 11769–11777. doi:https://doi.org/10.5194/acp-10-11769-2010
- Wilcox, E. M., Thomas, R. M., Praveen, P. S., Pistone, K., Bender, F. A.-M. and co-authors. 2016. Black carbon solar absorption suppresses turbulence in the atmospheric boundary layer. Proc. Natl. Acad. Sci. U S A. 113, 11794–11799. doi:https://doi.org/10.1073/pnas.1525746113
- Williams, K. D., Copsey, D., Blockley, E. W., Bodas-Salcedo, A., Calvert, D. and co-authors. 2018. The Met Office Global Coupled Model 3.0 and 3.1 (GC3.0 and GC3.1) configurations. J. Adv. Model. Earth Syst. 10, 357–380. doi:https://doi.org/10.1002/2017MS001115
- Wittbom, C., Eriksson, A. C., Rissler, J., Carlsson, J. E., Roldin, P. and co-authors. 2014. Cloud droplet activity changes of soot aerosol upon smog chamber ageing. Atmos. Chem. Phys. 14, 9831–9854. doi:https://doi.org/10.5194/acp-14-9831-2014
- Zender, C. S., Bian, H. and Newman, D. 2003. Mineral Dust Entrainment and Deposition (DEAD) model: Description and 1990s dust climatology. J. Geophys. Res. 108, 4416. doi:https://doi.org/10.1029/2002JD002775.
- Zhang, K., Wan, H., Liu, X., Ghan, S. J., Kooperman, G. J. and co-authors. 2014. Technical note: On the use of nudging for aerosol–climate model intercomparison studies. Atmos. Chem. Phys. 14, 8631–8645. doi:https://doi.org/10.5194/acp-14-8631-2014
- Zhao, R., Lee, A. K. Y., Huang, L., Li, X., Yang, F. and co-authors. 2015. Photochemical processing of aqueous atmospheric brown carbon. Atmos. Chem. Phys. 15, 6087–6100. doi:https://doi.org/10.5194/acp-15-6087-2015
- Zhong, M. and Jang, M. 2014. Dynamic light absorption of biomass-burning organic carbon photochemically aged under natural sunlight. Atmos. Chem. Phys. 14, 1517–1525.