
Abstract
The provision of information to consumers is a common input to tackling various public health issues. By comparison to the information given on food and alcohol products, information on gambling products is either not given at all, or shown in low-prominence locations in a suboptimal format, e.g. the ‘return-to-player’ format, ‘this game has an average percentage payout of 90%’. Some previous research suggests that it would be advantageous to communicate this information via the ‘house edge’ format instead: the average loss from a given gambling product, e.g. ‘this game keeps 10% of all money bet on average’. However, previous empirical work on the house edge format only uses this specific phrasing, and there may be better ways of communicating house edge information. The present work experimentally tested this original phrasing of the house edge against an alternative phrasing that has also been proposed, ‘on average this game is programmed to cost you 10% of your stake on each bet’, while both phrasings were also compared against equivalent return-to-player information (N = 3333 UK-based online gamblers). The two dependent measures were gamblers’ perceived chances of winning and a measure of participants’ correct understanding. Preregistered Stage 1 protocol: https://osf.io/5npy9 (date of in-principle acceptance: 28/11/2022). The alternative house edge phrasing resulted in the lowest perceived chances of winning, but the original phrasing had the highest rate of correct understanding. Compared to return-to-player information, the original phrasing had both lower perceived chances of winning and higher rates of correct understanding, while the alternative phrasing had only lower perceived chances of winning. These results replicated prior work on the advantages of the original house edge phrasing over return-to-player information, while showing that the alternative house edge phrasing has advantageous properties for gamblers’ perceived chances of winning only. The optimal communication of risk information can act as an input to a public health approach to reducing gambling-related harm.
The provision of information to consumers is a common input to tackling various public health issues. For example, prominent nutrition and calorie labels on food products can beneficially shift consumer behavior (Bleich et al. Citation2017; Dubois et al. Citation2021), as can information about the alcohol content of alcohol products (Blackwell et al. Citation2018; Hobin et al. Citation2018). Gambling is another public health issue where related proposals have been made (Eggert Citation2004; Livingstone et al. Citation2019; Newall et al. Citation2023). However, by comparison, gambling information can be criticized on the grounds of a lack of prominence, and suboptimalities with which it is communicated (Newall, Walasek, et al. Citation2022). This Registered Report contributes to this second issue, by experimentally comparing two equivalent alternatives to some relevant information that is currently given on many gambling products.
One of the most relevant pieces of information about a gambling product is the amount of money that a gambler might expect to lose over time (Harrigan and Dixon Citation2010; Woolley et al. Citation2013). As gambling products are programmed to only pay-out a percentage of all money bet on average, this amount is typically communicated as a percentage. When this information is communicated to gamblers, it is typically shown via what is called the ‘return-to-player’ format, e.g. ‘This game has an average percentage payout of 90%’ (Collins et al. Citation2014). This example of 90% means that for every £100 bet, an average of £90 will be paid-out as winnings, for a net loss of £10, and this figure of 90% is roughly representative of the average payouts of electronic gambling machines internationally (Harrigan and Dixon Citation2009; Schwartz Citation2013; Woolley et al. Citation2013). However, previous research suggests that the return-to-player is misunderstood by most gamblers (Collins et al. Citation2014; Harrigan et al. Citation2017; Beresford and Blaszczynski Citation2020). Contrastingly, there are advantages to flipping the percentages, by instead focusing on the average loss via the ‘house edge’ format, e.g. ‘This game keeps 10% of all money bet on average’. A return-to-player of 90% and a house edge of 10% are therefore statistically equivalent. However, it has been shown that in comparison to the return-to-player, that the house edge format is understood better by gamblers (Newall, Walasek, and Ludvig Citation2020a, Citation2020b), results in lower perceived chances of winning (Newall, Walasek, Ludvig, et al. Citation2020; Newall, Walasek, and Ludvig Citation2020a, Citation2020b; Newall et al. Citation2023), and also translates into reductions in gambling behavior (Newall, Byrne, et al. Citation2022). Overall, this research demonstrates several advantages of the house edge format over the equivalent return-to-player format that is currently used on some products in certain jurisdictions (Collins et al. Citation2014; Beresford and Blaszczynski Citation2020; Newall, Walasek, et al. Citation2022).
One limitation of this literature is that previous experimental research on the house edge format uses the same way of phrasing this information. This issue is important, as at least one alternative phrasing has been proposed: ‘on average this game is programmed to cost you [10]% of your stake on each bet’ (Livingstone et al. Citation2019; p.3). This phrasing is longer, at 16 words compared to nine words, and contains additional words which might either increase the perceived severity of the resulting average gambling losses, or improve gamblers’ comprehension of this information. Previous work suggests that added explanation can alter how gamblers evaluate this information. For example, the addition of a 32-word ‘volatility warning’ significantly decreased gamblers’ perceived chances of winning with both return-to-player and house edge information (Newall, Walasek, and Ludvig Citation2020b). In order to maximize the present research’s usefulness to policymakers, an experimental comparison will therefore be made between these two exact phrasings of house edge information from the previous literature. We are aware that they differ across several dimensions, which means that any significant differences found here should be subject to follow-on work exploring precise mechanisms. While there is some reason to think that the longer alternative phrasing may be more effective, we do not believe that there is sufficient evidence to support a strong directional prediction at this time.
The present research aims primarily to experimentally compare these two phrasings of house edge information, using a hypothetical gambling scenario which closely follows previous research comparing the house edge with the return-to-player (Newall, Walasek, and Ludvig Citation2020a, Citation2020b), using a large sample of UK-based online gamblers. The two outcome measures used are gamblers’ perceived chances of winning measured on a 7-point scale, and rates of accurate responding on a multiple-choice question measuring correct understanding of this information. Effective gambling information should result in a low perceived chance of winning (hence encouraging people not to gamble), and be correctly understood by as many gamblers as possible (ensuring that any decisions to gamble are based on an accurate understanding of the statistical outcomes). Furthermore, seeing as how replication is an important aspect of gambling psychology research (Heirene Citation2021), a secondary aim of the present research is to attempt to replicate previous findings showing that house edge information results in higher rates of understanding and lower perceived chances of winning than equivalent return-to-player information. As in previous research, this study will do so via a direct replication using the original phrasing of the house edge (Newall, Walasek, and Ludvig Citation2020a, Citation2020b), and also a conceptual replication using for the first time the alternative phrasing of the house edge.
The following nondirectional hypotheses are therefore made, that there will be some difference between the two phrasings of house edge information in terms of:
H1. gamblers’ mean perceived chances of winning.
H2. gamblers’ rates of correct understanding.
Furthermore, in following our research aim to replicate previous findings, we make a secondary directional hypothesis comparing each of the two house-edge conditions to a third condition where participants will be given equivalent return-to-player information:
H3. Each of the two house-edge conditions will result in lower perceived chances of winning and higher rates of understanding than equivalent return-to-player information.
Method
Data, materials, an analysis script, and copy of the Stage 1 accepted manuscript are available on the Open Science Framework at https://osf.io/6hbyp/. Ethics approval for this study was obtained from the University of Bristol’s School of Psychological Science Research Ethics Committee (#12102). The PCI RR study design template is shown in . Preregistered Stage 1 protocol: https://osf.io/5npy9 (date of in-principle acceptance: 28/11/2022).
Table 1. The PCI RR study design template.
Participants
Participants were recruited for this study via the crowdsourcing platform Prolific. It has been suggested that Prolific can yield superior data quality compared to other crowdsourcing platforms such as MTurk (Eyal et al. Citation2021). Participants were paid £0.50 each (with an average response time of 2.9 min, this resulted in pro-rata payments of £10.34 an hour). We aimed for an average sample size of 1000 participants passing data quality checks per-condition, as this was the closest round number which exceeded the required sample size in each of the below power analyses. Overall, 3453 participants completed the experiment as planned (see below for discussion of data quality checks used). Of these, 62 (1.8%) participants completed the study in under one minute, and a further 58 participants (1.7%) indicated that we should not use their data, resulting in a final sample size of 3333 participants (1099 in return-to-player condition; 1118 in original house edge condition; 1116 in alternative house edge condition).
Prolific’s balanced sample feature was used in order to obtain an equal number of females and males (50.2% female after exclusions; four participants with missing data). The minimum age was set at 18 (M = 39.3, SD = 12.3 after exclusions; 11 participants with missing data). In order to obtain participants with experience in relevant online gambling games, Prolific’s relevant prefilter was used. Only participants who had previously responded to the following question with one or more of these options will be eligible to take part: ‘What types of online gambling/casino games have you played? Choose all that apply.’ Potential answers, ‘Baccarat/bingo/blackjack/craps/lottery/roulette/slots/video poker/virtual sports betting’. There were over 15,000 people based in the UK on the Prolific platform who met these prescreening requirements. On average, participants reported having engaged in between 3 and 4 gambling activities (M = 3.5, SD = 2.4). The descriptive statistics for gambling activity are reported in . The majority of respondents reported playing lottery and bingo, and just under half of respondents (44.9%) reported having gambled on a slot machine.
Table 2. Descriptive statistics of participants’ gambling behavior.
At the end of the experiment, participants completed the Problem Gambling Severity Index (PGSI; Ferris and Wynne Citation2001), and the sample contained the following breakdown: recreational gamblers (score 0; 39.3%), low-risk gamblers (score 1–2; 31.7%), moderate-risk gamblers (score 3–7; 21.0%), high-risk gamblers (score 8+; 8.0%).
Design
Following previous research (Newall, Walasek, and Ludvig Citation2020b), participants were given some short information about a hypothetical gambling scenario:
‘Imagine that you are a member of an online casino. You have played many of this online casino’s games over the last year.
You know that gambling games are designed so that most gamblers lose money over time. Only a percentage of all the money bet gets paid back out as winnings. Or, in other words, that casino games come with a house edge.
You are about to start playing a new online casino game, when you read the following message about the game:’
Two data quality checks were planned. First, we planned to exclude data from participants completing the experiment in under one minute. Based on data from a similar previous study, we expected this to lead to around 3.5% of all data collected being excluded (Newall, Walasek, and Ludvig Citation2020b). Second, methodologists have recommended the use of self-reported carelessness checks, such as, ‘In your honest opinion, should we use your data in our analyses in this study? (Do not worry, this will not affect your payment, you will receive the payment code either way.)’ (Brühlmann et al. Citation2020). This text was included after the rest of the experiment, and all participants responding with ‘no, please do not use my data’ then excluded. Previous data have suggested that up to 11.7% of crowdsourced responses might be careless (Jones et al. Citation2022), although previous data with that exact item suggests a lower rate of 5.6% self-reported careless responses (Brühlmann et al. Citation2020). For the present research, we planned for a rate of 10% self-reported careless responses. Therefore, with these two data quality checks in mind, we planned to collect data from 1,151 participants per-condition in order to reach our planned sample size (of 1000 usable responses per-condition).
Measures
The first outcome measure (H1) was a response on a 7-item Likert scale to the following question, ‘How does the above message affect your perceived chances of winning?’. Seven response options allowed participant to rate their chances of coming away with more money than they started: ‘My chances of winning are… Very high/High/Somewhat high/Neither high nor low/Somewhat low/Low/Very low chance of coming out ahead’. In a previous study, participants responded on average at the middle item of this scale (M = 4.1, SD = 1.6; 7 = ‘very high’, 1 = ‘very low’) when given the original house edge phrasing only (Newall, Walasek, and Ludvig Citation2020b). This suggested that this item should work well for the current research, as the alternative house edge phrasing could have resulted either in higher or lower perceived chances of winning.
The second outcome measure (H2) was a multiple-choice question, measuring participants’ correct understanding of the information given to them, ‘Which of the following best describes what the message means?’ Correct response option, ‘For every £100 bet on this game about £90 is paid out in prizes’. Following the first use of this measure by Collins et al. (Citation2014), previous research has used a further three incorrect response options, ‘90% of people who play this game will win something/This game will give out a prize 9 times in 10/If you bet £1 on this game you are guaranteed to win 90p’. However, when given the original house edge phrasing most participants have tended to answer this question correctly (70.9%; Newall et al. Citation2023). It would therefore be beneficial to make this measure harder, so that accurate rates of responding were closer to 50%. Some previous research found that around 20% of participants responded with a ‘don’t know’ response when this was added to a list of four similar responses (Behavioural Insights Team Citation2022), suggesting that this would be a good way to reduce accuracy rates via a reduction in successful guessing. Another incorrect response used in this previous research was: ‘For every £100 bet you will lose no more than £10’. Therefore, with the addition of these two additional response options, this resulted in a six-alternative choice.
Statistical analysis
The first two hypotheses were tested using only data from participants in one of the two house edge conditions. H1 was tested via ordinary least squares regression, with house edge format as the independent variable (original, alternative), and participants’ responses on the 7-point scale as the dependent variable. H2 was tested via logistic regression, with participants’ responses as the dependent variable (correct/incorrect), and experimental condition as the independent variable (original, alternative). H3 was tested via two separate models corresponding to those used for H1 and H2, but where binary variables were used for each house edge condition, which were then compared against responses in the return-to-player condition.
The preregistered protocol (https://osf.io/5npy9) contained some power analyses to support our plan to collect 1000 usable responses per-condition. For H1 and H2, it was impossible to know what magnitude of change on the dependent measures would lead to meaningful differences in actual gambling environments. Therefore, we were required to proceed heuristically, by powering our study for relatively small effects which were within our budget of resources to run this study. Given this uncertainty, we chose to explore a change on H1’s outcome from 4.1 to either 3.8 or 4.4 (SD = 1.6, d = 0.188), with 95% power and an alpha of 0.05. This was calculated using the ‘WebPower’ package in R (Zhang et al. Citation2018). This identified a requirement of 1473 (rounded-up to the nearest integer), or 737 participants in each house edge condition (rounding-up). For H2, we chose to explore a change in accuracy of 6% (accuracy moving from 50% to 56% or 44%, OR = 1.27, d = 0.133), again with 95% power and an alpha of 0.05. Using the WebPower package, this identified a requirement of 933 (rounded-up to the nearest integer), or 467 participants in each house edge condition (rounding-up). We did not perform a power analysis for H3 here as that was a secondary aim of the present research. However, we do note that previous research found ds of 0.48 and 0.69 for the two outcomes when comparing the original house edge phrasing with the return-to-player (Newall et al. Citation2023), indicating that H3 should have been more than adequately powered.
We also planned equivalence tests using the two one sided t-test (TOST) procedure. Whereas standard null hypothesis significance procedures test the hypothesis that the difference between groups, or the association between variables is significantly different from zero, equivalence testing allows effects below a given interval to be rejected as ‘too small’ to be of practical significance, which is referred to as the ‘smallest effect size of interest’ (Lakens Citation2017). Power analysis was conducted to test whether the proposed analyses were appropriately powered given the sample sizes proposed using the ‘power_t_TOST’ function in the TOSTER package (Lakens Citation2017) in R (R Core Team Citation2020). For this power analyses, the smallest of the two effect sizes from the previous power analysis was used as the smallest effect size of interest (d = 0.133), and this suggested a required sample size of 969 participants per-condition to achieve 80% power. This final power analysis supported our intention to collect 1000 usable responses per-condition.
Finally, we planned some exploratory analyses, investigating H1 and H2, which are the most novel aspects of the present research. These are marked as exploratory here. Two exploratory analyses see if there are any interaction effects between the phrasing of house edge information and PGSI, in order to detect whether the optimal phrasing of house-edge information might depend on gamblers’ level of problem gambling severity. Two extra regression models added a main effect of PGSI and an interaction between PGSI and experimental condition. Since p-values on interaction terms in non-linear models are not always interpretable (McCabe et al. Citation2020), the model for hypothesis 2 used ordinary least squares, as this has been recommended as a way of counteracting this issue (Ai and Norton Citation2003).
Results
Related to H1, we found that participants had a mean perceived chance of winning of 3.9 (SD = 1.6) in the original house edge condition, and 3.2 (SD = 1.5) in the alternative house edge condition. Ordinary least squares regression suggested that this difference was statistically significant (B = −0.71, t(2234) = −10.9, p < .001, 95% CI [−0.84, −0.58]).
shows patterns of responses to the second outcome measure of correct understanding. Related to H2, we found that 57.7% of participants provided the correct response in the original house edge condition, compared to 39.0% in the alternative house edge condition. A logistic regression suggested that this difference was statistically significant (OR = 0.47, z = −8.8, p < .001, 95% CI [0.40, 0.55]).
Table 3. Responses to outcome measure of correct understanding.
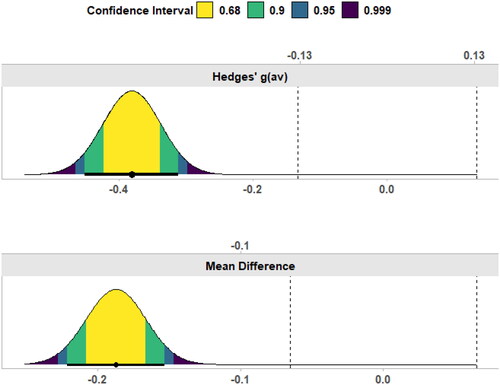
Equivalence tests were conducted as a sensitivity analysis to determine whether the significant differences observed in testing for H1 and H2 were practically different, i.e. larger than the smallest effect size of interest. The t-tests were statistically significant (H1 – t(2222.04) = −10.9, p <.001; H2 – t(2231.72) = −9.0, p <.001), confirming that the original and alternative house edge phrasings differed from each other on perceptions of winning and correct understanding. The equivalence tests were non-significant (H1 – t(2222.04) = −7.8, p = 1; H2 – t(2231.72) = −5.9, p = 1), indicating the effects between the two groups were not statistically equivalent. Although the t-values for the equivalence tests are high, these are non-significant because in both cases one of the two one-sided tests was non-significant ( and ). In both sets of tests, the observed effect was larger than the lower bound and fell outside of the equivalence bounds; i.e. the difference observed between the two house-edge conditions was greater than the smallest effect size of interest. Moreover, the 95% confidence intervals for the tests fell outside the lower bounds for both sets of equivalence bounds (H1 – raw difference = −0.713, 95% C.I. = −0.820 to −0.605, H2 – raw difference = −0.187, 95% C.I. = −0.221 to −0.153). Therefore, we can conclude these differences are both statistically and practically different.
Figure 1. Plot of the difference between the original and alternative house edge conditions on their perceived chances of winning. The dashed lines are the smallest effect sizes of interest for the equivalence test. Negative values suggest lower perceived chances of winning in the alternative phrasing condition.
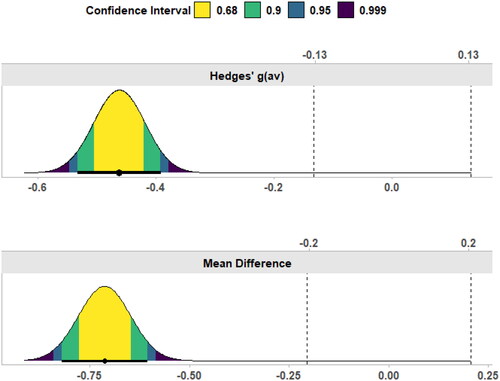
Figure 2. Plot of the difference between the house edge conditions in their correct understanding of the information given to them. The dashed lines are the smallest effect sizes of interest for the equivalence test. Negative values suggest lower rates of accurate understanding in the alternative phrasing condition.
H3 compares the two house-edge conditions against the return-to-player condition on these two outcomes. Participants in the return-to-player condition had a mean perceived chances of winning of 4.8 (SD = 1.7), which according to an ordinary least squares regression was higher than both the original (B = −0.95, t = −14.1, p < .001, 95% CI [−1.08, −0.82]), and alternative (B = −1.66, t = −24.6, p < .001, 95% CI [−1.80, −1.53]) house edge conditions. This aspect of H3 was therefore supported. However, 37.5% of participants in the return-to-player condition provided the correct response to the measure of correct understanding, which was significantly lower than the original house edge phrasing (57.7%; OR = 2.27, z = 9.5, p < .001, 95% CI [1.9, 2.7]), but not the alternative house edge phrasing (39.0%; OR = 1.07, z = 0.7, p = .471, 95% CI [0.90, 1.26]). Despite these similar rates of providing the correct response across the return-to-player and alternative conditions, the patterns of incorrect responses were different across these two conditions. Two incorrect responses were given more often in the return-to-player condition: ‘90% of people who play this game will win something’ (31.9% versus 4.5%), and ‘This game will give out a prize 9 times in 10’ (20.9% versus 5.8%). While the incorrect response ‘For every £100 bet you will lose no more than £10’ was given more often in the alternative house edge condition (31.8% versus 3.2%).
Results of the exploratory regression analyses extending H1 and H2 by adding a main effect of PGSI and an interaction term between house edge condition and PGSI are shown in . In both regression models, PGSI levels did not influence either outcome measure (p’s ≥ .078), either as a main effect or via an interaction. The closest effect to the preregistered level of significance was the interaction effect between PGSI and house edge condition for the perceived chances of winning measure. If further replications find that this effect exceeds the preregistered significance threshold, then this suggests that the difference between the two house edge phrasings might be lessened among gamblers suffering from higher levels of problem gambling severity. This exploratory analysis suggests that the results from H1 and H2 were robust across all levels of problem gambling severity.
Table 4. Regression model results comparing the two house-edge conditions, while adding a main effect of PGSI and an interaction term.
Discussion
The optimal communication of risk information can act as an input to a public health approach to reducing gambling-related harm (Eggert Citation2004; Livingstone et al. Citation2019; Newall et al. Citation2023). Compared to the return-to-player information that is currently given on some gambling products in certain jurisdictions, house edge information has been proposed as an equivalent and yet superior method of communication, particularly since it can result in reduced rates of gambling persistence (Newall, Byrne, et al. Citation2022). However, past empirical research has only used one way of phrasing house edge information (‘original’ format, e.g. ‘this game keeps 10% of all money bet on average’; Newall, Walasek, and Ludvig Citation2020a), while at least one other phrasing has been proposed (‘alternative’ format, e.g. ‘on average this game is programmed to cost you [10]% of your stake on each bet’; Livingstone et al. Citation2019; p.3). The present research was the first to empirically compare these two formats, and found that the original format had the highest rate of correct understanding, while the alternative format resulted in the lowest perceived chances of winning. Both of these differences exceeded the smallest effect size of interest. When compared to return-to-player information, the original phrasing had both lower perceived chances of winning and higher rates of correct understanding, while the alternative phrasing had only lower perceived chances of winning. In line with Newall et al. (Citation2023), this supports the use of the original phrasing instead of return-to-player information. The alternative phrasing still deserves further consideration, as its resulting low perceived chances of winning is an attractive property. However, it is currently limited by its lower rate of correct understanding compared to the original phrasing.
The differences between the two house edge phrasings with respect to rates of correct understanding may well have been revealed by the present research’s use of a six-alternative choice question, compared to some previous research which used a four-alternative subset (Newall, Walasek, and Ludvig Citation2020a, Citation2020b). Looking at ’s pattern of responses, it is clear that alternative house edge format participants were much more likely to provide one of the two added incorrect responses (‘For every £100 bet you will lose no more than £10’; 31.8%), in comparison to original house edge format participants (10.2%), or return-to-player participants (3.2%). As this incorrect response is quite similar to the correct response, these participants may well have given the correct response were the four-alternative subset to be given. If this had indeed happened, then the two house-edge format conditions would have appeared similar on this measure (original: 67.9%; alternative: 70.8%). This more sensitive six-alternative question can reveal differences that may not have been apparent with the original four-alternative question, but more research should be done to explore the meaning of different incorrect responses on the item as it was used here.
The alternative phrasing may have been particularly susceptible to that incorrect response due to its use of the words ‘is programmed to cost you’, which implies a deterministic rate of loss which is fairly consistent with that incorrect response (‘you will lose no more than £10’). On the other hand, this specific wording may have resulted in that phrasing’s low perceived chances of winning, as it emphasizes the likelihood with which gamblers will lose over time in electronic gambling formats. The alternative phrasing’s low perceived chances of winning suggest it could be an effective information format if it can be amended to reduce the incidence of this incorrect response. One potential amendment would be the addition of a 32-word ‘volatility warning’:
‘It takes millions of plays for a gambling game to tend toward its average return. A gambling game will not return a minimum value of prizes in any given period of gambling.’ (Newall, Walasek, and Ludvig Citation2020b).
Previous research has shown that this wording decreases perceived chances of winning, but has no consistent effect on rates of correct understanding when appended to the original house edge phrasing or return-to-player information (Newall, Walasek, and Ludvig Citation2020b). However, it may conceivably work to reduce the incidence of that novel correct understanding incorrect response, and a combination of the alternative phrasing and a volatility warning is worth considering in future research. The divergence across the two outcome measures between the two house-edge phrasings reveals a potential ethical issue for policymakers (Lades and Delaney Citation2022). It would be optimal to provide information that consumers understand and which induces desired patterns of behavior (less gambling). However, if the alternative phrasing’s low perceived chances of winning result in lower rates of gambling than the original phrasing, then policymakers would need to tradeoff between giving information that is widely understood, versus giving information that induces desired patterns of behavior. This would involve a value judgment lying outside the scope of current enquiry. Overall, this also shows why it would be beneficial to keep testing for combinations of gambling information which are both well understood and result in low perceived chances of winning, as well as investigate the behavioral consequences of different sets of information.
Limitations
This study is subject to various limitations that should be considered while evaluating its results. Participants were collected from a crowdsourcing platform, and so therefore took part in the study in return for payment. Although this data collection methodology introduces limitations (Pickering and Blaszczynski Citation2021), it does have some strengths too, such as the ability to cost-effectively oversample from gamblers of high levels of problem gambling severity (Russell et al. Citation2022). The study yielded self-report measures in response to a hypothetical scenario, which limits the external validity of the findings. However, previous studies have found converging evidence across self-report (Newall, Walasek, and Ludvig Citation2020b) and behavioral tasks (Newall, Byrne, et al. Citation2022) with respect to the related comparison of house edge and return-to-player information, which suggests that the present methodology may be a cost-effective way of investigating novel phrasings of gambling information. Furthermore, there are many other alternative ways of improving information delivery to gamblers, such as the use of graphical decision aides (Walker et al. Citation2019), which the study did not test. Finally, future studies may want to use other methodologies to measure gamblers’ understanding of relevant information, for example by asking them to explain their interpretation via an open-ended text box, rather than by providing a list of potential answers via a multiple-choice question.
Conclusions
This study supported previous findings on the superiority of the original house-edge phrasing in comparison to equivalent return-to-player information (Newall, Walasek, and Ludvig Citation2020a, Citation2020b; Newall, Byrne, et al. Citation2022). Furthermore, the study found even lower perceived chances of winning with the alternative phrasing, and this may open up further potential improvements in the communication of house edge information in future research.
Disclosure statement
The authors of this article declare that they have no financial conflict of interest with the content of this article. Philip Newall is a member of the Advisory Board for Safer Gambling – an advisory group of the Gambling Commission in Great Britain, and in 2020 was a special advisor to the House of Lords Select Committee Enquiry on the Social and Economic Impact of the Gambling Industry. In the last 5 years Philip Newall has contributed to research projects funded by the Academic Forum for the Study of Gambling, Clean Up Gambling, GambleAware, Gambling Research Australia, NSW Responsible Gambling Fund, and the Victorian Responsible Gambling Foundation. Philip Newall has received travel and accommodation funding from Alberta Gambling Research Institute and the Spanish Federation of Rehabilitated Gamblers, and received open access fee grant income from Gambling Research Exchange Ontario. Richard James currently holds research project funding from the Academic Forum for the Study of Gambling, whose funding comes from gambling regulatory settlements, and Gambling Research Exchange Ontario. Richard James has also received conferences expenses from the Swiss Government to attend and present research, and was previously co-investigator on a seed grant from the International Center for Responsible Gaming, a charity funded by donations from the gambling industry. Olivia Maynard has no conflicts of interest to declare.
Additional information
Funding
References
- Ai C, Norton EC. 2003. Interaction terms in logit and probit models. Econom Lett. 80(1):123–129.
- Behavioural Insights Team. 2022. Comprehension of gambling odds. https://www.bi.team/wp-content/uploads/2022/05/2022-05-Comprehension-of-gambling-odds-BIT-experimental-results.pdf.
- Beresford K, Blaszczynski A. 2020. Return-to-player percentage in gaming machines: impact of informative materials on player understanding. J Gambl Stud. 36(1):51–67.
- Blackwell AK, Drax K, Attwood AS, Munafò MR, Maynard OM. 2018. Informing drinkers: can current UK alcohol labels be improved? Drug Alcohol Depend. 192:163–170.
- Bleich SN, Economos CD, Spiker ML, Vercammen KA, VanEpps EM, Block JP, Elbel B, Story M, Roberto CA. 2017. A systematic review of calorie labeling and modified calorie labeling interventions: impact on consumer and restaurant behavior. Obesity. 25(12):2018–2044.
- Brühlmann F, Petralito S, Aeschbach LF, Opwis K. 2020. The quality of data collected online: an investigation of careless responding in a crowdsourced sample. Methods Psychol. 2:100022.
- Collins D, Green S, d’Ardenne J, Wardle H, Williams S-K. 2014. Understanding of return to player messages: findings from user testing. London: NatCen Social Research.
- Dubois P, Albuquerque P, Allais O, Bonnet C, Bertail P, Combris P, Lahlou S, Rigal N, Ruffieux B, Chandon P. 2021. Effects of front-of-pack labels on the nutritional quality of supermarket food purchases: evidence from a large-scale randomized controlled trial. J Acad Mark Sci. 49(1):119–138.
- Eggert K. 2004. Truth in gaming: toward consumer protection in the gambling industry. Md L Rev. 63(2):217–286.
- Eyal P, David R, Andrew G, Zak E, Ekaterina D. 2021. Data quality of platforms and panels for online behavioral research. Behav Res Methods. 54(4):1643–1662.
- Ferris J, Wynne HJ. 2001. The Canadian problem gambling index: final report. Ottawa: Canadian Centre on Substance Abuse.
- Harrigan KA, Dixon M. 2010. Government sanctioned 'tight” and “loose” slot machines: how having multiple versions of the same slot machine game may impact problem gambling. J Gambl Stud. 26(1):159–174.
- Harrigan K, Brown D, Barton KR. 2017. Classification of slot machines in Ontario: providing relevant information to players. Ontario, Canada: Gambling Research Exchange Ontario.
- Harrigan K, Dixon M. 2009. PAR Sheets, probabilities, and slot machine play: implications for problem and non-problem gambling. JGI. 23(23):81–110.
- Heirene RM. 2021. A call for replications of addiction research: which studies should we replicate and what constitutes a ‘successful’ replication? Addict Res Theory. 29(2):89–97.
- Hobin E, Vallance K, Zuo F, Stockwell T, Rosella L, Simniceanu A, White C, Hammond D. 2018. Testing the efficacy of alcohol labels with standard drink information and national drinking guidelines on consumers’ ability to estimate alcohol consumption. Alcohol Alcohol. 53(1):3–11.
- Jones A, Earnest J, Adam M, Clarke R, Yates J, Pennington CR. 2022. Careless responding in crowdsourced alcohol research: a systematic review and meta-analysis of practices and prevalence. Exp Clin Psychopharmacol. 30(4):381–399.
- Lades LK, Delaney L. 2022. Nudge FORGOOD. Behav Public Policy. 6(1):75–94.
- Lakens D. 2017. Equivalence tests: a practical primer for t tests, correlations, and meta-analyses. Soc Psychol Personal Sci. 8(4):355–362.
- Livingstone C, Rintoul A, de Lacy-Vawdon C, Borland R, Dietze P, Jenkinson R, Livingston M, Room R, Smith B, Stoove M. 2019. Identifying effective policy interventions to prevent gambling-related harm. Melbourne (AU): Victorian Responsible Gambling Foundation.
- McCabe C, Halvorson MA, King K, Cao X, Kim D. 2020. Estimating and interpreting interaction effects in generalized linear models of binary and count data. PsyArXiv. https://psyarxiv.com/th94c/.
- Newall PWS, Byrne CA, Russell AMT, Rockloff MJ. 2022. House-edge information and a volatility warning lead to reduced gambling expenditure: potential improvements to return-to-player percentages. Addict Behav. 130:107308.
- Newall PWS, Walasek L, Hassanniakalager A, Russell AM, Ludvig EA, Browne M. 2023. Statistical risk warnings in gambling. Behav Public Policy. 7(2):219–239.
- Newall PWS, Walasek L, Ludvig EA. 2020a. Equivalent gambling warning labels are perceived differently. Addiction. 115(9):1762–1767.
- Newall PWS, Walasek L, Ludvig EA. 2020b. Risk communication improvements for gambling: house-edge information and volatility statements. Psychol Addict Behav. 36(4):358–363.
- Newall PWS, Walasek L, Ludvig EA, Rockloff MJ. 2020. House-edge information yields lower subjective chances of winning than equivalent return-to-player percentages: new evidence from support forum participants. JGI. 45:166–172.
- Newall PWS, Walasek L, Ludvig EA, Rockloff MJ. 2022. Nudge versus sludge in gambling warning labels: how the effectiveness of a consumer protection measure can be undermined. Behav Sci Policy. 8(1):17–23.
- Pickering D, Blaszczynski A. 2021. Paid online convenience samples in gambling studies: questionable data quality. Int Gambl Stud. 21(3):516–536.
- R Core Team. 2020. R: a language and environment for statistical computing. Vienna: R Foundation for Statistical Computing. https://www.R-project.org/.
- Russell AMT, Browne M, Hing N, Rockloff M, Newall P. 2022. Are any samples representative or unbiased? Reply to Pickering and Blaszczynski. Int Gambl Stud. 22(1):102–113.
- Schwartz DG. 2013. Penny wise, player foolish? Slot-hold regulation and consumer preference. J Bus Res. 66(9):1623–1628.
- Walker AC, Stange M, Dixon MJ, Koehler DJ, Fugelsang JA. 2019. Graphical depiction of statistical information improves gambling-related judgments. J Gambl Stud. 35(3):945–968.
- Woolley R, Livingstone C, Harrigan K, Rintoul A. 2013. House edge: hold percentage and the cost of EGM gambling. Int Gambl Stud. 13(3):388–402.
- Zhang Z, Mai Y, Yang M, Zhang MZ. 2018. Package ‘WebPower’. https://webpower.psychstat.org/.