
 ?Mathematical formulae have been encoded as MathML and are displayed in this HTML version using MathJax in order to improve their display. Uncheck the box to turn MathJax off. This feature requires Javascript. Click on a formula to zoom.
Abstract
Background: Childhood obesity has become a growing global epidemic. In South Africa, overweight and obesity during childhood and adolescence are rising. The objectives of this study were (i) to estimate the prevalence of overweight and obesity among selected students in Cofimvaba, a rural settlement in Eastern Cape province, South Africa, and (ii) to assess the accuracy of the mid-upper arm circumference (MUAC) and ultrasound triceps skin-fold thickness (TSF) methods of predicting these health parameters
Methods: A cross-sectional study was conducted on 211 students (109 girls and 102 boys) selected randomly from five public schools in Cofimvaba and aged 6–19 years. The weight, height, MUAC and TSF were determined by standard techniques. Data obtained were subjected to descriptive statistics, Pearson correlations and receiver operating characteristic (ROC) curve analysis. P < 0.05 was considered statistically significant.
Result: Overall 1.9% (1.8% girls and 2.0% boys) of the respondents were underweight, 14.8% (21.1% and 7.8% boys) were overweight and 2.8% (4.6% girls and 1.0% boys) were obese. The prevalence of overweight and obesity was significantly higher (p < 0.05) in girls than boys during adolescence but there was no gender difference in children (6–9 years). Most of the students (80.6%) had a healthy weight, with boys being significantly (p < 0.05) healthier than girls. The BMI showed significant strong correlations with MUAC (r = 0.926; p < 0.001) and TSF (r = 0.643; p < 0.001). ROC curve analysis gave an area under the curve (AUC) of 0.795 (95% CI, 0.761–0.889) and 0.835 (95% CI, 0.771–0.899) for MUAC and TSF respectively.
Conclusion: The study found a high prevalence of overweight children in the sample and a low prevalence of stunting and underweight. The adolescent girls are at a higher risk of being overweight and obese than the boys. MUAC and TSF can adequately predict overweight and obesity among the selected students.
Background
Childhood obesity has become a growing global epidemic.Citation1 In 2010 it was estimated that 43 million children were overweight and obese with 81% of these coming from developing countries. It was projected that by 2020 almost 1 in 10 children worldwide and 1 in 8 children in Africa will either be overweight or obese. Childhood obesity has been reported to be higher among South African children (17.1% to 22.8%).Citation2 Adolescence (10–19 years), a transition phase between childhood and adulthood, is a critical period for the onset of obesity and for obesity-associated morbidity in later life.Citation3
The South African National Health and Nutrition Examination Survey (NHANES-1) reported a combined overweight and obesity prevalence of 13.5% in children aged 6–14 years, which is higher than the 10% global prevalence in schoolchildren.Citation4 The South African Primary School’s Anthropometric and Health Survey (1994) and the Health of the Nation Study (2001/2004) estimated an increase in overweight individual from 1.2% to 13% and obesity from 0.2% from 3.3% from 1994 to 2004, respectively.Citation5 It became clear that, although the prevalence of stunting decreased over the period, the trend of being overweight and obese increased. Successive studies have also confirmed this trend.Citation6
Body mass index (BMI) is the internationally recommended criterion for defining overweight and obesity in children and adults but is has some limitations.Citation7 MUAC, used to determine under-nutrition in children using arm muscle and arm fat muscle, has recently been proposed as another significant indicator of overweight and obesity in children and adolescents.Citation7 It is an easy and quick way to measure overweight and obesity and requires only an inexpensive flexible tape.Citation7
Triceps skinfold thickness has also been shown to be a good indicator of the amount of body fat and is positively correlated with BMI. Although closely related to BMI, TSF has been reported to predict the amount of body fat better than BMI.Citation8
Eastern Cape is the third largest province in South Africa but the second poorest, where 50% of households in the rural districts are food insecure.Citation9 Studies on the prevalence of overweight and obesity in this rural area are scarcely documented. This study will therefore add valuable information in describing the prevalence of overweight and obesity in this region and also determine the accuracy of MUAC and ultrasound TSF to identify high BMI in children and adolescents.
Subjects and methods
Ethics and informed consent
Ethical clearance was obtained for the study from the Senate Research and Innovation Ethics Committee of the Vaal University of Technology (20130520-3) and the Council of Scientific and Industrial Research (CSIR) (75/2013). Written permission was obtained from the School Management Board in Eastern Cape. The research was conducted according to the Medical Research Council’s guidelines for research on human beings as well as the Helsinki Declaration agreement guidelines. Prior to the study a meeting was held with the parents of the children and they were informed about the purpose of the study and the assessment to be conducted on their wards. Those that agreed signed written informed consent (parents and adolescents) and assent (children) forms, respectively.
Study settings
The study was conducted in Cofimvaba, a rural community in the Chris Hani District Municipality in the Eastern Cape province of South Africa.Citation10 It is situated 79 km east of Queenstown and has a land area of 21.19 km2 and a predominant black population of over 9 000. Cofimvaba is characterised by high levels of poverty and unemployment with critical skill shortages, subsistence farming, food insecurity and HIV/AIDS. A low level of education among the adult population was observed with less than a third having some form of secondary education and only 4% postsecondary education.Citation10
Study design and population
The sample size was calculated using the formulaCitation11
where Z = Z value of 1.96 for 95% confidence level, p = 80% expressed as a decimal (0.8 used for sample size needed) and c = confidence interval of 6.5, expressed as 0.065.
Of the 21 schools (n = 5 250 learners) in Cofimvaba, five schools with a population of 1 250 learners aged 6–19 years old were purposively selected by the Department of Basic Education for inclusion in the study, representing 24% of the school-age children in that area. The inclusion criteria were boys and girls in the selected schools between the ages of 6 and 19 years. Students outside that age bracket who reported ill-health or did not present signed informed consent and assent were excluded from the survey. After screening for the inclusion and exclusion criteria, 523 learners were eligible for inclusion in the study from the 556 informed consent and assent forms signed. The sample was then stratified for gender and age and 240 learners were selected from those with informed consent and assent. Data collection was conducted in August 2013 for five days (Monday to Friday).
A total of 211 students aged 6–19 years, randomly selected from five schools using probability according to sample size, completed the survey. A validated well-structured pre-coded socio-demographic questionnaire was used to elicit information on the family characteristics including family size, parental marital status, accommodation type and permanent residency.
Anthropometric measures
The field workers for this study were recruited from the Department of Food and Consumer Sciences at the Walter Sisulu University and trained during two eight-hour sessions by a registered dietitian and a public health nutritionist. The four field workers were trained on the ethical and general research philosophies applicable to research on human beings, the importance of accurate measurement and how to complete the socio-demographic questionnaire and 24-hour diet recall without interviewer bias (not reported in this study).
The children’s ages obtained from school records were confirmed by the field workers. The bodyweight and height were measured by a registered dietitian and public health nutritionist according to standard proceduresCitation12 with a calibrated Philips electronic scale, model HF350 (135 kg/100 g) (Philips, Amsterdam, The Netherlands) with a two-point decimal precision and a Seca stadiometer, respectively. All measurements, which were not to vary by more than 0.1 kg for weight and 0.1 cm for height, respectively, were taken twice and the average of the two measurements recorded.Citation13 The height was measured to the nearest 0.1 cm using the stadiometer as each child stood erect and barefoot with heels touching the wall of the stadiometer. Weight was measured to the nearest 0.1 kg as the child stood still on the weighing scale barefoot with light clothes on having emptied his/her pockets. Body mass index was computed using the standard formula BMI (kg/m2) = weight/height2
The MUAC and TSF were measured by a public health nutritionist. The MUAC was measured on the upper left arm at the midway between olecranon and acromion process using a flexible plastic Seca tape (Seca, Hamburg, Germany). During these measurements, the flexible tape was wrapped round at the midpoint of the upper arm as each child stood in a comfortable position and looking straight ahead with shoulders in normal position and the arm hanging loosely by the side, The tape was examined to ensure it was not too tight or loose and measurement was done to the nearest 1 mm.
The triceps skinfold thickness, which provides a measure of subcutaneous fat, was measured with the aid of a BodyMetrix (BX2000) according to the manufacturer’s user guide (BodyMetrix/Intelametrix, Brentwood, USA). The child stayed in an upright position with the arm hanging loosely by the side, and the ultrasound gel was applied to the posterior surface of the left arm, midway between the olecranon and the acromion process. The tip of the BodyMetrix was used to massage the ultrasound gel on the posterior surface for 1 minute and then pressed firmly for another 30 seconds to measure. The body fat was calculated in percentage from mid-upper arm circumference and triceps fold thickness.Citation14
Data analysis
Anthropometric data for the students were analysed using the World Health Organization’s (WHO, 2010) Anthroplus version 1.0.2 statistical software.Citation15 Overweight and obesity were defined using age- and gender-specific international cut-off points for BMI.Citation16 Data obtained were subjected to descriptive analysis, t-tests to detect difference between means, Pearson’s correlations to evaluate relationships between anthropometric indices and ROC curves were generated and area under the curve (AUC) calculated to determine the global accuracy measure for MUAC and TSF in predicting overweight and obesity. All analyses were done using SPSS version 20 (IBM Corp, Armonk, NY, USA) and a p value < 0.05 was considered as statistically significant.
Results
Socio-demographic and anthropometric characteristics of the respondents
In total, 211 learners aged 6–19 years completed the study. As shown in , most of the respondents (74.4%) were adolescents (aged 10–19 years old) and the gender was spread 51.7% female versus 48.3% male. Also, 74.9% lived in shared accommodation, 89.6% were permanent residents and 83.3% lived in houses with five or fewer persons.
Table 1: Socio-demographic characteristics of the respondents
As indicated in , there was no significant gender difference in the means of age, weight and MUAC. Although the boys were significantly taller (p < 0.05) than the girls (144.49 ± 16.62 versus 150.34 ± 19.19), the girls had significantly higher BMI (19.47 ± 4.00 versus 17.88 ± 2.67), TSF (8.86 ± 5.56 versus 4.94 ± 1.28) and percentage body fat (22.10 ± 10.2 versus 14.3 ± 3.7) than boys. Of all socio-demographic characteristics studied, only gender had significant effect on the weight status of the respondents. The girls had a higher prevalence of being overweight both by BMI and MUAC. Other socio-demographic profiles had no significant effect on the weight status of the learners.
Table 2: Means of anthropometric profiles of the respondents
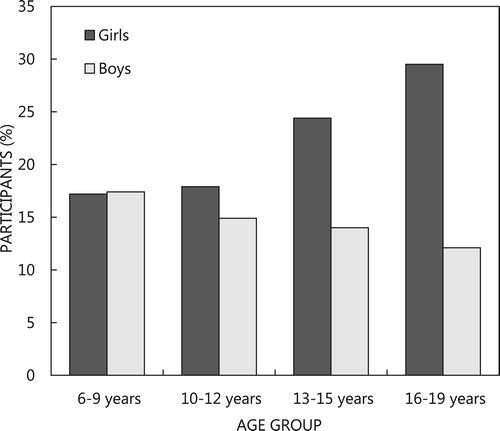
The prevalence of overweight and obesity among the respondents is shown in . Using the age and gender specific international cut-off points, 1.8% (3.1% girls and 0% boys) of those aged 6–9 years were underweight. Among the adolescents, 1.9% (2.6% girls and 1.3% boys) were underweight. Overall, 1.9% (1.8% girls and 2.0% boys) of the respondents were underweight, 14.8% (21.1% girls and 7.8% boys) were overweight and 2.8% (3.1% girls and 1.0% boys) were obese. The prevalence of overweight and obesity was significantly higher (p < 0.05) in girls than boys during adolescence but no gender difference (p > 0.05) was observed in children aged 6–9 years. Most of the respondents (80.6%) had healthy weights and boys were significantly healthier than girls (89.2% versus 72.5%; p = 0.014). As shown in , while the trend of overweight increased in girls it reduced in boys from childhood to late adolescence.
Figure 1: Prevalence of overweight/obesity in Cofimvaba students aged 6–19 years.
Difference in TSF and anthropometry according to weight status
Overweight/obese girls had significantly higher values for BMI (18.0 ± 2.7 versus 23.7 ± 4.1). MUAC (20.9 ± 3.3 versus 26.0 ± 4.5), ultrasound TSF (7.7 ± 4.8 versus 12.3 ± 6.2) and % body fat (20.5 ± 9.7 versus 26.7 ± 10.5) than their non-overweight counterparts (). The same trend was observed for overweight/obese boys.
Table 3: Difference in TSFT and anthropometry according to weight status
Correlation between MUAC/TSF and other anthropometric characteristics
shows the correlation coefficients of MUAC/TSF with other anthropometric characteristics by gender and age groups. MUAC had strong positive correlations with age (r = 0.789 versus r = 0.736; p < 0.001) and height (r = 0.819 versus r = 0.781; p < 0.001) and very strong positive correlations with weight (r = 0.959 versus r = 0.919; p < 0.001) and BMI (r = 0.951 versus r = 0.888; p < 0.001). Ultrasound TSF had positive correlations with age, height, weight, BMI and MUAC but when stratified into gender there was no significant correlation with age, height and weight in boys. Also, when stratified into age groups, no significant correlation was observed for TSF and height in either children (6–9 years) or adolescents (10–19 years).
Table 4: Correlation coefficients of MUAC/TSF with other anthropometric indicators
Association of MUAC and ultrasound triceps with obesity
indicates the accuracy of MUAC and ultrasound tricep skinfold thickness (TST) to predict overweight and obesity in children and adolescents. The area under the curve obtained showed that MUAC and TST had a high level of accuracy (AUC > 0.70) in identifying overweight and obesity in both girls and boys. Across age groups an AUC of 0.763–0.94 (p < 0.05) and 0.728–0.924 (p < 0.05) was obtained for MUAC and TSF respectively. The overall AUC of 0.795 (95% CI 0.761–0.889) for MUAC and 0.835 (95% CI 0.771–0.899) for TSF showed that both MUAC and TSF had excellent accuracy to predict overweight and obesity in the respondents.
Table 5: Accuracy of MUAC and ultrasound triceps to predict overweight and obesity
Discussion
The results from this study showed that 1.9% of the learners aged 6–19 years were underweight. The prevalence of underweight was lower than the 10% underweight prevalence reported among South African children aged 1–9 years in the NFCS 2005.Citation17 The 4.2% prevalence of underweight observed in girls aged 10–12 years was similar to the 4% reported among female primary students aged 10–12 years in rural KwaZulu-Natal.Citation18 Also, the underweight prevalence was similar to the underweight prevalence of 4.6% girls and 5.2% boys reported among students aged 10–16 years in rural Limpopo using the US Centre of Disease Control and Prevention (CDC) cut-off pointsCitation19 but contrary to the 66% prevalence of underweight reported among school children in eThekwini district in KwaZulu-Natal using the WHO guidelines for adults, where BMI < 18.5 kg/m2 was regarded as underweight.Citation18 This explains why adult guidelines are not an appropriate reference for children and adolescents as levels of underweight in the KwaZulu-Natal study may have been overestimated.
This study shows a high prevalence of overweight and obesity (16.9%) among the adolescents, which is consistent with previous findings in South Africa.Citation20–23 The report of the 2008 national surveys showed the prevalence overweight/obesity to be 25% in adolescents aged 14–19 years.Citation6 In a study conducted among children aged 9–13 years in the Northwest province, 22% of the participants were either overweight or obese. A systematic review of overweight and obesity among South African children reported trends of high prevalence across races, provinces, urban and rural settlements.Citation24 Studies have attributed high prevalence of overweight in rural areas to the consumption of diets rich in starch and fats, sedentary lifestyle and reduced physical activities.Citation24,Citation25
In this study, overweight and obesity consistently increased in girls and decreased in boys with age. A similar trend was observed by Grobbelaar et al.Citation26 who found that while overweight/obesity increased in girls from 0% in 4–8-year-olds to 26.7% in 14–18-year-olds, it reduced in boys from 16.7% to 0% of the same age range.Citation26 Previous studies have found significant age differences in the prevalence of overweight and obesity.Citation21,Citation22 The proportion of those who were overweight and obese was higher in girls than in boys. This is consistent with the earlier studies.Citation24,Citation26–30 Studies have linked the development of obesity in girls to the onset of menarcheCitation24,Citation31,Citation32 and lower prevalence of overweight and obesity in boys to higher levels of physical activity.Citation31,Citation32 Other factors suggested to be responsible for the gender disparity in overweight prevalence included differences in energy needs, behavioural and cultural beliefs.Citation24
This study finds a very strong relationship between MUAC and BMI, thus confirming previous studies that MUAC correlated very well with BMICitation7,Citation33,Citation34 and could be used to identify not only underweight but also overweight and obesity. Similarly, an association was observed between ultrasound TSF and BMI, which also confirmed previous findings.Citation8 The AUC obtained for both MUAC and TSF shows an excellent accuracy level to predict high BMI or overweight and obesity.
Study limitation
The study considered only children attending schools in Cofimvaba, and care must be taken when generalising results from the study.
Conclusion
This study reported low prevalence of underweight and higher prevalence of overweight and further confirmed that MUAC as well as ultrasound TSF can be an alternative tool to BMI for determining overweight and obesity in children and adolescents. A tilt towards overweight is apparent among the girls in this rural community. Considering the consequences of overweight and obesity, nutrition intervention and physical activities aimed at promoting healthy lifestyles are recommended for lifelong benefits.
Disclosure statement
No potential conflict of interest was reported by the author(s).
References
- Wang Y, Lim H. The global childhood obesity epidemic and the association between socio-economic status and childhood obesity. Int Rev Psychiatry. 2012;24(3):176–188. doi: https://doi.org/10.3109/09540261.2012.688195
- De Onis M, Lobstein T. Defining obesity risk status in the general childhood population: which cut-offs should we use? Int J Pediatr Obes. 2010;5:458–460. PMid:20233144. doi: https://doi.org/10.3109/17477161003615583
- Freedman DS, Khan LK, Serdula MK, et al. Inter-relations among childhood BMI, childhood height, and adult obesity. The Bogalusa heart study. Int J Obes Relat Metab Disord. 2004;28(1):10–16. Available from: http//www.ncbi.nlm.nih.gov/pubmed/14652621 doi:10.1038/sj.ijo0802544 doi: https://doi.org/10.1038/sj.ijo.0802544
- Shisana O, Labadarios D, Rehle T, et al. South African national health and examination survey (NHANES-1). Cape Town: HSRC Press; 2013.
- Armstrong ME, Lambert MI, Lambert EV. Secular trends in the prevalence of stunting, overweight and obesity among South African children (1994–2004). Eur J Clin Nutr. 2011;65(7):835–840. doi: https://doi.org/10.1038/ejcn.2011.46
- Reddy SP, Resnicow K, James S, et al. Underweight, overweight and obesity among South African adolescents: results of the 2002 national youth risk behaviour survey. Pub Health Nutr. 2008;12(2):203–207. PMid:18547451. doi: https://doi.org/10.1017/S1368980008002656
- Tang A, Dang K, Deitcher M, et al. Use of cut-offs for mid upper arm circumference (MUAC) as an indicator or predictor nutrition and health related outcomes in adolescents and adults: a systematic review. Food and Nutrition Technical Assistance (FANTA). 2013. Available from: http://www.fantaproject.org/sites/defaults/files/resources/MUAC%20systematic%20review%20_Nov%2019.pdf
- Planninsec J, Fosnaric S. Body mass index and triceps skinfold thickness in pre-pubertal children in Slovenia. Coll Anthropol. 2009;33(2):341–345. Available from: https://www.semanticscholar.org/paper/Body-mass-index-and-triceps-skinfold-thickness-in-Planin%C5%A1ec-Fo%C5%A1nari%C4%8D/22d3c5143a06a361694be0d819b2458285ad20d7
- Rogan M. Food poverty, hunger and household production in rural Eastern Cape households. Dev S Afr. 2018;35(1):90–104. doi:10.1080/0376835X.20171358602 doi: https://doi.org/10.1080/0376835X.2017.1358602
- South African Statistics. Community Survey, 2016. [online]. Available from: www.statsa.gov.zacs2016.statsa.gov.za/wp-content/uploads.2018/07/easterncape.pdf
- The Survey System. Sample size calculator [cited 2013 Mar 31]. Available from: www.surveysystem.com/sscalc.htm
- Lohman TG, Roche AF, Martorell M. Anthropometric standardisation reference manual. Champaign (IL): Human Kinetics; 1988.
- Gibson R. Principles of nutritional assessment. 2nd ed. New York: Oxford University Press; 2005, p. 282.
- Frisancho AR. Anthropometric standards for the assessment of growth and nutritional status. Ann Arbor: University of Michigan Press; 1990.
- Anthro® plus version 1.0.2. World Health Organization. c2010. Available from: www.who.int/growthref
- Cole TJ, Bellizzi MC, Flegal KM, et al. Establishing a standard definition for child overweight and obesity worldwide: international survey. Bri Med J. 2000;320:1240–1246. doi: https://doi.org/10.1136/bmj.320.7244.1240
- Labadarios D, Swart R, Maunder EMW, et al. National food consumption survey fortification baseline (NFCS-FB-I) South Africa, 2005. S Afr J Clin Nutr. 2008;21(2):245–300.
- Puckree T, Naidoo P, Pillay P, et al. Underweight and overweight in primary school children in KwaZulu-natal, South Africa. Afr. J Prim Health Care Fam Med. 2011;3(1):1–6. doi: https://doi.org/10.4102/phcfm.v4i1.203
- Toriola AL, Moselakgomo VK, Shaw BS, et al. Overweight, obesity and underweight in rural black South African children. S Afr J Clin Nutr. 2012;25(2):57–61. doi: https://doi.org/10.1080/16070658.2012.11734406
- Steyn NP, Labadarios D, Maunder E, et al. Secondary anthropometric data analysis of the national food consumption survey in South Africa: The double burden. Nutr. 2005;21:4–13. PMid:15661473. doi: https://doi.org/10.1016/j.nut.2004.09.003
- Jinabhai CC, Taylor M, Sullivan KR. Implications of stunting, overweight and obesity among South African primary school children: a possible nutrition transition? Eur J Clin Nutr. 2003;57(2):358–336. doi: https://doi.org/10.1038/sj.ejcn.1601534
- Kruger R, Kruger HS, MacIntyre UE. The determinants of overweight and obesity among 10- to 15-year-old schoolchildren in the North West Province, South Africa – the THUSA BANA study. Pub Health Nutr. 2006;9(3):351–358. PMid:16684387. doi: https://doi.org/10.1079/PHN2006849
- Cameron N, Getz B. Sex differences in the prevalence of obesity in rural African adolescents. Int J Obes. 1997;21:775–782. PMid:9376890. doi: https://doi.org/10.1038/sj.ijo.0800472
- Rossouw HA, Grant CC, Viljoen M. Overweight and obesity in children and adolescents: the South African problem. S Afr J Sci. 2012;108(5/6):1–7. doi: https://doi.org/10.4102/sajs.v108i5/6.907
- Romieu I, Laure Dossus L, Barquera S, et al. Energy balance and obesity: what are the main drivers? On behalf of the IARC working group on energy balance and obesity. Cancer Causes Control. 2017;28(3):247–258. Published online Feb 17, 2017. doi: https://doi.org/10.1007/s10552-017-0869-z
- Grobbelaar HH, Napier CE, Oldewage-Theron WN. Nutritional status and food intake data on children and adolescents in residential care facilities in Durban. S Afr J Clin Nutr. 2013;26(1):29–36. doi: https://doi.org/10.1080/16070658.2013.11734437
- Vignerova J, Humenikova L, Brabec M, et al. Long-term changes in body weight, BMI and adiposity rebound among children and adolescents in the Czech Republic. Econ Hum Biol. 2007;5(3):372–382. doi: https://doi.org/10.1016/j.ehb.2007.07.003
- Wee BS, Poh BK, Bulgiba A, et al. Risk of metabolic syndrome among children living in metropolitan Kuala Lumpur: a case control study. BMC Pub Health. 2011;11:333. doi: https://doi.org/10.1186/1471-2458-11-333
- Aounalian-Skhiri H, Traissac P, Ati JE, et al. Nutrition transition among adolescents of a south- Mediterranean country: dietary patterns, association with socio-economic factors, overweight and blood pressure. a cross-sectional study in Tunisia. Nutr J. 2011;10:38. doi: https://doi.org/10.1186/1475-2891-10-38
- Gaskin PS, Walker SP. Obesity in a cohort of black Jamaican children as estimated by BMI and other indices of adiposity. Eur J Clin Nutr. 2003;57(3):420–426. doi: https://doi.org/10.1038/sj.ejcn.1601564
- Mukuddem-Petersen J, Kruger HS. Association between stunting and overweight among 10–15-y-old children in the North West Province of South Africa: the THUSA BANA study. Int J Obes. 2004;28:842–851. PMid:14758345. doi: https://doi.org/10.1038/sj.ijo.0802586
- Chung AE, Skinner AC, Steiner MJ, et al. Physical activity and BMI in a nationally representative sample of children and adolescents. Clin Pediatr (Phila). 2012;51(2):122–129. doi: https://doi.org/10.1177/0009922811417291
- Fakier A, Petro G, Fawcus S. Mid upper arm circumference:a surrogate for body mass index in pregnant women? S Afr Med J. 2017;107(7):606–610. doi: https://doi.org/10.7196/SAMJ.2017.v107i7.12255
- Tonder EV, Mace L, Steenkamp L, et al. Mid upper arm circumference (MUAC)as a feasible tool in detecting adult malnutrition. S Afr J Clin Nutr. 2018: 1–6. doi: https://doi.org/10.1080/16070658.2018.1484622