
Abstract
Objective:
A study was undertaken to explore the portion size estimation accuracy of bean bags as low-cost volumetric portion size estimation aids for amorphous foods.
Designs:
Three observational, cross-sectional and three experimental/quasi-experimental developmental evaluation sub-studies were carried out.
Settings:
Observational, cross-sectional: one retirement village and four schools. Experimental/quasi-experimental: one South African university.
Participants:
Observational, cross-sectional: elderly persons, adult women (school educators), schoolchildren. Experimental/quasi-experimental: university students. In total N = 541; > 3 800 observations.
Variables measured:
Using a standardised set of bean bags (test object; volume range: 60–625 ml), volumes of different amorphous foods (reference objects: actual foods or representations) in varying portion sizes had to be estimated. Accuracy (outcome measure) was perfect if volumes of test and reference object were identical. Acceptable estimation accuracy allowed for misestimation by one bean bag size. Test–retest reproducibility was also assessed.
Analysis:
Descriptive statistics (proportions perfect and acceptable accuracy).
Results:
Across the sub-studies, perfect accuracy ranged from 22–65% depending on participants, reference food and portion size. Irrespective thereof, acceptable accuracy was noted in > 70% of observations. Reproducibility varied (range: 28–67% agreement).
Conclusions and implications:
Perfect portion size estimation of amorphous foods remains challenging. When misestimation by 60–125 ml still serves the purpose of a dietary assessment, bean bags show promise for cost-effective food volume quantification, especially on group level in resource-limited settings.
Introduction
Dietary assessment is an important starting point for appropriate nutrition care as intake deficiencies and excesses are linked to ill-health.Citation1 The challenges in measuring the diet of childrenCitation2 as well as youngerCitation3 and olderCitation4 adults have repeatedly been voiced. When quantitative intake information is needed, lack of portion size estimation accuracy is a major contributor to under- and overestimations.Citation5 It appears that estimation accuracy is, among other factors, related to food type (e.g. liquids vs. solids vs. amorphous foods). Portion size estimation of amorphous foods may be particularly challenging.Citation6,Citation7
Portion size estimation aids (PSEAs) are intended to help study participants report the amount of food consumed.Citation8 Many portion size estimation elements have been developed and/or tested.Citation9 These range from gestures/body parts, e.g. a fist or fingernailCitation10 to one-dimensional (e.g. serving size lists in food guides), two-dimensional (e.g. photographs and drawings) and three-dimensional (3-D) aids, such as physical objects like household utensils and food models, to digital two-dimensional formatsCitation8,Citation9 and even computer vision,Citation11 with diverging terminology and classifications.
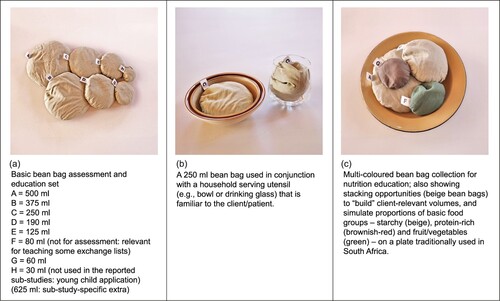
Anecdotal observations from nutrition assessment and education practice in South Africa suggest that bean bags are widely used. They are low-cost, 3-D, volumetric PSEAs, which can be home-made (). Because bean bags as non-food PSEAs are generic, they are useful for estimating or demonstrating to participants the volumes of different amorphous and liquid foods (as opposed to food-specific PSEAs like photographs or food models). They can be used individually or combined with one another or with familiar and locally relevant household vessels (e.g. by placing the bags into a glass or bowl typically used by the participant) (b). In research where fieldworkers do home visits on foot or data collection is done at remote sites, the robustness, ease of transport and use, and the hygiene (washability) of the bean bags are additional advantages.
Figure 1: Bean bags: description of set and uses in dietary assessment and education.
Bean bags were used in the NHANES 1999–2001 (USA),Citation12 yet no evidence of testing or validation could be found. Among reviews on PSEAs,Citation8,Citation9,Citation13 none refers to bean bags. Similarly, the ‘Best Practice Guidelines for dietary assessment’Citation14 mention only that portion sizes used in dietary assessment tools should be relevant, with no specific information regarding PSEAs. This suggests that currently no single best practice for PSEAs exists.
The aim of this developmental evaluation was to explore the accuracy of volumetric portion size estimation of amorphous foods when bean bags are used as PSEAs in different contexts. The objectives of the six sub-studies were as follows:
Sub-study 1: To determine the portion size estimation accuracy of a fixed volume of four food types by older adults when using bean bags as PSEAs.
Sub-study 2: To determine adult women’s portion size estimation accuracy of 3D-printed amorphous food models when using bean bags as PSEAs (considering body mass index [BMI], energy density and perceived healthfulness of the reference foods).
Sub-study 3: To determine middle and secondary school learners’ portion size estimation accuracy of PowerPoint-projected photographs of amorphous foods when using bean bags as PSEAs.
Sub-study 4: To determine the effect of four plate characteristics on portion size estimation accuracy of a fixed-volume bean bag by university students.
Sub-study 5: To determine the effect of bean bag colour (beige vs. black) on portion size estimation accuracy of three portion sizes of mashed butternut by university students.
Sub-study 6: To determine university students’ portion size estimation accuracy of two portion sizes of three forms of maize meal porridge when using bean bags and life-size food photographs as PSEAs.
Methods
General
In all six sub-studies healthy volunteers were conveniently recruited, and informed consent and approval from the Research Ethics Committee (Faculty of Health Sciences, University of Pretoria) were obtained. Recruitment differed by setting and included word-of-mouth invitations (sub-study 1), poster announcements (sub-studies 2 and 3) and context-delimited social media (sub-studies 4–6). Data collection was always preceded by a pilot study in the same or comparable setting, with participants similar to those of the sub-study to establish practical feasibility. Very minor adjustments were implemented if indicated, e.g. room setup. Pilot study data were not used in the analyses.
The test object consisted of identical sets of custom-made bean bags, i.e. 3-D, round, malleable, beige-coloured polyester-cotton bags filled with 2 mm diameter plastic pellets (Supplementary file 2 gives guidelines for making bean bags). A full assessment set consisted of the following letter-coded volumes (hidden from participant): 60, 125, 190, 250, 375, 500, 625 ml (). For some sub-studies the number of bean bags per set was reduced (at most by one portion size) to match the participants (e.g. children [sub-study 4] vs. adults) and typical volume of food consumed (e.g. staple porridge [sub-study 3] vs. candy [sub-study 2]). Sometimes a second test object was added to determine comparative effectiveness of the standardised bean bags: in sub-study 5 black bean bags and in sub-study 6 life-size food portion photographs were added.
In most sub-studies the portion size estimation with the bean bags followed within ± 30 seconds after exposure to the reference object (see below for details per sub-study). This was done to determine volume estimation accuracy (i.e. conceptual ability versus memory), to separate the specific effects of the PSEA from the effects of dietary assessment methodsCitation9 and to facilitate comparability among the sub-studies and in relation to other studies. The different bean bag sizes were always randomly presented. Participants were asked to select the bean bag that most closely matched the volume of the reference food/object and indicate their response by marking it on a fixed-option questionnaire (except sub-study 1, where the oral responses were researcher-coded). In all instances except sub-study 1, reproducibility was assessed (as described per sub-study), as this can be considered a prerequisite for validity, may give an indication of participants’ perceptive ability and provide an indication of guessing factor as opposed to estimation accuracy.
All assessments included short questionnaires for self-reporting of biographic information (e.g. age [completed years] and sex [closed-choice format allowing for male, female and other]) and other sub-study-specific data.
Unique methodological details per sub-study are summarised below:
Sub-study 1
Design: Observational; cross-sectional.
Participants and setting: Independently living elderly (N = 30; age 80 ± 7.4 years; 87% female), assessed in the lounge of a retirement village.
Data collection:
Reference objects and portion size: Two actual food examples of each of the following food types: AM, AP, solids (S) and liquids (L); all 190 ml.
Presentation: Three sets of ready-to-eat breakfast foods, i.e. (i) tea (L), soft porridge (AM), diced apple (AP); (ii) whole apple (S), fruit juice (L); (iii) scrambled eggs (AM), bread (S), grapes (AP) were presented in locally used dishware. Each set was placed on a separate tray. Administration was individual, researcher-assisted. A participant was shown one food set at a time for 30 seconds before removing it. The randomly displayed bean bags were presented on a separate tray. Participants were asked to identify the bean bag that reflected the amount of each food presented.
Reproducibility: Not performed.
Sub-study 2
Design: Observational; cross-sectional.
Participants and setting: Female educators (N = 72; age: 44.5 ± 12.3 years) with a BMI of 22.5 ± 4.6 kg/m2 assessed in the staffrooms of three urban schools. One participant: underweight (< 18.5 6 kg/m2); 30: normal weight (18.5–24.9 6 kg/m2); 23: overweight (25.0–29.9 6 kg/m2); 9: obese (≥ 30 6 kg/m2); 9 non-consent to weighing.
Data collection:
Reference objects and portion sizes: Study-specific, 3-D printed, realistically coloured, life-size food models of 12 different amorphous foods with differing energy density (high energy density: > 200kcal/250 ml) were created. The higher energy density AM foods included stiff maize meal porridge (375 ml), cooked minced meat (250 ml) and scrambled eggs (190 ml). The lower energy density AM foods were soft maize meal porridge (375 ml), cooked rice (250 ml) and cooked spinach (190 ml). The AP foods included higher energy density foods (‘chunky’ potato salad with mayonnaise (500 ml), peanuts (125 ml) and Smarties (60 ml)). Lower energy density AP foods referred to popcorn (500 ml), grapes (125 ml) and cooked mixed vegetables (60 ml).
Presentation: Fifteen (12 for accuracy + 3 for reproducibility) separate booths were randomly set up, each containing a set of bean bags, randomly laid out on a neutral-coloured (brown) surface. Per booth the 3-D food models were individually placed on identical plates. Participants were not allowed to touch the food models or bean bags. They moved from one booth to the next, and privately recorded their responses.
Reproducibility: Three food models were displayed twice; completion by all participants.
Sub-study 3
Design: Observational; cross-sectional.
Participants and setting: Middle and secondary school learners (N = 51; 37% female; 13–19-year-olds), assessed during six group sessions (group size: 4–12) in a school classroom, not allowing for participant interaction.
Data collection:
Reference objects and portion sizes: Nine different regularly (R) or less often consumed (LC) ready-to-eat actual amorphous foods from different food groups were prepared and portioned. Starchy foods: rice (250 ml andand 60 ml) (R), spaghetti (625 ml and 375 ml) (R) and breakfast cereal (cornflakes) (500 ml and 125 ml) (LC). Protein-rich foods: chicken curry (625 ml [x2] and 250 ml [x2]) (R), minced meat (625 ml and 375 ml) (R); eggplant (aubergine) (250 ml and 60 ml [x2]) (LC). Fruit and vegetables: mixed, diced vegetables (375 ml and 60 ml) (R) and diced kiwi fruit (125 ml [x2]) (LC). Yoghurt (500 ml and 125 ml) (R) represented the dairy group.
Presentation: Food photographs (aerial and 45° angled view per slide, foods dished up on black plates or bowls on white background using standardised photography) were shown for 30 seconds in a PowerPoint- presentation to each group. Participants recorded their responses during this time. Each photograph included a spoon as size reference. Bean bag sets, randomly ordered, and the reference spoon were physically displayed next to each participant.
Reproducibility: Three photographs (different foods and different portion sizes) were shown twice.
Sub-study 4
Design: Quasi-experimental; comparison of estimation accuracy (with plate characteristics as intervention).
Participants and setting: University students (N = 184; 52% female; age: 20 ± 1.7 years) on campus (open air).
Data collection:
Reference object and portion size: 250 ml bean bags, beige-coloured (generic, uniform proxy for AM foods).
Presentation: Participants recorded their response to: ‘What is the size of the beanbag on the plate?’ at 13 separate booths, where the bean bags were presented on plates with 4 different characteristics: (i) Size: 6 plate pairs: 20 vs. 25 cm diameter; (ii) Colour: 4 plate pairs: white vs. navy; (iii) Pattern: 2 plate pairs: navy ornaments on white vs. white; (iv) Rim: 4 plate pairs: presence or absence of rim. Five distractor bean bag volumes (125–500 ml) were randomly presented in between the 250 ml fixed-size bean bags. The response options given were ½ cup, 1 cup, 1½ cups, 2 cups.
Reproducibility: Two randomly placed duplicate booths.
Sub-study 5
Design: Randomised control, crossover experiment (plus comparative effectiveness assessment).
Participants and setting: University students (N = 100; 65% female; age: 21.2 ± 3.0 years) in dining hall of residence.
Data collection:
Reference objects and portion sizes: Actual food: cooked, mashed butternut (AM); plus black bean bags as PSEA control. Portion sizes for actual food and for black bean bags: 125, 250, 500 ml.
Presentation: Two separate stations (brown surface) for assessment with beige and black bean bags respectively. The bean bags were individually placed on identical, white plates in a random display per station. Individual butternut portions on identical plates to the bean bags were randomly presented to each participant for 30 seconds. Participants were randomly allocated to start with either the black or the beige station.
Reproducibility: Ten participants repeated the entire assessment two days after first administration.
Research Ethics Approval number: 800/2019.
Sub-study 6
Design: Comparative effectiveness study.
Participants and setting: University students (N = 104; 56% female; age: 20.9 ± 2.0 years) in dining hall of residence.
Data collection:
Reference objects and portion sizes: 250 ml and 500 ml of three different consistencies of actual maize meal porridge (soft, crumbly and stiff) and a life-size, individual, colour photograph of each bean bag volume of each porridge consistency (aerial and angled 45° view). Both reference objects (i.e. actual food and photographed food) were cooked according to the same, standardised recipes, as per South African food composition tables ().
Presentation: Foods were randomly presented on cream-coloured, commonly used, enamel plates (24 cm diameter; identical for actual food and photographs; plate as in c) in 15 separate stations (3 maize meal porridge consistencies x 2 portion sizes x 2 PSEAs + 3 repeats). The stations were placed such that participants could not see the other stations. At each station participants noted their response to the question ‘Which [bean bag/photograph*] best matches the amount of [stiff/soft/phuthu*] porridge?’ on a questionnaire. No touching of food or PSEA was allowed. (*Wording adjusted per station.)
Reproducibility: Three test–retests (different porridge consistencies, portion sizes and PSEAs [two for bean bags; one for photographs]) by all participants.
Table 1: Portion size estimation accuracy of bean bags: Comparative summary of sub-studies (N = 541)Table Footnote1
Analysis
Data analysis (Microsoft Excel; Microsoft Corp, Redmond, WA, USA) and reporting in relation to estimation accuracy referred to the proportion (%) of observations per sub-study with perfect volume estimation, vs. slight/gross under/overestimation per reference object. Slight referred to choosing one bean bag size smaller or larger, whilst gross meant deviance by two or more bean bag sizes. In all the sub-studies acceptable portion size estimation included perfect estimation plus slight misestimation (i.e. deviance by one bean bag size).
Results
Across the sub-studies 541 healthy participants including both sexes, different age groups (children of school-going age, university students, adults, persons over 65 years) and physical settings (school classrooms, staff/dining halls and campus grounds) created over 3 800 observations of portion size estimation accuracy involving bean bags for estimating food volumes. Because sub-study 5 investigated effects of plate characteristics on estimation accuracy, those observations were excluded from this total.
The portion size estimation accuracy of bean bags per sub-study is outlined below.
Sub-study 1
Among the 240 estimations (30 participants; 8 reference objects) perfect accuracy was noted for 22% (AM and S), 23% (L) and 37% (AP) of responses. Acceptable estimation exceeded 73% for each of the food types with a tendency for overestimation of AM, and underestimation for S and L.
Sub-study 2
Of 864 estimations (72 participants; 12 reference objects), 29% were perfect and 73% were acceptable. Slight overestimation predominated, especially of AP. No obvious association with BMI category, energy density or perceived healthfulness was observed. About 50% of participants gave identical answers in the two administrations of the three food models. Acceptable reproducibility was about 85%.
Sub-study 3
From a total of 845 first observations (maximum 51 participants; 17 different reference food-portion size combinations, 22 missing values), perfect estimations ranged from 35% for 1½ cups of spaghetti to 65% for ¼ cup of aubergine. The mode of learners estimated 19/20 (95%) of food photographs perfectly or acceptably. Across all estimations, the secondary school learners had a slightly (5%) higher proportion of perfect to acceptable accuracy compared with the middle-school children. The largest portion size (625 ml) had the lowest percentage (range: 2–25%) of perfect estimations. No obvious relation to sex, food group or frequency of consumption could be detected. For reproducibility (148 observations from 3 reference objects; 5 missing values), perfect agreement between the assessments was seen for 2 of the 3 portion size estimations by the mode of participants.
Sub-study 4
Among the 2 392 observations, only the size of the presentation plate was related to estimation accuracy. The large (25 cm diameter) plates consistently (i.e. across six plate pairs; 2 208 size-related observations) yielded a larger percentage of perfect estimations of the 250 ml bean bag presented (the mean difference in the percentage of perfect estimations between large and small plates was 16%), regardless of the colour or the presence/absence of a rim or pattern on the plate. The percentage of perfect estimations ranged from 43% (small, white, non-rimmed plate) to 74% (large, navy, rimmed plate). No response pattern was detectable for the other plate characteristics. In total, 123 (67%) participants gave identical answers on the two repeat administrations, with no gross volume estimation differences.
Sub-study 5
From the 600 estimations (100 participants; 3 reference food volumes, 2 bean bag colours), the beige and black bean bags resulted in 35% and 13% perfect estimations respectively, when the results of the 3 reference food volumes were combined. Overestimation was noted in 58% when using beige bean bags, and 78% for black bean bags. The largest bean bag portion (500 ml) accounted for most of the over-estimation. Almost 50% of participants changed their response in the second administration.
Sub-study 6
From 1 243 estimations (104 participants; 3 porridge consistencies each in 2 portion sizes as reference objects, with bean bags and photographs as test objects, and 5 missing values), 37% were perfect. The total underestimation rate was 27% and total overestimation 36%. For the bean bags only, 28% of estimations were perfect, 83% were acceptable, with 20% underestimations and 52% overestimations. Regarding photographs only, 47% were perfect estimations and 91% were acceptable. Under- and overestimations respectively accounted for 34% and 19% of the estimations. Perfect estimation agreement in the re-tests was 28% and 51% for bean bags and photographs respectively.
The six sub-studies are tabulated together for ease of comparison in . In addition, a more detailed poster of each sub-study is in Supplementary file 1.
Discussion
About a third of the observations by the diverse group of participants reflected perfect portion volume estimation when beige-coloured bean bags were used as PSEAs for a variety of amorphous foods of different consistencies and portion sizes. This proportion increased to 83% (sub-study 6), when an over- or underestimation by one bean bag size of 60–125 ml (i.e. the volume difference range between ‘adjacent’ bean bags) was allowed. The question whether such an ‘acceptable’ estimation is ‘good enough’ depends on many factors. The type of food and its role in the diet of the target group are particularly important. An example is the maize meal porridge as investigated in sub-studies 2 and 6. Maize meal porridge is a staple food in the South African diet, typically eaten in large portions. The energy density (energy content per volume of food) of soft porridge (about 600kJ/250 ml) is much lower than that of stiff porridge (about 1010kJ/250 ml). It follows that volume estimation errors for the stiff porridge result in considerable discrepancies between actual and estimated dietary energy and nutrient intake. This effect is compounded if stiff porridge is frequently consumed, as is often the case in communities with limited dietary diversity.
The portion size of the food under discussion is another factor to keep in mind when deciding whether misestimation by one bean bag size is considered ‘good enough’. For a small food portion, over- or underestimation by one bean bag size results in a proportionally larger error, whereas for a large food portion the impact may be smaller. This shows that the implications are also target group-specific: for children with smaller overall food portion sizes compared with, for example, adult males, less error should be tolerated. An actual intake of 125 ml by a preschool child that is underestimated by one bean bag size (60 ml) results in a 50% underestimation of the intake. An overestimation by one bean bag size (i.e. choosing a 250 ml bag to estimate the portion) will lead to a 100% overestimation. For a young child this may lead to considerable error in the quantitative assessment of diet. The intended use of the portion size data as well as knowledge of the target group and its food habits need to be clear when deciding whether an over- or underestimation by one bean bag size can be considered satisfactory. The magnitude and nature (direction) of error for a whole diet could be complex and should be carefully considered. At the same time the level of accuracy expected from portion size estimation needs to be realisticCitation16. As mentioned, in our bean bag set the volume difference between adjacent size bean bags differed (about 65 ml and 125 ml for the bean bags less and larger than 250 ml respectively), affecting the magnitude of error by food volume assessed within our study-specific operational definition of ‘acceptable’ accuracy. It is conceivable that portion misestimation could be smaller in practice, if deviance by a fraction of a bean bag is allowed. In our study reference and test object volumes were, however, always perfectly matched.
The use of bean bags, like most other volume-based PSEAs, remains an estimation. Interpretation on nutrient level needs to be done cautiously, because the volumes of the food reportedly consumed typically need to be converted to grams before analysis with food composition tables. As was the case with all studies reviewed by Almiron-Roig et al.,Citation13 only agreement in volume categories was assessed in our six sub-studies and we have no measure of the actual weight error. Amoutzopolous et al.Citation9 reserved the term ‘absolute validity’ for studies in which the portion size estimation is compared with the actual weight of the reference food. Using this definition, the estimation accuracy of bean bags is by default limited to comparative studies, as the density (weight per volume) of foods differs. The weights of a cup (250 ml) of each of popcorn and stiff porridge cannot be compared.
Participant and contextual factors must always be kept in mind when portion size estimation accuracy is determined. Participants’ characteristics (age, literacy, food awareness, sex etc.) can play a role.Citation5 How the PSEAs are presented and how the food is typically consumed (e.g. sub-studies 4 and 5) can also affect the generalisability of such data. Visual illusions have been mentioned in this regard,Citation17Citation18,Citation19,Citation20 even though Penaforte et al.Citation20 did not find an influence of plate size (9 cm vs. 24 cm) on the estimation of 400 g of pasta when reported in grams. A systematic reviewCitation21 concluded that the use of smaller dishware did not consistently result in reduced food intake. Thus, while volume estimation may be related to plate size as our and other findingsCitation22 suggest, this does not necessarily result in changes in intakes.
Our exploratory work has, in some ways, not yet provided final answers. The non-identical research design of the sub-studies does not allow data merging and the agreement analyses do not include inferential statistics, as is common among studies evaluating PSEAs.Citation5,Citation8,Citation9 In real life the estimation of the amount of food consumed would also be affected by memory and would extend beyond amorphous foods. Nonetheless this is a first testing of a novel, low-cost idea with large-scale implementation potential in resource-limited settings. As the test objects can be standardised, this contributes to reproducibility and comparability of research findings. The bean bag sets were applied with diverse populations, using amorphous reference foods in different portion sizes in cross-sectional observational studies and experimental designs to answer more specific questions more conclusively. The complexity and context-specificity of measurement validity in dietary assessment emerged clearly.
Overall (across participants, type of amorphous reference food and portion sizes), perfect portion size estimation accuracy remains challenging when sets of bean bags of known volume are used as test objects. This confirms the importance of attention to quantification of intake when performing dietary assessment, specifically on a volumetric basis. Appropriate trainingCitation14 prior to the assessment has been systematically reviewed in this regard. Hausman et al.Citation23 even explored this among young children.
As mentioned, bean bags have properties that make them attractive as PSEAs in dietary assessment, especially of amorphous foods in resource-limited settings. Amoutzopolous et al.Citation9 recommend that portion size estimation elements should be versatile (useful for more than one food). Bean bags exceed this requirement as they are not only applicable for many foods in the assessment of dietary intake, but could also be core to nutrition education. For the latter, bags of different colours (e.g. beige for the starchy foods, reddish-brown for meats and greenish for vegetables/fruit) can be combined or stacked on a plate to illustrate proportions as is typically done in the so-called plate model of nutrition education (c).
Conclusion and recommendations
The experimental sub-studies suggest that for students at a tertiary South African institution, bean bags (preferably not dark-coloured) could be part of a PSEA kit for the quantification of amorphous foods. Presenting bean bags in conjunction with appropriately sized dishware (e.g. plates) relevant to the target group and the food portion appears meaningful. Life-size, individual, food-specific photograph series, especially for large portion sizes such as staple foods, show additional potential. In Supplementary file 2 practical tips for making bean bags are summarised to guide affordable standardisation and customisation in resource-limited settings and to promote repeatability and comparability in future studies.
For future research, all the recommendations/scoring criteria of previous researchersCitation8,Citation9 should be applied. As was shown in other studies (e.g.Citation24,Citation25) we found that the same PSEA can result in different portion size estimation accuracy in different populations for different amorphous foods/food types and portion sizes. The presentation of the PSEA is another factor to consider. It follows that estimation inaccuracy of food quantities is not only associated with a particular PSEA, but may be an inherent participant-, food type- and context-related challenge. The limited reproducibility we observed tentatively supports this assertion.
For better dietary intake data, future studies should not only assess the short-term ability to match a particular food volume to a bean bag volume but include cognitive and attitudinal attributes of participants such as size perception, food knowledge and awareness, conceptualisation and recall memory (e.g. by assessing the estimation accuracy 24 hours following exposure), as well as acceptability of the bean bags among participants and researchers/practitioners.Citation13,Citation15,Citation26 As bean bag sets can be standardised as test objects, future studies could systematically build on our exploratory findings, up to the point of validation,Citation27 as comparability of studies consistently emerges as a challenge in knowledge synthesis studies.Citation5,Citation9,Citation12 We are not aware of previous studies that have assessed the estimation accuracy of graduated series of generic, 3-D, volumetric PSEAs. In general, the investigations are weight- (as opposed to volume-) based evaluations of portion estimations.Citation5
Best practice in dietary methodology stands to gain credibility through the adoption of a systematic and rigorous approach to testing portion size estimation accuracy, whilst accepting that validity is not transferable. The accuracy needed in the quantitative dietary assessment of an individual client/patient in clinical practice may differ from the requirements in nutrition research, monitoring and surveillance. The required portion size estimation accuracy, intended use of the dietary intake data and available resources determine the role of bean bags in the dietary assessment of a particular target group and setting.
Supplemental Material
Download PDF (145.4 KB)Supplemental Material
Download PDF (2.2 MB)Acknowledgements
The diligence of the dietetics students who conducted the six sub-studies as part of their B Dietetics qualification at the University of Pretoria under the supervision of the first author is acknowledged. Their names appear on the posters displayed in Supplementary file 1.
Disclosure statement
No potential conflict of interest was reported by the authors.
Supplemental data
Supplementary data for this article can be accessed online at https://doi.org/10.1080/16070658.2024.2336290.
References
- Miller V, Webb P, Micha R, et al. Defining diet quality: a synthesis of dietary quality metrics and their validity for the double burden of malnutrition. Lancet Planet Health. 2020;4:e352–e370. https://doi.org/10.1016/S2542-5196(20)30162-5
- Burrows T, Goldman S, Rollo M. A systematic review of the validity of dietary assessment methods in children when compared with the method of doubly labelled water. Eur J Clin Nutr. 2020;74:669–81. https://doi.org/10.1038/s41430-019-0480-3
- Burrows TL, Ho YY, Rollo ME, et al. Validity of dietary assessment methods when compared to the method of doubly labelled water: A systematic review in adults. Front Endocrinol. 2019;10:850. https://doi.org/10.3389/fendo.2019.00850
- Batista LD, de França NAG, Fontanelli MdM, et al. Misreporting of dietary energy intake obtained by 24 h recalls in older adults: a comparison of five previous methods using doubly labeled water. Eur J Clin Nutr. 2022;76:535–43. https://doi-org.uplib.idm.oclc.org/10.1038/s41430-021-00998-z
- Whitton C, Ramos-García C, Kirkpatrick S, et al. A systematic review examining contributors to misestimation of food and beverage intake based on short-term self-report dietary assessment instruments administered to adults. Adv Nutr. 2022;13:2620–65. https://doi.org/10.1093/advances/nmac085
- Friedman A, Bennett TG, Barbarich BN, et al. Food portion estimation by children with obesity: The effects of estimation method and food type. J Acad Nutr Diet. 2012;112:302–7. https://doi.org/10.1016/j.jada.2011.10.008
- Hooper A, McMahon A, Probst Y. The role of various forms of training on improved accuracy of food-portion estimation skills: a systematic review of the literature. Adv Nutr. 2019;10:43–50. https://doi.org/10.1093/advances/nmy060
- De Vlieger NM, Weltert M, Molenaar A, et al. A systematic review of recall errors associated with portion size estimation aids in children. Appetite. 2020;147:104522. https://doi.org/10.1016/j.appet.2019.104522
- Amoutzopoulos B, Page P, Roberts C, et al. Portion size estimation in dietary assessment: a systematic review of existing tools, their strengths and limitations. Nutr Rev. 2020;78:885–900. https://doi.org/10.1093/nutrit/nuz107
- Gibson AA, Hsu MSH, Rangan AM, et al. Accuracy of hands v household measures as portion size estimation aids. J Nutr Sc. 2016;5:c29. https://doi.org/10.1017/jns.2016.22
- MacMillan Uribe AL, Patterson J. Are nutrition professionals ready for artificial intelligence? J Nutr Educ Behav. 2023;55:623. https://doi.org/10.1016/j.jneb.2023.07.007
- Centers for Disease Control and Prevention. Measuring guides for the dietary recall interview. Available from: https://www.cdc.gov/nchs/nhanes/measuring_guides_dri/measuringguides.htm. Accessed January 07, 2023.
- Almiron-Roig E. Portion size estimation in dietary assessment: a systematic review of existing tools, their strengths and limitations. Nutr Rev. 2020;78:885–900. https://doi.org/10.1093/nutrit/nuz107
- Cade JE, Warthon-Medina M, Albar S, et al. DIET@NET: best practice guidelines for dietary assessment in health research. BMC Med. 2017;15:2020. https://doi.org/10.1186/s12916-017-0962-x
- Almiron-Roig E, Navas-Carretero S, Enery P, et al. Research into food portion size: methodological aspects and application. Food Funct. 2018;9:715–39. https://doi.org/10.1039/c7fo01430a
- Hernández T, Wilder L, Kuehn D, et al. Portion size estimation and expectation of accuracy. J Food Comp Anal. 2006;19(Suppl):S14–S21. https://doi.org/10.1016/j.jfca.2006.02.010
- Dörsam AF, Weiland A, Sauer H, et al. The role of dishware size in the perception of portion size in children and adolescents with obesity. Nutrients. 2021;13:2062. https://doi.org/10.3390/nu13062062
- Petit O, Velasco C, Spence C. Are large portions always bad? using the Delboeuf illusion on food packaging to nudge consumer behavior. Market Letters. 2018;29:435–49. https://doi.org/10.1007/s11002-018-9473-6
- Ordabayeva N, Chandon P. In the eye of the beholder: visual biases in package and portion size perceptions. Appetite. 2016;103:450–7. https://doi.org/10.1016/j.appet.2015.10.014
- Penaforte FRO, Japur CC, Diez-Garcia RW, et al. Plate size does not affect perception of food portion size. J Hum Nutr Diet. 2014;27(Suppl. 2):214–9. https://doi.org/10.1111/jhn.12111
- Robinson E, Nolan S, Tudur-Smith C, et al. Will smaller plates lead to smaller waists? A systematic review and meta-analysis of the effect that experimental manipulation of dishware has on energy consumption. Obes Rev. 2014;15:812–21. https://doi.org/10.1111/obr.12200
- McClain A, van den Bos W, Matheson D, et al. Visual illusions and plate design: The effects of plate rims widths and rim coloring on perceived food portion size. Int J Obes. 2014;38:657–62. https://doi.org/10.1038/ijo.2013.169
- Hausman NL, Borrero JC, Fisher A, et al. Teaching young children to make accurate portion size estimations using stimulus equivalence paradigm. Behav Interven. 2017;32:121–32. https://doi.org/10.1002/bin.1466
- Lucassen DA, Willemsen RF, Geelen A, et al. The accuracy of portion size estimation using food images and textual descriptions of portion sizes: an evaluation study. J Hum Nutr Diet. 2021;34:945–952. https://doi-org.uplib.idm.oclc.org/10.1111/jhn.12878
- Mushquash AR, Rasquinha AM, Friedman A, et al. Examining the accuracy and use of portion size estimation aids in parents of children with obesity: A randomized controlled trial. J Nutr Educ Behav. 2018;50:918–23. https://doi.org/10.1016/j.jneb.2018.06.0051
- Faulkner GP, Livingstone MBE, Pourshahidi LK, et al. An evaluation of portion size estimation aids: consumer perspectives on their effectiveness. Appetite. 2017;114:200–8. https://doi.org/10.1016/j.appet.2017.03.027
- Kirkpatrick SL, Baranowski T, Subar AF, et al. Best practices for conducting and interpreting studies to validate self-report dietary assessment methods. J Acad Nutr Diet. 2019;119:1801–16. https://doi.org/10.1016/j.jand.2019.06.010