
ABSTRACT
Chemotherapeutic regimens containing sorafenib are widely used in salvage treatment for patients with relapsed and refractory acute leukemia, especially those with FLT3-ITD mutations. However, the therapeutic effects in individuals are heterogeneous, and the effective maintenance period is relatively short. Our clinical analysis showed patients with high c-kit (CD117) expression in leukemia cells generally had a better response to sorafenib, but the reason for this finding was not clear. c-kit (CD117) is a receptor tyrosine kinase, and its signal inactivation and hydrolytic metabolism are regulated by the CBL protein, a Ring finger E3 ubiquitin ligase, encoded by the c-CBL gene. And we also found that the c-CBL gene expression in refractory and relapsed patients was significantly lower than that in healthy hematopoietic stem cell donors. Therefore, we assumed that there is a relationship among c-CBL gene function, high expression of c-kit (CD117) and a better clinical response to sorafenib. To confirm this hypothesis, we packaged interfering lentiviruses and overexpressed adenoviruses targeting the c-CBL gene respectively, and infected leukemia cell lines with these viruses to regulate the expression of the c-CBL gene, and observed the subsequent changes of these cells in various biological behaviors. Our results showed when the c-CBL gene was silenced, the cells proliferation was accelerated, drug sensitivity to cytarabine or sorafenib was decreased, and apoptosis ratio was decreased. And all these phenomena were reversed when the gene was overexpressed, which confirmed the expression of c-CBL gene was related to drug resistance in leukemia cells. At last, we explored the possible molecular mechanisms underlying these phenomena.
1. Introduction
Relapse and refractoriness seriously affect the overall therapeutic effects in acute leukemia [Citation1–3]. Many studies have reported that salvage treatment, including sorafenib, can be used in relapsed and refractory acute leukemia patients [Citation4–9]. Our preliminary study also confirmed a similar effect, but we found that the therapeutic response of different patients varies substantially [Citation10]. Patients with high expression (>60%) of c-kit (CD117) seems had better responded than those without high expression, but the reason is not clear, even though they all had the target (CD117) for sorafenib. As we all know, c-kit is a member of the tyrosine kinase receptor family. And for tyrosine kinase signaling, a large number of studies in recent years have confirmed that it is accurately regulated by two systems [Citation11–17]. One is an activation system; the other is an inactivation system. In physiological conditions, there is a dynamic balance between signal activation and inactivation to ensure that kinase signal information can be accurately transmitted in diverse intracellular processes [Citation18–23]. The CBL protein, a Ring finger E3 ubiquitin ligase with specific tyrosine kinase binding (TKB) domain encoded by the c-CBL gene, is responsible for inhibiting all kinds of tyrosine kinase in an irreversible endocytosis and hydrolysis manner through the ubiquitin proteasome pathway and is considered the most important negative regulator of tyrosine kinase signaling [Citation19, Citation24–26]. Therefore, based on the balance regulation theory of tyrosine kinase signaling, we think patients with high expression of tyrosine kinase receptors (e.g. c-kit) may be related to insufficient activity of the intracellular inactivation system, especially for CBL [Citation27, Citation28].Thus, take these together, we speculate that there may be a relationship between c-CBL gene function and c-kit expression, as well as the therapeutic response of sorafenib. To clarify the above relationship, we conducted a study on the function of the c-CBL gene and cell chemoresistance and analyzed the effects of sorafenib on the c-CBL gene, c-kit expression and some related signaling pathways.
2. Materials and methods
2.1. Antibodies and chemicals
Antibodies were from Abcam PLC (UK) and included rabbit anti-CBL (ab32027), anti-CBL (phosphoY731) (ab52855), anti-c-Kit (ab32363), anti-P-glycoprotein (ab170904), anti-PDGFR-beta (ab32570), anti-ERK1/2 (ab223500) and anti-beta-actin (ab8227); rabbit anti-Akt (9272), anti-p308-Akt (13038) and anti-p-ERK1/2 (4370s) were from CST, Inc. (USA). The horseradish peroxidase (HRP)-conjugated secondary antibodies (111-001-003) were from Jackson IR (USA); SCF (RP8631) was from Invitrogen, Inc. (USA). Sorafenib (S7397) was from Selleck Chemicals (USA), and cytarabine (cytosar) was from Pfizer, Inc. (USA). DMEM, RPMI-1640 medium, fetal bovine serum (FBS), penicillin, and streptomycin sulfate were obtained from Invitrogen, Inc. (USA).
2.2. Virus packaging
The adenovirus and lentivirus targeting c-CBL gene expression were obtained from frozen storage after use in our previous study. The packaging process and verification results of the virus are detailed in the supplementary materials.
2.3. Cell culture, transfection, and treatment
All cells used in this study were originally obtained from ATCC. HL60 and THP1 leukemia cells were gifts from Dr. Guopan Yu (The Nanfang Hospital of Southern Medical University) and were cultured in RPMI-1640 medium (Gibco) with 10% FBS and antibiotics (100 U/mL penicillin and 100 mg/mL streptomycin); 293 and 293 T cells were grown in Dulbecco’s modified Eagle’s medium containing 10% fetal bovine serum. All cells were maintained at 37 °C in a 5% CO2 atmosphere.
For transfection, 5 × 10⁴ HL60 or THP1 cells in 500 μl of complete medium containing polybrene (5 μg/ml) were cultured in 24-well plates. According to the results of virus titration and preliminary experiments, the corresponding virus stock solution volume was added to the cells at an MOI = 100, blown slightly and mixed well. Next, an equal volume of complete medium containing polybrene (5 μg/ml) was added for infection for 12-16 h. Then, the virus-containing medium was discarded, replaced with fresh complete medium, and incubated for 72 h.
In this study, the final concentrations of Ara-C, sorafenib and SCF used to stimulate cell apoptosis or proliferation were 100 μg/ml, 10 μM and 10 ng/ml, respectively.
2.4. Cell viability assay
Cell proliferation was measured by CCK-8 colorimetric assays. Cells (1× 10⁴ cells/well) were seeded in 96-well plates for 2 h and then treated with or without SCF (10 ng/L). Absorbance was measured at 450 nM at 0, 24, 72 and 120 h. The data are shown as the mean ± SD of at least three wells from three independent experiments.
2.5. Patients and characteristics
In this study, we analyzed bone marrow mononuclear cells of 20 patients with relapsed and refractory acute myeloid leukemia (including one CMML patient); the samples were cryopreserved in the sample database of the Department of Hematology in Zhujiang Hospital of Southern Medical University. The time was between May 2016 and December 2018. In the same period, 4 healthy hematopoietic stem cell transplant donors were selected as controls. Bone marrow mononuclear cells collected from patients and donors were isolated via Ficoll density centrifugation and frozen at −80 °C. All subjects provided signed informed consent in accordance with the Declaration of Helsinki. (For detailed patient characteristics, see the supplementary material.)
2.6. RNA isolation and real-time PCR
Cells were lysed with TRIzol (TaKaRa), and RNA was extracted according to the manufacturer's instructions. Five hundred nanograms of RNA was reverse transcribed to cDNA using the PrimeScript RT Master Mix Kit (TaKaRa). Quantitative reverse transcription-PCR (qRT-PCR) was performed with 2 μl of cDNA per reaction using the SYBR Premix Ex Taq kit (TaKaRa).
The forward and reverse primers were as follows:
for c-CBL:
F 5'-GGTGCCACCACGACTTGAC-3’
R 5'-CAGTTCCAAGAGCAGAAGCACTT-3’;
for GAPDH:
F 5′-CACATGCCTCCAAGGAGTAA-3′
R 5′-TGAGGGTCTCTCTTCCTCTTGT-3′.
2.7. Apoptosis and cell cycle analysis
Annexin V-FITC/PI double staining assay was used for apoptosis analysis. 1 × 10⁶ cells were selected, rinsed with PBS, centrifuged and resuspended with 500μl binding buffer. 5μl Annexin V-FITC was mixed, then 10μl PI was mixed. The test was performed after reacting at room temperature for 15 min. cell cycle analysis was performed by PI-RNase A methods. Specifically,1 × 106 cells were centrifuged and washed with PBS, then cells were fixed with 1 ml pre-cooled ethanol (70%) at 4°C overnight. Before detection, the ethanol was discarded and cells were washed with PBS again,1 ml mixed dye containing PI (100μg/ml) and RNase A (100μg/ml) was added, reaction time 30 min.
2.8. Western blot analysis
Cell lysate preparation and immunoblotting were performed with standard procedures. Briefly, cells were harvested, total protein was extracted with lysis buffer (RIPA), and a protein assay was carried out with a BCA kit (Pierce, USA). Samples were run on sodium dodecyl sulfate (SDS) gels and blotted on polyvinylidene difluoride (PVDF) membranes. The membranes were blocked with 5% skim milk and probed with the primary antibodies anti-CBL, anti-PDGRB, anti-C-kit, anti-MDR1, anti-ERK, anti-Akt, anti-β-actin, anti-phospho-CBL, anti-phospho-ERK, and anti-phospho-Akt, followed by a secondary antibody. Finally, signals on the membranes were visualized using an enhanced chemiluminescence reagent (Millipore; USA).
2.9. Statistical analysis
The data are expressed as the mean ± standard deviation (SD). Differences between groups were compared using Student’s t test, and non-normally distributed data were compared using the Mann-Whitney U test. ANOVA was used for comparison of multiple groups of means, and SPSS Statistics 19.0 was used for statistical analysis. P < 0.05 was considered statistically significant.
3. Results
3.1. c-CBL gene expression in donors and patients
We examined the expression of the c-CBL gene in 4 healthy donors and 20 patients with relapsed and refractory AML over the same period. Approximately half of the patients had high c-kit expression (>60%), and several of them received salvage therapy, including sorafenib. The median mRNA level of the c-CBL gene in the leukemia patients was 0.408 (0.07-1.02) and that in the healthy donors was 1.025 (0.90-1.14) (). This finding indicates that c-CBL gene expression in the patients with refractory or relapsed leukemia was generally lower than that in the healthy donors ().
Figure 1. Relative expression level of the c-CBL gene in healthy donors and refractory or relapsed patients
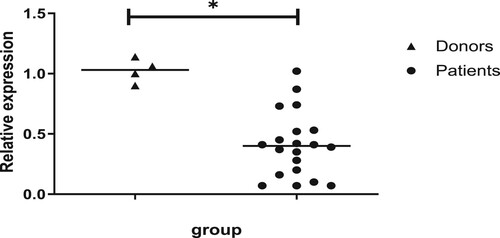
Table 1. Characteristics of patients and donors.
3.2. Cell proliferation and c-CBL gene expression
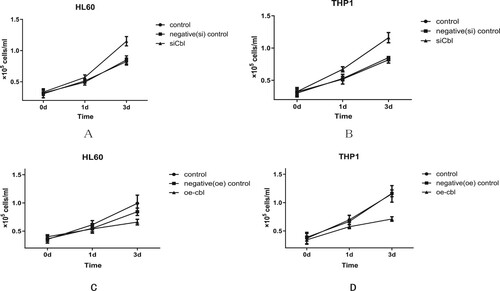
Compared with that of the control and negative control cell lines, the cell proliferation of HL60 and THP1 cells was increased with c-CBL gene silencing. The difference was statistically significant on Day 3, and the cell numbers (1 × 10⁵ cells/ml) for HL60 cells in the silencing, control and negative control groups were 1.15 ± 0.08, 0.82 ± 0.57 and 0.85 ± 0.07, respectively (P < 0.05) ((a)). For THP1 cells, the numbers were 1.15 ± 0.06, 0.82 ± 0.06 and 0.85 ± 0.07, respectively (P < 0.05) ((b)). Conversely, when the c-CBL gene was overexpressed, the proliferation of HL60 and THP1 cells decreased significantly. Additionally, on Day 3, the cell numbers (1 × 10⁵ cells/ml) for HL60 cells in the overexpression, control and negative control groups were 0.66 ± 0.05, 0.99 ± 0.15 and 0.84 ± 0.07, respectively (P < 0.05)((c)), and for THP1 cells, they were 0.71 ± 0.04, 1.15 ± 0.15 and 1.16 ± 0.06, respectively (P < 0.05)((d)).
Figure 2. Cell proliferative activity was affected by c-CBL gene expression. Compared with that of the control and negative (silenced) control group cells, the proliferative activity of HL60 (A) and THP1 (B) cells with c-CBL gene silencing was slightly increased. Under similar conditions, the proliferation of HL60 (C) and THP1 (D) cells decreased when the c-CBL gene was overexpressed. (For details, see the supplementary materials.)
3.3. Stimulated proliferation and c-CBL gene expression
We found that regulating the expression level of the c-CBL gene can lead to varied proliferative activity in leukemia cell lines. Does this phenomenon also exist under ligand stimulation? Or can ligand stimulation counteract the effect of cell proliferation due to different c-CBL gene expression levels? To address this issue, we selected HL60 and THP1 cells, which have different c-kit (CD117) expression levels (approximately 34% in HL60, 2% in THP1), and treated them with stem cell factor (SCF), a ligand of the receptor tyrosine kinase c-kit.
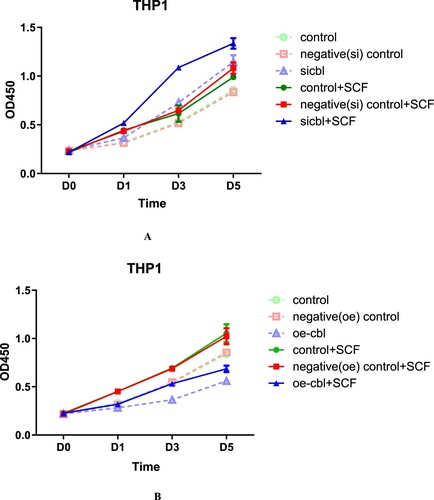
The final results showed that regardless of the expression level of the c-CBL gene and c-kit receptor, SCF could promote proliferation of both leukemia cell lines, but the effect was affected by the c-CBL gene expression status. c-CBL gene silencing resulted in the strongest SCF-induced proliferation ( and ). In contrast, when the c-CBL gene was overexpressed, the proliferation-promoting activity was weakest( and ). This finding suggests that the expression level of the c-CBL gene only affects the sensitivity of cells to SCF stimulation and will not offset the response to SCF.
Figure 3. The proliferation-promoting effect of SCF on HL60 cells with different c-CBL expression statuses. HL60 cells with different c-CBL gene expression statuses (A and B) were stimulated with SCF (10 ng/ml) for 24 h. Compared with that of each corresponding nonstimulated group, increasing OD values were observed in every stimulated (SCF) group, and the differences in each pair were statistically significant. In addition, regardless of the presence of the stimulus, the OD values were negatively associated with the c-CBL gene status. That is, the lower the c-CBL gene expression was, the higher the OD values were. During the whole observation period from Days 1–5, the OD values of the c-CBL silencing group were higher than those of any other group after SCF stimulation (for details, see the supplementary materials).
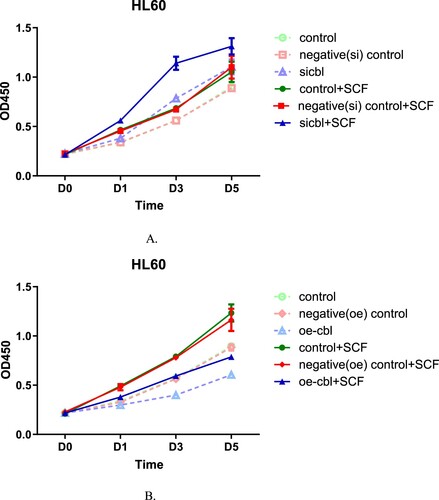
Figure 4. The proliferation-promoting effect of SCF on THP1 cells with different c-CBL expression statuses. THP1 cells with different c-CBL gene expression statuses (A and B) were stimulated with SCF (10 ng/ml) for 24 h. The results were similar to those of HL60 cells; regardless of the presence of SCF, the OD values were associated with the cellular c-CBL gene status. That is, the lower the c-CBL gene expression was, the higher the OD values were. During the whole observation period from Days 1–5, the OD values of the c-CBL silencing group were higher than those of any other group after SCF stimulation (for details, see the supplementary material).
3.4. Cell cycle and c-CBL gene expression
We altered the expression of the c-CBL gene, and the accompanying changes in the cell cycle of these two kinds of leukemia cells were similar. When the c-CBL gene was silenced, the major change was a slight decrease in the S phase proportion of these leukemia cells. For HL60 cells, the percentage decreased from 37.89 ± 2.34% to 29.41 ± 3.46% ((a)), and for THP1 cells, it decreased from 37.65 ± 5.23% to 28.12 ± 4.54%((b)). Since S phase is mainly responsible for cell DNA synthesis, we hypothesized that c-CBL gene silencing can partially reduce DNA synthesis in leukemia cells.
Figure 5. Percentage of HL60 (A) and THP1 (B) cells in different cell cycle phases after c-CBL gene silencing (si) and overexpression (oe) (for details, see the supplementary materials).
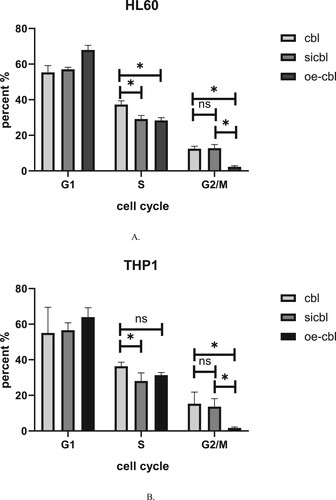
When the c-CBL gene was overexpressed, a notable phenomenon was observed in these two kinds of cells: the proportion of cells in the G2/M phase significantly decreased. For HL60 cells, the percent decreased from 13.34 ± 2.38% to 1.93 ± 1.59% ((a)), and for THP1 cells, it decreased from 11.89 ± 4.94% to 1.08 ± 2.19% ((b)). This result confirms the previous findings that overexpression of the c-CBL gene can significantly inhibit cell proliferation. In addition, a slight increase in the G1 phase in the HL60 or THP1 cell treatment group was observed regardless of the c-CBL gene expression status, which may be related to the experimental reagents, but these changes were not statistically significant.
3.5. Cell apoptosis and c-CBL gene expression
The proliferative activity of leukemia cells was affected by different expression levels of the c-CBL gene, but what about the effect on cell apoptosis? To investigate this issue, we used Ara-c (final concentration 100 μg/ml) and sorafenib (final concentration 10 μM) to treat these two leukemia cell lines and their control cells with different c-CBL gene statuses for 24 h. The percentage of apoptotic cells was detected by flow cytometry with Annexin V-FITC/PI double staining. The results showed that the HL60 and THP1 cells with c-CBL gene silencing were less sensitive to Ara-c and sorafenibinduced apoptosis, while when the c-CBL gene expression was upregulated, the sensitivity of these cells to Ara-c and sorafenib was recovered, and cell apoptosis was increased.
For HL60 and THP1 control cells, the apoptosis rates with Ara-C were 36.53 ± 0.70% ((a)) and 34.43 ± 1.56% ((b)), respectively (the result was close to that of sorafenib treatment), and they decreased to 27.57 ± 1.63% ((a)) and 27.33 ± 2.05% ((b)), respectively, after c-CBL gene silencing, increasing to 46.33 ± 2.31% ((a)) and 48.67 ± 3.04% ((b)), respectively, when the c-CBL gene was overexpressed. Similar to the above results, when these two cell lines were treated with sorafenib, the apoptosis rates of the gene-silenced cells were 26.97 ± 2.47% ((a)) and 30.67 ± 2.08% ((b)), respectively, and they were 46.19 ± 1.48% ((a)) and 57.77 ± 2.60% ((b)) with gene overexpression.
Figure 6. Apoptosis of HL60 (A) and THP1 (B) cells with different c-CBL gene statuses treated with cytarabine or sorafenib for 24 h. FACS was used to test the apoptotic cell ratio with Annexin V-FITC/PI double staining, and the results were averaged from three independent experiments. (For details, see the supplementary materials.)
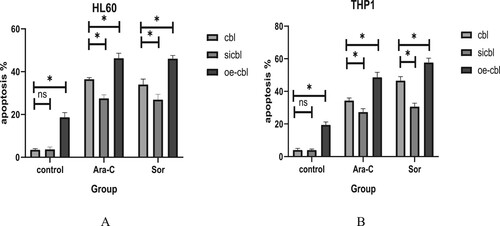
These phenomena confirmed that manipulation of c-CBL gene expression can significantly change the apoptotic induction response of cells to drugs, whether it is cytotoxic drugs or tyrosine kinase inhibitors. In addition, the overexpression of the c-CBL gene may cause dysfunctional signaling in tumor cells. In the absence of drug intervention, obvious spontaneous apoptosis (approximately 10-15%) was observed after the overexpression of the c-CBL gene in these leukemia cells ((a,b), oe-cbl group in control column).
3.6. Drug sensitivity and c-CBL gene expression
Subsequently, we used the CCK-8 colorimetric method to verify whether the drug sensitivity of the two leukemia cell lines to sorafenib (final concentration range 0∼50 μM for 24 h) also changed with c-CBL gene expression status and calculated the cell IC50 values at different gene expression levels.
The IC50 values for HL60 cells in the control,silencing and overexpression groups were 6.053, 23.83 and 1.481 μM, respectively ().For THP1 cells, the corresponding drug concentrations were 5.176, 21.16 and 0.9667 μM, respectively ().
Figure 7. Growth inhibition of HL60 cells with different c-CBL gene statuses treated with sorafenib for 24 h. The IC50 values were calculated by the CCK-8 colorimetric method. The results showed that the sorafenib IC50 concentration was increased with the downregulation of c-CBL gene expression and decreased upon c-CBL gene overexpression.
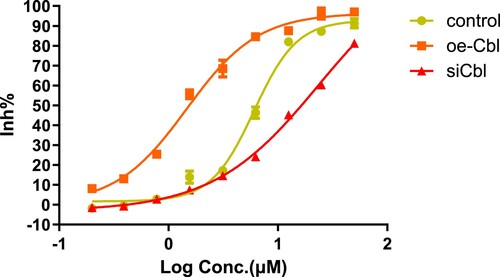
Figure 8. Growth inhibition of THP1 cells with different c-CBL gene statuses treated with sorafenib for 24 h. Under the same conditions, the IC50 values of sorafenib in THP1 cells were similar to those in HL60 cells and were also affected by c-CBL gene status.
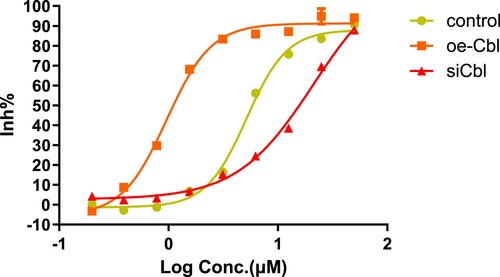
The results confirmed that regulation of c-CBL gene expression can significantly change drug sensitivity in both leukemia cell lines. In summary, the drug sensitivity of leukemia cells decreased with c-CBL gene silencing and increased with c-CBL gene overexpression.
3.7. Sorafenib treatment and CBL protein expression
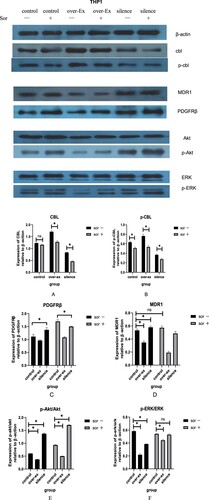
The difference in the expression level of the c-CBL gene can affect cell sensitivity to sorafenib. Conversely, can sorafenib also affect the expression of the c-CBL gene and its subsequent transcription product? Therefore, we used western blotting to detect the expression of the CBL protein and some related signaling proteins in HL60 and THP1 cells with different c-CBL gene expression statuses with or without sorafenib treatment.
For the CBL protein, the results showed that regardless of the baseline gene expression of c-CBL, the total CBL (T-CBL) and phosphorylated CBL (p-CBL) protein levels in HL60 ((a,b)) and THP1 ((a,b)) cells were downregulated after sorafenib treatment, though some of the downregulations were no statistical difference. The degree of downregulation of these two proteins was affected by the different baseline expression levels of the T-CBL and p-CBL proteins in each group of cells.
Figure 9. Related protein expression in HL60 cells with different c-CBL gene statuses with or without sorafenib(10μM) treatment for 24 h.
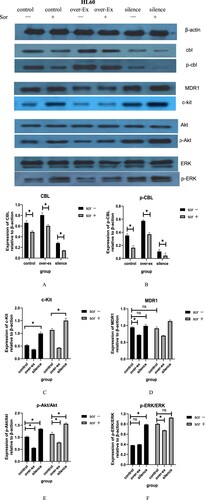
Figure 10. Related protein expression in THP1 cells with different c-CBL gene statuses with or without sorafenib(10μM) treatment for 24 h.
3.8. Sorafenib treatment and receptor protein expression
According to balance regulation theory on tyrosine kinase signal, the expression of tyrosine kinase receptors, such as PDGFRβ and c-kit, was significantly affected by CBL protein. As expected, the downregulation of the CBL proteins caused by lentivirus virus infection or sorafenib resulted in the upregulation of the c-kit ((c)) and PDGFRβ ((c)) receptors in each group of cells. When CBL protein was upregulated, the effect was reversed. Similarly, the regulation degree was related to the different baseline levels of each receptor in these cells.
c-kit was highly expressed in HL60 cells and low expressed in THP1 cells (about 33% on HL60, 2% on THP1), so the degree of upregulation of c-kit in HL60 cell cytomembranes was significantly higher than that in THP1 cells after sorafenib treatment. In contrast, PDGFRβ was relatively highly expressed in THP1 cells (about 77%) and almost no expression in HL60 cells; under the same conditions, the upregulation of PDGFRβ in the THP1 cell cytomembrane was more obvious than that in HL60 cells. (Date not show).
ABCB1 (MDR1) is one of the members of the ABC (ATP-binding cassette) protein family. P-glycoprotein, the transcriptional product of MDR1, is widely expressed on the membrane surface of many tumor cells, which leads to chemoresistance in tumor cells to a variety of drugs. Our results displayed that when the c-CBL gene was overexpressed or silenced, the expression of MDR1 ( and ) was slightly downregulated or upregulated.
However, in the sorafenib treatment groups, along with a decrease in the T-CBL and p-CBL proteins, we did not observe a further increase in MDR1 as expected, especially in the THP1 cell group ((d)). We speculate that the therapeutic effect of sorafenib is not only the downregulation of CBL protein; the effect of other signaling pathways in this process, which also affect the expression of MDR1, cannot be ruled out.
3.9. Sorafenib treatment and signaling pathway-related proteins
For the PI3k/Akt pathway, the ratio of p-Akt/Akt was decreased when the c-CBL gene was overexpressed in these two leukemia cell lines; in contrast, the ratio was significantly enhanced when the gene was silenced. The downregulation of the T-CBL and p-CBL proteins caused by sorafenib further amplified these changes ( and ). These results indicate that CBL protein overexpression can inhibit the PI3k/Akt signaling pathway, while sorafenib results in the opposite effect.
For the MAKP/ERK pathway, the results were slightly different. For HL60 cells, the p-ERK/ERK ratio unexpectedly did not further decrease when the c-CBL gene was overexpressed, similar to the results in the control group ((f)). For THP1 cells, the ratio of p-ERK/ERK was not significantly increased in the control group after sorafenib treatment ((f)). The reasons for these phenomena are not clear and need to be explored in subsequent studies.
4. Discussion
The accurate tyrosine kinase signaling information is determined by the signal duration and signal intensity under physiological conditions. For accurate and appropriate information transmission, there must be a set of signal inactivation (negative) systems that closely correspond to signal activation (positive) systems in the cell [Citation17, Citation29].
According to the difference of regulatory mechanism, we now know that there are two important tyrosine kinase negative regulatory modes in cells: one is temporary inactivation, which is achieved by kinase dephosphorylation, and the other is permanent inactivation, which is achieved through thorough hydrolysis of the kinase protein. Obviously, hydrolytic inactivation has a lasting effect on tyrosine kinase signaling [Citation30].
Cbl family proteins (including c-CBL, Cbl-b and Cbl-c) are members of the E3 ubiquitin ligase family, which belongs to the ubiquitin proteasome signaling pathway in a broad sense. Due to the special tyrosine kinase binding (TKB) region, the ubiquitination hydrolytic substrate of the CBL protein is limited to tyrosine kinases, including cytomembrane receptor type and cytoplasmic protein type [Citation22, Citation31, Citation32], so the CBL protein is considered the most critical negative regulator of tyrosine kinase [Citation30, Citation33, Citation34].
Our early clinical observations found the response to salvage treatment containing sorafenib in different refractory and relapsed leukemia patients varies substantially. Patients with high c-kit expression (>60%) generally had a better response than those without high expression, but the reason is unclear [Citation10, Citation35, Citation36]. Since c-kit is a receptor-type tyrosine kinase, its expression level was influenced by the CBL protein; thus, we presumed that the better response of patients to sorafenib were essentially related to the expression of CBL protein. High c-kit expression should just be a superficial phenomenon [Citation27, Citation37].
Therefore, we hypothesize that insufficient c-CBL gene function leads to insufficient hydrolysis of tyrosine kinase signals and produces persistent signal activation, seriously disturbing the intracellular kinase signal balance of activation (positive) and inactivation (negative), resulting in excessive cell proliferation and apoptotic resistance.
To verify this hypothesis, we conducted this study to explore the relationship between c-CBL gene function and chemoresistance, as well as the possible molecular mechanisms. HL60 and THP1 leukemia cells were chosen in this experiment because c-kit and the PDGFRβ receptor tyrosine kinase were highly expressed in these two leukemia cell lines, respectively. Interfering lentivirus or overexpression adenoviruses that target the c-CBL gene were packaged to infect these leukemia cells to achieve knockdown or enhance c-CBL gene expression.
Our results showed that both leukemia cell lines with c-CBL gene knockdown exhibited increased proliferation and chemoresistance and decreased apoptosis. Nevertheless, all of these phenomena were reversed when the c-CBL gene was overexpressed. Furthermore, the bone marrow mononuclear cell results revealed that c-CBL gene expression was generally significantly lower in the patients with refractory and relapsed leukemia than in the healthy hematopoietic stem cell donors, which is similar to the effect when c-CBL is silent.
Combining these results, we concluded that the chemoresistance of leukemia cells is closely related to low expression of the c-CBL gene, and maybe one reasonable explanation for chemoresistance in refractory and relapsed patients was the low c-CBL gene expression.
Subsequently, we chose sorafenib to treat these two leukemia cell lines and their virus-infected cells. Protein tests showed that regardless of the expression level of the c-CBL gene, total CBL protein (T-CBL) and its phosphorylated protein (p-CBL) were significantly decreased after treatment by sorafenib; in fact, these results were somewhat unexpected. At the same time, as we expected, the expression of c-kit and PDGFRβ was obviously increased by a feedback mechanism, and these results are consistent with previous reports [Citation31, Citation38, Citation39].
Based on these results and given the tyrosine kinase signal balance regulation theory, together with our clinical observations, we believe that in refractory and relapsed leukemia patients without high c-kit expression, there must be partial CBL protein exist in the cells, which preserves some hydrolytic inactivation function for tyrosine kinase signaling. If sorafenib is selected to treat such patients, it will inevitably lead to the downregulation of T-CBL and p-CBL protein, which impairs the intrinsic cellular hydrolytic inactivation function of CBL protein, and increases cell chemoresistance. Although sorafenib has an inhibitory effect on tyrosine kinase signal activation to some extent, the final effect may amplify the imbalance in activation (positive) and inactivation (negative) signal regulation. At last, chemoresistance of leukemia cells was increased, and patients failed to benefit from sorafenib salvage therapy. In contrast, if patients with high c-kit expression, from the results of our study, we can deduce that the intracellular function of the c-CBL gene must be severely reduced or absent. The effect of sorafenib therapy was only reflected in tyrosine kinase signal activation blockade because the c-CBL gene and its translated protein have no room to further downregulated. Therefore, the final effect was the imbalance between tyrosine kinase signaling positive and negative regulation was alleviated, and cell chemoresistance was reduced.
Regarding signaling pathways, our research found that only the PI3K/AKT signaling pathway showed significant suppression when the c-CBL gene was overexpressed in these two leukemia cell lines, but when the c-CBL gene was silenced, this pathway showed reactivation, and these changes were not observed in the MAPK/ERK signaling pathway. Therefore, we can conclude that the CBL protein acts as a speed-limiting switch, which controls the connection between tyrosine kinase and its abundant downstream proliferative signals through the PI3K/AKT signaling pathway.
In addition, the relationship between tyrosine kinase inhibitors and ABC family proteins is still unclear. Some inhibitors have been reported to overcome ABC protein-mediated drug resistance, while others cannot [Citation40–42]. In this study, we found that the expression of MDR1 (ABCB1), a member of the ABC protein family, was weakly negatively correlated with the expression of CBL protein, and this relationship was not observed when cells were treated with sorafenib. We think that there may be other factors involved in the chemoresistance mechanism, which together affects MDR1 protein expression in leukemia cells.
Also, there are some limitations in this study. First, we did not simultaneously detect transcriptional copy changes in the c-CBL gene and CBL protein, so we cannot conclude that the downregulation of CBL protein after treatment by sorafenib was directly caused by c-CBL gene silencing. Second, a consecutive observation time point after drug treatment was not set, so the maximum downregulation range of CBL protein and the corresponding treatment time could not be obtained in this research.
Overall, we found c-CBL gene expression is related to cell chemoresistance; the lower the gene expression is, the higher the cell chemoresistance is. Clinical data come from relapsed and refractory patients also confirm this finding. Salvage therapy containing sorafenib can lead to the downregulation of CBL protein expression in leukemia cells. From the perspective of CBL protein mediated chemoresistance, this treatment is not suitable for all patients. For patients with high c-kit expression, we can deduce the level of CBL protein have already in its lowest level in these cells, there is no room to further decline, so the adverse effect of sorafenib is limited, and patients may benefit from further inactivation of tyrosine kinase signaling, and our previous clinical observations have already confirmed this phenomenon. In addition, we found MDR1 maybe participates in c-CBL gene mediated chemoresistance, it is worth discussing in the future as more and more tyrosine kinase inhibitors are used in the clinic.
Financial support
This research was supported by the following grants
The Medical Research Fund project of Guangdong Province, PR China (A2019508)
The High Level University Construction Project of Guangdong Province, PR China; (LC2016ZD026)
Guangzhou Key Discipline of Medicine (Geriatric Medicine, 2021-2023); (ZDXK202103)
Disclosure statement
No potential conflict of interest was reported by the author(s).
Additional information
Funding
References
- O'Dwyer K, Freyer DR, Horan JT. Treatment strategies for adolescent and young adult patients with acute myeloid leukemia. Blood. 2018;132(4):362–368.
- Grimwade D, Ivey A, Huntly BJ. Molecular landscape of acute myeloid leukemia in younger adults and its clinical relevance. Blood. 2016;127(1):29–41.
- Gebru MT, Wang HG. Therapeutic targeting of FLT3 and associated drug resistance in acute myeloid leukemia. J Hematol Oncol. 2020;13(1):155.
- Sasaki K, Kantarjian HM, Kadia T, et al. Sorafenib plus intensive chemotherapy improves survival in patients with newly diagnosed, FLT3-internal tandem duplication mutation-positive acute myeloid leukemia. Cancer. 2019;125(21):3755–-3766.
- Daver N, Konopleva M. Sorafenib and novel multikinase inhibitors in AML. Lancet Oncol. 2015;16(16):1582–1583.
- Pratz KW, Rudek MA, Smith BD, et al. A prospective study of peritransplant sorafenib for patients with FLT3-ITD acute myeloid leukemia undergoing allogeneic transplantation. Biol Blood Marrow Transplant. 2020;26(2):300–306.
- De Freitas T, Marktel S, Piemontese S, et al. High rate of hematological responses to sorafenib in FLT3-ITD acute myeloid leukemia relapsed after allogeneic hematopoietic stem cell transplantation. Eur J Haematol. 2016;96(6):629–636.
- Gatzka MV. Targeted tumor therapy remixed-an update on the use of small-molecule drugs in combination therapies. Cancers (Basel). 2018;10(6).
- Uy GL, Mandrekar SJ, Laumann K, et al. A phase 2 study incorporating sorafenib into the chemotherapy for older adults with FLT3-mutated acute myeloid leukemia: CALGB 11001. Blood Adv. 2017;1(5):331–340.
- Liu XS, Long H, Huang YX, et al. [Clinical efficacy of sorafenib combined with low dose cytarabine for treating patients with FLT3+ relapsed and refractory acute myeloid leukemia]. Zhongguo Shi Yan Xue Ye Xue Za Zhi. 2016;24(2):394–398.
- Taylor SJ, Thien CB, Dagger SA, et al. Loss of c-Cbl E3 ubiquitin ligase activity enhances the development of myeloid leukemia in FLT3-ITD mutant mice. Exp Hematol. 2015;43(3):191–206. e191.
- Liyasova MS, Ma K, Lipkowitz S. Molecular pathways: cbl proteins in tumorigenesis and antitumor immunity-opportunities for cancer treatment. Clin Cancer Res. 2015;21(8):1789–1794.
- Katzav S, Schmitz ML. Mutations of c-Cbl in myeloid malignancies. Oncotarget. 2015;6(13):10689–10696.
- Sun J, Pedersen M, Bengtsson S, et al. Grb2 mediates negative regulation of stem cell factor receptor/c-Kit signaling by recruitment of Cbl. Exp Cell Res. 2007;313(18):3935–3942.
- Ahmed SF, Buetow L, Gabrielsen M, et al. E3 ligase-inactivation rewires CBL interactome to elicit oncogenesis by hijacking RTK-CBL-CIN85 axis. Oncogene. 2021;40(12):2149–2164.
- Liu J, Yang L, He A, et al. Stable and EGF-induced temporal interactome profiling of CBL and CBLB highlights their signaling complex diversity. J Proteome Res. 2021;20(7):3709–3719.
- Lyle CL, Belghasem M. Chitalia VC. c-Cbl: an important regulator and a target in angiogenesis and tumorigenesis. Cells. 2019;8(5):498.
- Mohapatra B, Ahmad G, Nadeau S, et al. Protein tyrosine kinase regulation by ubiquitination: critical roles of Cbl-family ubiquitin ligases. Biochim Biophys Acta. 2013;1833(1):122–139.
- Sanada M, Suzuki T, Shih LY, et al. Gain-of-function of mutated C-CBL tumour suppressor in myeloid neoplasms. Nature. 2009;460(7257):904–908.
- Kales SC, Ryan PE, Nau MM, et al. Cbl and human myeloid neoplasms: the Cbl oncogene comes of age. Cancer Res. 2010;70(12):4789–4794.
- Ogawa S, Shih LY, Suzuki T, et al. Deregulated intracellular signaling by mutated c-CBL in myeloid neoplasms. Clin Cancer Res. 2010;16(15):3825–3831.
- Marklin M, Tandler C, Kopp HG, et al. C-Cbl regulates c-MPL receptor trafficking and its internalization. J Cell Mol Med. 2020;24(21):12491–12503.
- Chen S, Sun Q, Sun D, et al. C-CBL is required for inhibition of angiogenesis through modulating JAK2/STAT3 activity in ROP development. Biomed Pharmacother. 2020;132:110856.
- Nadeau SA, An W, Mohapatra BC, et al. Structural determinants of the gain-of-function phenotype of human leukemia-associated mutant CBL oncogene. J Biol Chem. 2017;292(9):3666–3682.
- Yawut N, Kaewpiboon C, Budluang P, et al. Overexpression of cancer upregulated gene 2 (CUG2) decreases Spry2 through c-Cbl, leading to activation of EGFR and beta-catenin signaling. Cancer Manag Res. 2020;12:10243–10250.
- Lyle CL, Belghasem M. Chitalia VC. c-Cbl: an important regulator and a target in angiogenesis and tumorigenesis. Cells. 2019;8(5).
- Galanis A, Levis M. Inhibition of c-Kit by tyrosine kinase inhibitors. Haematologica. 2015;100(3):e77–79.
- Zeng S, Xu Z, Lipkowitz S, et al. Regulation of stem cell factor receptor signaling by CBL family proteins (Cbl-b/c-Cbl). Blood. 2005;105(1):226–232.
- Dikic I, Giordano S. Negative receptor signalling. Curr Opin Cell Biol. 2003;15(2):128–135.
- Jang HD, Hwang HZ, Kim HS, et al. C-Cbl negatively regulates TRAF6-mediated NF-kappaB activation by promoting K48-linked polyubiquitination of TRAF6. Cell Mol Biol Lett. 2019;24:29.
- Crotchett BLM, Ceresa BP. Knockout of c-Cbl slows EGFR endocytic trafficking and enhances EGFR signaling despite incompletely blocking receptor ubiquitylation. Pharmacol Res Perspect. 2021;9(2):e00756.
- Lee V, Griffin TD, Suzuki-Horiuchi Y, et al. Downregulation of Src-family tyrosine kinases by Srcasm and c-Cbl: a comparative analysis. J Carcinog. 2021;20:21.
- Claudio AP, Joazeiro SSW, Huang H-k, et al. The tyrosine kinase negative regulator c-Cbl as a RING-Type, E2-dependent ubiquitin-protein ligase. Full. 1999;286:8.
- Langdon WY, Klinken SP, Ruscetti SK. Morse HC v-cbl, an oncogene from a dual-recombinant urine retrovirus that induces early B-lineage lymphomas. Proc Natl Acad Sci USA. 1989;86(4):1168–1172.
- Lindblad O, Cordero E, Puissant A, et al. Aberrant activation of the PI3K/mTOR pathway promotes resistance to sorafenib in AML. Oncogene. 2016;35(39):5119–5131.
- Fouladi F, Jehn LB, Metzelder SK, et al. Sorafenib induces paradoxical phosphorylation of the extracellular signal-regulated kinase pathway in acute myeloid leukemia cells lacking FLT3-ITD mutation. Leuk Lymphoma. 2015;56(9):2690–2698.
- Allen C, Hills RK, Lamb K, et al. The importance of relative mutant level for evaluating impact on outcome of KIT, FLT3 and CBL mutations in core-binding factor acute myeloid leukemia. Leukemia. 2013;27(9):1891–1901.
- Rorsman C, Tsioumpekou M, Heldin CH, et al. The ubiquitin ligases c-Cbl and Cbl-b negatively regulate platelet-derived growth factor (PDGF) BB-induced chemotaxis by affecting PDGF receptor beta (PDGFRbeta) internalization and signaling. J Biol Chem. 2016;291(22):11608–11618.
- Belizaire R, Koochaki SHJ, Udeshi ND, et al. CBL mutations drive PI3K/AKT signaling via increased interaction with LYN and PIK3R1. Blood. 2021;137(16):2209–2220.
- Beretta GL, Cassinelli G, Pennati M, et al. Overcoming ABC transporter-mediated multidrug resistance: the dual role of tyrosine kinase inhibitors as multitargeting agents. Eur J Med Chem. 2017;142:271–289.
- Eadie LN, Hughes TP, White DL. Interaction of the efflux transporters ABCB1 and ABCG2 with imatinib, nilotinib, and dasatinib. Clin Pharmacol Ther. 2014;95(3):294–306.
- Dohse M, Scharenberg C, Shukla S, et al. Comparison of ATP-binding cassette transporter interactions with the tyrosine kinase inhibitors imatinib, nilotinib, and dasatinib. Drug Metab Dispos. 2010;38(8):1371–1380.