
ABSTRACT
While 1q21+ was common genetic alteration and found to have adverse effect on prognosis, the underlying genes remain unclear. Identification of related genes may provide additional help for rational intervention. The microarray dataset GSE2658 associated with MM was downloaded from the Gene Expression Omnibus (GEO) database. The differentially expressed genes (DEGs) were obtained, and Gene Ontology (GO) and Kyoto Encyclopedia of Genes and Genomes (KEGG) pathway analyses were performed to annotate their functions. The hub genes were derived from the combined results of up-regulated DEGs and weighted gene coexpression network analysis (WGCNA). The receiver operating characteristic (ROC) curves of hub genes were plotted to evaluate correlation with 1q21+. Survival analysis and drug-gene interaction of hub genes were performed separately to find the prognostic value and potential targeted drugs. A total of 55 DEGs were identified. GO and KEGG pathway analyses suggested that the DEGs were related to several pathways of cell proliferation. NVL, IL6R, DUSP23 were proven to be highly correlated with 1q21+ and have adverse effects on prognosis. IL6R, DUSP23 were matched to known interaction-drug. This study revealed potential roles of hub genes in the pathogenesis and progression of MM with 1q21+, further investigations are needed to elucidate the mechanisms.
Introduction
Multiple myeloma (MM) is the second most prevalent hematological malignancy and characterized by marked biological and genetic heterogeneity [Citation1]. Additional copies of chromosome 1q (1q21+) are defined as a gain of 1q21 (3 copies) and amplification of 1q21 (≥four copies) which can be detected by fluorescence in situ hybridization (FISH). This is 1q21+ was an important genetic alteration in MM, approximately 40% of newly diagnosed MM (NDMM) were identified with 1q21+ [Citation2]. 1q21+ were also associated with clinical features, with the disease progression from smoldering myeloma to newly diagnosed MM to relapsed/refractory disease, there was an increased tendency of the frequency of 1q21+.
1q21+ often coexisted with high-risk chromosomal abnormalities at high frequency, and was found to be an independent prognostic factor for inferior outcomes in the era of highly-active Proteasome Inhibitor (PI) and Immunomodulatory Drug (IMiD) [Citation3]. For better evaluation of prognosis of MM, a simplified and powerful prognostic staging system called revised International Staging System (R-ISS) has been constructed, it consists high-risk chromosome abnormalities [17p-, t(14;16), t(14,20)], and clinical parameters [Citation4]. Patients with R-ISS third-stage disease and 1q21+ have an inferior outcome comprising an ultra-high-risk group [Citation5]. Considering the significance of 1q21+, they were incorporated into R-ISS to form a revised staging system (R2-ISS), allowing a better stratification of patients with intermediate-risk NDMM [Citation6].
Though the important role of 1q21+ was identified, the mechanisms underlying the development of 1q21+ are controversial, whether it occurs as a byproduct of high-risk biology and genomic instability or increased expression of genes on 1q, such as CKS1B, MCL1, ADAR1, and PDZK1 [Citation3], which is also important for effective therapy. Therefore, the purpose of this study was to explore the potential genetic drivers of 1q21+ and to identify potential therapeutic drugs targeted against these abnormalities.
Material and method
Microarray data and DEGs identification
The gene expression profile of GSE2658 datasets was downloaded from the GEO database (https://www.ncbi.nlm.nih.gov/geo/). A total of 248 pre-treatment samples of bone marrow from MM patients, which were collected from the datasets after deleting the missing data of 1q21 status, including 114 samples with 1q21+ (amplification or gain) and 134 standard samples. 1q21 statuses were detected by FISH in the dataset.
Differentially expressed genes (DEGs) between 1q21+ and standard MM were analyzed using the online analytical tool SangerBox [Citation7] (http://sangerbox.com/), which is based on R package ‘limma(version 3.40.6)’. The cutoff criteria were adjusted to P < 0.05 and |log2FoldChange| > 1 (|log2FC| > 1). All genes were visualized by volcano plot, and the DEGs were shown by heatmap.
GO and KEGG pathway analysis
Gene Ontology (GO) functional annotation and Kyoto Encyclopedia of Genes and Genomes (KEGG) signaling pathway analysis were performed for DEGs (P < 0.05) using SangerBox, which is based on R package ‘clusterProfiler(version 3.14.4)’. GO analysis includes three terms: biological process (BP), molecular functions (MF), and cellular components (CC). P-values < 0.05 and counts ≥2 were considered significantly enriched.
WGCNA of candidate genes
WGCNA (Weighted correlation network analysis) was also performed on Sangerbox. First, the samples were clustered, and outliers were removed to ensure the accuracy of the analysis. The soft threshold parameter that satisfied the scale-free co-expression network relationship was set to 5. Second, to reduce interference from spurious correlations, the adjacency matrix was replaced by a topological overlap matrix (TOM). The corresponding dissimilarity was calculated using the dynamics cut tree algorithms to identify hierarchical clustering genes, and the minimum module size was set to 30 to obtain large modules. Third, different module eigenvectors (MEs) were achieved to merge modules with high similarity at a height cut of 0.75. The relevance between modules and clinical traits is shown with a heatmap to determine the modules most closely associated with 1q21+. The |correlation coefficient|>0.5 and P-value < 0.05 were cutoffs for module screening. Finally, the module membership (mM) and gene significance (GS) of individual genes were measured, and the genes in the key modules with |mM| > 0.6 and |GS| > 0.2 were selected for further analysis.
Hub gene identification and evaluation
The intersection of candidate genes from WGCNA and DEGs was constructed to identify the hub genes, and a Venn diagram was used to display the overlapping genes. The expression data of genes were extracted to evaluate the ability of hub genes to recognize 1q21+ MM samples, and receiver operator characteristic (ROC) curves were drawn using the R package ‘pROC (version 1.17.0.1)’.
Survival analysis of hub gene
The survival curve was calculated using Kaplan–Meier analysis and the log-rank test. The difference was considered statistically significant when P < 0.05. High and low expression group of hub genes were divided according to the optimal threshold determined by the ROC curve. The influences of hub genes on survival were conducted by R packages ‘survival (version 3.2.11)’.
The construction of drug-gene interaction
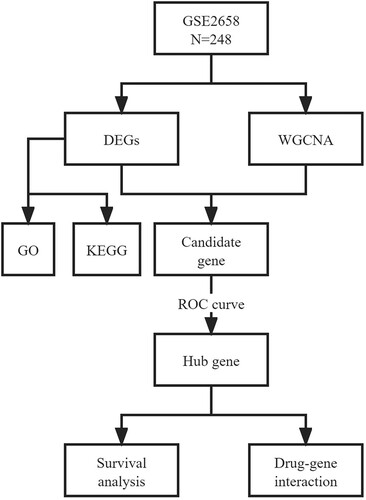
The QuartataWeb [Citation8] (http://quartata.csb.pitt.edu/) supports searching for information on drug-gene interaction. The identified hub genes were uploaded into the database to screen the existing top 20 drugs or compounds. The flow chart of this study is shown in .
Figure 1. Flowchart of the study. GSE, GEO Series; DEGs, differentially expressed genes; WGCNA, weighted gene co-expression network analysis; GO, gene ontology; KEGG, Kyoto Encyclopedia of Genes and Genomes; ROC curve, receiver operator characteristic curve.
Results
DEGs screening
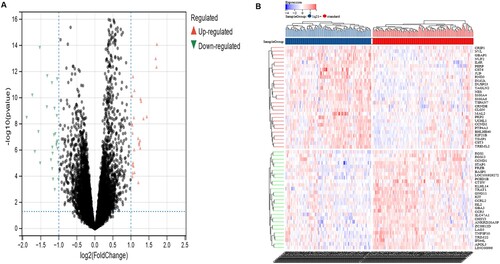
According to the status of 1q21, there were 55 DEGs (supplementary Table 1) between 1q21+ and standard MM samples, including 28 up-regulated genes and 27 down-regulated genes. All DEGs were described by the volcano plot ((a)), and the heatmap shows the expression of the DEGs ((b)).
Figure 2. Screening of DEGs. a Volcano plot with cutoff criteria set to adjusted P-value < 0.05 and |log2FC| > 1. Red triangles indicate Up-regulated genes, and blue triangles indicate Down-regulated genes. b Heatmap of the 55 DEGs according to the values of |log2FC|. DEGs, differentially expressed genes; FC, fold change.
Function and pathway analysis
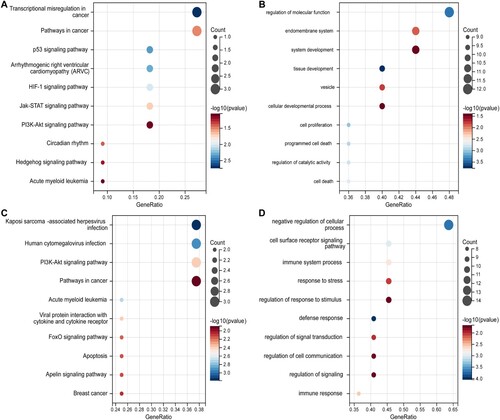
GO and KEGG pathway analyses were performed to investigate the functions of DEGs. The top 10 KEGG and GO pathways were selected for display by bubble diagram according to the rank of enrichment count. The KEGG analysis of up-regulated DEGs showed that the pathways associated with transcriptional misregulation in cancer, pathways in cancer and p53 signaling pathway were significantly enriched ((a)). The GO analysis of up-regulated DEGs was mainly enriched in the regulation of molecular function, endomembrane system, and system development ((b)). While down-regulated DEGs were significantly associated with Kaposi sarcoma-associated herpesvirus infection, human cytomegalovirus infection, and PI3K-Akt signaling pathway in KEGG analysis ((c)). For GO analysis, the results indicated that down-regulated DEGs were mostly located in negative regulation of cellular process, cell surface receptor signaling pathway, and immune system process ((d)).
Figure 3. KEGG pathway and GO analysis of DEGs. The bubble diagrams show the top 10 functional and results with significant differences. a KEGG of up-regulated DEGs. b GO of up-regulated DEGs. c KEGG of down-regulated DEGs. d GO of down-regulated DEGs. GO, Gene Ontology; KEGG, Kyoto Encyclopedia of Genes and Genomes; DEGs, differentially expressed genes.
Candidate genes in WGCNA
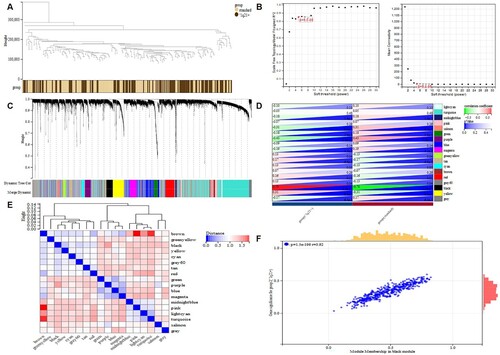
The overall clustering and clinical characteristic heatmap of the training set are shown in (a). As shown in (b), when the soft threshold was set to 3 (R2 = 0.85), the interaction between genes conformed to the scale-free distribution to the maximum extent, and the mean value of the adjacency function gradually approached 0. A total of 18 modules were identified by average linkage hierarchical clustering based on the expression values of 10,275 genes, shown in (c). The heatmap in (d) shows the correlation between different modules. The heat map of pertinence between modules and clinical traits is shown in (e). We found that the black module (|cor| = 0.7, P-value = 2.3e-37) was significantly positively associated with 1q21+. The black module contained 475 genes. GS and mM were calculated for each gene to draw scatterplots ((f)). According to the |mM| > 0.6 and |GS| > 0.2 conditions, a total of 126 genes were obtained.
Figure 4. The process of WGCNA. a Sample clustering with the trait heatmap. b the left panel shows the scale-free fit index (y-axis) as a function of the soft thresholding power (x-axis); the right panel displays the mean connectivity (degree, y-axis) as a function of the soft-thresholding power (x-axis); c Clustering dendrograms for the 10275 genes with dissimilarity based on the topological overlap together with the assigned module colors; eighteen co-expression modules were constructed with various colors. d Module-trait relationships; each row corresponds to a module eigengene, each column corresponds to a trait, and each cell consists of the corresponding correlation and P-value, which are color-coded by correlated according to the color legend. e The heatmap shows the eigengene adjacency. f Scatterplot of 475 genes in the black module; the correlation and P-value are in the upper left corner. WGCNA, weighted gene co-expression network analysis.
Hub gene identification and evaluation
Finally, the intersections of DEGs and WGCNA are three genes (NVL, IL6R, DUSP23) (supplementary Figure 1), which are considered as the candidate genes. Subsequently, the ROC curves of these genes were plotted. As shown in (a), the AUCs (area under the curve) of candidate genes were all greater than 0.7, with good performance. Therefore, all are regarded as the hub genes.
Figure 5. a ROC curves of candidate genes. b Survival curves of hub genes.
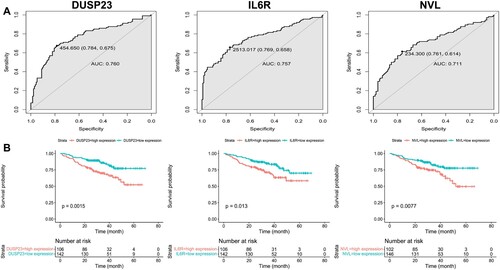
Survival analysis of hub gene
It was found that the overall survival rate of multiple myeloma with high expression of DUSP23, IL6R, and NVL were significantly lower ((b)). Therefore, the three target genes were not only highly correlated with 1q21+, but also consistently had adverse effects on prognosis.
Drug-gene interaction of hub gene
The three hub genes were uploaded into the database for drug-gene interaction analysis. Only DUSP23 and IL6R were identified as interaction drugs (supplementary Figure 2). DUSP23 was matched to one known interaction-drug, IL6R has two known drugs approved by FDA (), and the others are predicted drugs.
Table 1. The known interaction-drugs targeted to hub genes.
Discussion
Detection of 1q21 by FISH has been included in the International Myeloma Working Group (IMWG) consensus for risk stratification in multiple myeloma [Citation9]. Through genomic analysis, patients with amplification of CKS1B (at 1q21) in the context of ISS-III or bi-allelic TP53 inactivation were referred to as Double-Hit and had a dire prognosis [Citation10]. Though 1q21+ has been considered as a prognostic risk factor for MM, there wasn’t clear evidence about consistent dysregulations of genes or pathways among MM patients with 1q21+. Hence, we screened the DEGs between 1q21+ and standard MM samples and verified the ability of hub genes as biomarkers for 1q21+. The biological functions of DEGs and their significantly related signaling pathways were further explored, and potentially interactional drugs for hub genes were identified. In this study, three target genes (NVL, IL6R, DUSP23 located in 1q region) associated with 1q21+ in MM patients were obtained by overlapping with DEGs-up regulation.
Interleukin-6 (IL6) is a potent pleiotropic cytokine that regulates plasma cell growth via the IL-6 receptor (IL6R). IL6/IL6R autocrine activity is implicated in the development and progression of MM and other cancers [Citation11]. Myeloma cells release soluble IL6R about immortalization in vitro [Citation12]. In the further analysis of KEGG enrichment of IL6R, we found that it was mainly enriched in pathways of pathways in cancer, PI3K-Akt signaling pathway, viral protein interaction with cytokine and cytokine receptor, human cytomegalovirus infection, Jak-STAT signaling pathway, hematopoietic cell lineage, HIF-1 signaling pathway, and cytokine-cytokine receptor interaction. A study confirmed that IL6R and ADAR1 collaborated to induce a hyper-activation of the oncogenic STAT3 pathway in myeloma, in association with 1q21 amplification [Citation13]. In addition, soluble IL6R levels were increased, significantly correlated to 1q21 amplification, and associated with lower overall survival [Citation14]. MM patients with strong IL6R expression by immunohistochemistry have poor responses to thalidomide-dexamethasone treatment [Citation11]. The standard of care in MM has evolved without much evidence regarding the relative benefit of novel combinations on patients with 1q21+, including PI/IMiDs, Daratumumab and auto stem cell transplantation (ASCT) [Citation3,Citation15]. By searching the database, Sarilumab and Tocilizumab were potential therapeutic drugs of IL6R that have been used in rheumatoid arthritis [Citation16]. The expression of IL6R alpha is restricted to neoplastic plasma cells, not normal plasma cell [Citation17]. These distinct expression patterns suggested that the use of antibody against IL6R may be a promising approach for treatment of 1q21+ MM.
DUSP23 is a low molecular weight DUSP (Dual-specificity protein phosphatase) that participates in interferon and interleukin signaling pathways by dephosphorylating signal transducer and activator of transcription (STAT) proteins [Citation18]. Upregulation of VH1-like (member Z) dual specific protein phosphatase encoded by DUSP23 gene is associated with progression of various human solid tumors, in particular breast cancer [Citation19]. NVL encodes nuclear protein designated NVLp (nuclear VCP-like protein), which is involved in an ATP-dependent nuclear process [Citation20]. It has been proved to be prognostic outlier genes for metastatic progression and overall survival in prostate cancer [Citation21]. Little research has been done about DUSP23 and NVL in MM. We found that DUSP23 and NVL were related to 1q21+ and affected the prognosis of MM. So the mechanism and signal pathway in MM with 1q21+ needs further exploration.
Despite these meaningful findings, our study still has several limitations need to be acknowledged. Firstly, the small sample size may restrict the statistical power and generalizability of these findings. Secondly, this is an exploratory study, and external validation, especially further experimental and clinical evidences are needed to validate the mechanism and clinical value of the hub genes obtained in this study. Moreover, MM is a heterogeneous disease characterized by diverse symptoms, subtypes, and clinical stages, it is important to explore mechanisms of specific MM subtypes for better understanding and treatment for MM.
Contributions
ZX and JN wrote the manuscript and performed the data analysis; YC revised the manuscript and supervised the project. ZX and JY contributed equally to this work and share first authorship. All authors read and approved the final manuscript.
Ethics statement
Because the data were accessed in the public database and identified information is marked, so no ethics approval is needed.
Supplemental Material
Download Zip (2 MB)Acknowledgements
The authors thank Xingyue Jin for writing support.
Disclosure statement
No potential conflict of interest was reported by the author(s).
Data availability statement
The datasets GSE2658 presented in this study can be found in [GEO database] [https://www.ncbi.nlm.nih.gov/geo/query/acc.cgi?acc = GSE2658].
References
- Viale PH. The American cancer society’s facts & figures: 2020 edition. J Adv Pract Oncol. 2020;11:135–136.
- Hanamura I, Stewart JP, Huang Y, et al. Frequent gain of chromosome band 1q21 in plasma-cell dyscrasias detected by fluorescence in situ hybridization: incidence increases from MGUS to relapsed myeloma and is related to prognosis and disease progression following tandem stem-cell transplantation. Blood. 2006;108:1724–1732. doi:10.1182/blood-2006-03-009910
- Schmidt TM, Fonseca R, Usmani SZ. Chromosome 1q21 abnormalities in multiple myeloma. Blood Cancer J. 2021;11:83. doi:10.1038/s41408-021-00474-8
- Palumbo A, Avet-Loiseau H, Oliva S, et al. Revised international staging system for multiple myeloma: a report from international myeloma working group. J Clin Oncol. 2015;33:2863–2869. doi:10.1200/JCO.2015.61.2267
- Kastritis E, Migkou M, Dalampira D, et al. Chromosome 1q21 aberrations identify ultra high-risk myeloma with prognostic and clinical implications. Am J Hematol. 2022;97:1142–1149. doi:10.1002/ajh.26639
- D’Agostino M, Cairns DA, Lahuerta JJ, et al. Second revision of the international staging system (R2-ISS) for overall survival in multiple myeloma: a European myeloma network (EMN) report within the HARMONY project. J Clin Oncol. 2022;40:3406–3418. doi:10.1200/JCO.21.02614
- Shen W, Song Z, Zhong X, et al. Sangerbox: a comprehensive, interaction-friendly clinical bioinformatics analysis platform. iMeta. 2022;1:e36. doi:10.1002/imt2.36
- Li H, Pei F, Taylor DL, et al. Quartataweb: integrated chemical-protein-pathway mapping for polypharmacology and chemogenomics. Bioinformatics (Oxford, England). 2020;36:3935–3937.
- Chng WJ, Dispenzieri A, Chim CS, et al. IMWG consensus on risk stratification in multiple myeloma. Leukemia. 2014;28:269–277. doi:10.1038/leu.2013.247
- Walker BA, Mavrommatis K, Wardell CP, et al. Double-Hit, group of newly diagnosed myeloma identified by genomic analysis. Leukemia. 2019;33:159–170. doi:10.1038/s41375-018-0196-8
- Bedewy AM, El-Maghraby SM. Do baseline cereblon gene expression and IL-6 receptor expression determine the response to thalidomide-dexamethasone treatment in multiple myeloma patients? Eur J Haematol. 2014;92:13–18. doi:10.1111/ejh.12207
- Thabard W, Barillé S, Collette M, et al. Myeloma cells release soluble interleukin-6Ralpha in relation to disease progression by two distinct mechanisms: alternative splicing and proteolytic cleavage. Clin Cancer Res. 1999;5:2693–2697.
- Teoh PJ, Chung TH, Chng PYZ, et al. IL6R-STAT3-ADAR1 (P150) interplay promotes oncogenicity in multiple myeloma with 1q21 amplification. Haematologica. 2020;105:1391–1404. doi:10.3324/haematol.2019.221176
- Stephens OW, Zhang Q, Qu P, et al. An intermediate-risk multiple myeloma subgroup is defined by sIL-6r: levels synergistically increase with incidence of SNP rs2228145 and 1q21 amplification. Blood. 2012;119:503–512. doi:10.1182/blood-2011-07-367052
- Kim SY, Min HJ, Park HK, et al. Increased copy number of the interleukin-6 receptor gene is associated with adverse survival in multiple myeloma patients treated with autologous stem cell transplantation. Biol Blood Marrow Transplant. 2011;17:810–820. doi:10.1016/j.bbmt.2011.01.002
- Emery P, Rondon J, Parrino J, et al. Safety and tolerability of subcutaneous sarilumab and intravenous tocilizumab in patients with rheumatoid arthritis. Rheumatology (Oxford, England). 2019;58:849–858. doi:10.1093/rheumatology/key361
- Rawstron AC, Fenton JA, Ashcroft J, et al. The interleukin-6 receptor alpha-chain (CD126) is expressed by neoplastic but not normal plasma cells. Blood. 2000;96:3880–3886. doi:10.1182/blood.V96.12.3880
- Balada E, Felip L, Ordi-Ros J, et al. DUSP23 is over-expressed and linked to the expression of DNMTs in CD4(+) T cells from systemic lupus erythematosus patients. Clin Exp Immunol. 2017;187:242–250. doi:10.1111/cei.12883
- Tang JP, Tan CP, Li J, et al. VHZ is a novel centrosomal phosphatase associated with cell growth and human primary cancers. Mol Cancer. 2010;9:128. doi:10.1186/1476-4598-9-128
- Germain-Lee EL, Obie C, Valle D. NVL: a new member of the AAA family of ATPases localized to the nucleus. Genomics. 1997;44:22–34. doi:10.1006/geno.1997.4856
- Zhao SG, Evans JR, Kothari V, et al. The landscape of prognostic outlier genes in high-risk prostate cancer. Clin Cancer Res. 2016;22:1777–1786. doi:10.1158/1078-0432.CCR-15-1250