
ABSTRACT
We aimed to investigate the role and mechanism of LSP1 in the progression of acute myelogenous leukemia. In this study, we established shLSP1 cell line to analyze the function of LSP1 in AML. We observed high expression of LSP1 in AML patients, whereas it showed no expression in normal adults. Furthermore, we found that LSP1 expression was associated with disease prognosis. Our results indicate that LSP1 plays a crucial role in mediating proliferation and survival of leukemia cells through the KSR/ERK signaling pathway. Additionally, LSP1 promotes cell chemotaxis and homing by enhancing cell adhesion and migration. We also discovered that LSP1 confers chemotactic ability to leukemia cells in vivo. Finally, our study identified 12 genes related to LSP1 in AML, which indicated poor survival outcome in AML patients and were enriched in Ras and cell adhesion signaling pathways. Our results revealed that the overexpression of LSP1 is related to the activation of the KSR/ERK signaling pathway, as well as cell adhesion and migration in AML patients. Reducing LSP1 expression impair AML progression, suggesting that LSP1 may serve as a potential drug therapy target for more effective treatment of AML.
Introduction
Acute myelogenous leukemia (AML) is a malignancy characterized by oncogenic mutations in hematopoietic stem cells, leading to uncontrolled cell proliferation. This causes the production of an abundance of leukemia stem cells (LSCs) and predominantly immature myeloid cells, including promyelocytes, which have the capacity to infiltrate various tissues and organs, posing a life-threatening risk [Citation1]. Transcriptome alterations in LSCs with oncogenic mutations lead to significant changes, such as metabolic reprogramming, prolonged cell survival, and modifications in signaling pathways [Citation2–4]. Among these changes, the MAPK signaling pathway, activated by RAS/ERK signaling, plays a crucial role in the proliferation and survival of LSCs [Citation5]. Concurrently, signaling through the MEK/ERK pathways contributes to a multitude of cellular processes, encompassing cell migration, proliferation, differentiation, and survival across various biological contexts [Citation6,Citation7].
Both hematopoietic stem cells (HSCs) and LSCs heavily rely on the endosteal microenvironment to maintain homeostasis, primarily through the advantages conferred by adhesion molecules [Citation8]. However, when faced with external stressors, such as niche competition and the cytotoxic effects of chemotherapy, LSCs exhibit increased adaptability to facilitate migration, ultimately contributing to the reconstruction of the leukemic microenvironment. This enhanced LSC proliferation and survival, expediting disease progression and chemoresistance [Citation9,Citation10]. Therefore, gaining insight into the mechanisms that govern LSC migration is of paramount importance. Presently, research into LSC adhesion and migration predominantly revolves around the Integrin family [Citation11], ICAM1 [Citation12], CXCR4 [Citation13], and so on. However, the precise interaction networks that dictate LSC migration in the context of AML remain elusive.
Lymphocyte-specific protein 1 (LSP1) is primarily expressed within the hematopoietic system, where it regulates the adhesion and inflammatory responses of immune cells [Citation14,Citation15]. For instance, LSP1 can form a complex with myosin1e, promoting macrophage migration [Citation16]. Furthermore, it can mediate the recruitment and activation of immune cells during acute inflammatory responses [Citation17]. LSP1 is also widely expressed in endothelial and tumor cells. In endothelial cells, LSP1 plays a role in regulating vascular permeability and the transendothelial migration of immune cells [Citation18]. In glioblastoma cells, LSP1 is involved in tumor cell survival and migration [Citation19]. While LSP1`s role has been well-documented in immune and tumor cells, its impact on AML remains relatively unexplored.
In our research, we observed abnormal overexpression of LSP1 in AML. By utilizing shLSP1 leukemia cell lines, we demonstrated that LSP1 activates the KSR/ERK signaling pathway, which is associated with cell proliferation and the cell cycle in leukemia cells. Furthermore, knockout of LSP1 not only inhibited leukemia cells migration and chemotaxis but also reduced their homing and survival capabilities. Finally, we identified several genes linked to LSP1 functions, primarily involved in regulating cell adhesion and the KSR/RAS signaling pathway. These genes have been implicated in lower survival rates in AML patients. Our findings shed light on the potential of LSP1 and its related proteins as prognostic indicators and therapeutic targets in AML.
Patients, material and methods
Patient samples
Human AML samples were obtained from patients at the Hefei First People’s Hospital, with the approval of the ethical committee (NO. H7876654). Informed consent was obtained from all patients, and all procedures were conducted in compliance with relevant regulations. Human AML mononuclear cells were isolated from the bone marrow (BM) of confirmed AML patients. Normal donor human BM cells from the hospital’s bone marrow bank served as the control group. Samples were collected with informed consent and in accordance with local ethical approval. Briefly, samples were removed erythrocytes with ACK Lysis Buffer (Beyotime) and washed three times with DPBS. CD11b MicroBeads (Miltenyi Biotec) was used for myeloblasts isolation. The remaining cells were stored at −80°C or directly used for downstream assay.
Cell culture
Human AML lines HL-60 and MOLM-14 were cultured in RPMI 1640 medium supplemented with 10% fetal calf serum (FCS), 100 μg/mL of streptomycin, and 100 U/mL of penicillin. Cells were maintained in a 5% CO2 incubator at 37°C.
Generation of shRNA and retroviral transduction
HL-60 and MOLM-14 cell lines were transfected with LSP1 Human shRNA Lentiviral Particle (Locus ID 4046) or scrambled shRNA (Origene) for a control. Cells at 80% confluency in six-well plates were incubated with a new culture medium containing lentiviral particles and polybrene for 24 h, then the medium was replaced, and puromycin was added after 72 h for the selection of stable LSP1 knockout cells. Cells were regularly treated with puromycin, and the knockout efficiency was assessed over 2 months. Knockout efficiency was verified by immunoblotting. Three different homogeneous shRNA were transfected and validated, and all experiments were repeated with at least two homogeneous shRNAs.
Cell proliferation assay
Cell proliferation was detected by Cell Counting Kit-8 (CCK8) (Solarbio) according to the manufacturer’s instructions. Briefly, cells were counted and seeded at a concentration of 2000 cells/well in 96-well plates. After 0, 12, 24, and 48 h, 10 μL of CCK8 solution was added, and the optical density (OD) at 450 nm was measured four hours after adding CCK8.
Cell cycle and ROS analysis
For cell cycle assay, cells were collected at 80-90% confluency, fixed with 70% ethanol for 2 h, washed with DPBS, and incubated with 0.5 mL PI solution (MCE) for 30 min at 37°C. Flow cytometry (CytoFlex, Beckman Coulter) was used for cell cycle data collection and analysis. For the ROS assay, cells at 80–90% confluency were collected and treated with 10μM DCFH-DA (Beyotime) for 30 min at 37°C. Flow cytometry (CytoFlex, Beckman Coulter) was used for ROS data collection and analysis.
Immunoblot analysis
Whole-cell extracts were prepared by RIPA lysis buffer containing a Protease inhibitor cocktail (Solarbio) and protein Phosphatase Inhibitor (Solarbio). Briefly, cell pellets were resuspended and lysed on ice for 30 min, then centrifuged at 12000 g at 4°C. The supernatant was collected for protein concentration detection and subsequent immunoblot. Total proteins were separated by 10% polyacrylamide gel electrophoresis (SDS-10% PAGE), transferred onto the PVDF membrane, and immunoblotted with rabbit antibodies against β-actin, LSP1, ERK, p-ERK, KSR, p-KSR (Cell Signaling Technology). The PVDF membrane was then incubated in a buffer containing HRP-conjugated goat anti-rabbit IgG secondary antibodies (Absin), Finally, immunoblotting was developed using an efficient chemiluminescence kit (Absin).
Locomotion studies
Locomotion assay was measured as previously described [Citation20,Citation21]. Briefly, cells were tracked in Hanks/HEPES buffer containing 2.0% BSA and videotaped for 2 h at 37°C. Cell migration distance was measured at 20-minute intervals to determine the rates of locomotion.
Cell migration
Eight-micrometre-pore Transwell plates (Coring) were precoated with diluted Matrigel (BD Biosciences). A total of 1 × 10⁶ cells were resuspended with serum-free RPMI 1640 and seeded into the upper chamber, while the bottom chamber contained RPMI 1640 with 10% FBS. After 24 h of incubation at 37°C, the number of migrating cells in the basal lumen was counted with Hemocytometer.
Gene set enrichment analysis
Gene sets related to LSP1 in AML were gained from GEPIA (http://gepia2.cancer-pku.cn/#similar) and XIANTAO (https://www.xiantaozi.com/), and co-correlated gene sets were generated by Venn analysis. A protein–protein network was generated from STRING. To obtain function-related gene sets, genes from Venn analysis underwent GO (Gene Ontology) enrichment analysis and were visualized in a column diagram.
RT-qPCR
Total RNA was extracted with Trizol reagent (Absin) according to manufacturer’s protocol. Reverse transcription was performed, and then generated cDNA was used for RT-qPCR. RT-qPCR was run for 40 cycles in Bio-Rad CFX96. -ΔΔCt was used for relative quantification. Primer sequences were presented as follows:
β-actin Forward: 5’-CATGTACGTTGCTATCCAGGC-3’, Reverse: 5’-CTCCTTAATGTCACGCACGAT-3’;
CD300A Forward: 5’- ACCACCACAGATTTTCCTATGT-3’, Reverse: 5’-CATCCTCCTCTGTGAGATTCTC-3’;
ITGAL Forward: 5’-CAGATTGGCTCTTATTTCGGTG-3’, Reverse: 5’- TTCTCTGGTAGATAAACACCCG-3’;
PREX1 Forward: 5’-GCAATATGTCACCCAGATCAAC-3’, Reverse: 5’-GTAGGAGTCGCGATAACTCATG-3’;
RAC2 Forward: 5’- CAACGCCTTTCCCGGAGAG-3’, Reverse: 5’-TCCGTCTGTGGATAGGAGAGC-3’;
SASH3 Forward: 5’-CTTTTCTGAGCAAGAGGAGCAT-3’, Reverse: 5’-ATCTCCTTTCTGCAGTTTCAGC-3’;
STK10 Forward: 5’-GCATGGACTATGGTACCAATCT-3’, Reverse: 5’-TTTTGTACAGTTTCGGGTCCTT-3’;
CYTH1 Forward: 5’-TATTGTCAGTGCAATAATGGCG-3’, Reverse: 5’-CAGACTGGTGTTCAACATGATG-3’;
CYTH4 Forward: 5’-TGAAGGATGAGATTGCAGATGT-3’, Reverse: 5’-AATACACAGCTCCTTCTCCTTC-3’;
PIK3R5 Forward: 5’- GGGAGGCTGTTCCTCTAACAC-3’, Reverse: 5’-GTTCACGGAGGTACAGACCTT-3’;
CSK Forward: 5’-GTCAAGTGCATTAAGAACGACG-3’, Reverse: 5’-CCATGTACTCAGTGACGATGTA-3’;
RASA3 Forward: 5’-ATGAGGGATTGCTACTGCACG-3’, Reverse: 5’-AAACGGGCAGAGTGACTTTTC-3’;
ARHGEF1 Forward: 5’-GCATCGGGCAGAACACAGAA-3’, Reverse: 5’-CGCCGCTGATAGTCCTTGAG-3’;
In vivo assay
Six-to-eight-week-old SCID male mice were purchased from Shanghai Model Organisms (Shanghai, China) and bred in Specific pathogen Free (SPF) conditions, with a controlled environment of 23 ± 2°C, relative humidity was 60%, alternating day and night for 12/12 h. All animal studies were approved by the Institutional Animal Care of Hefei First People’s Hospital (Hefei, China). For cell homing test, HL-60 cells (2 × 10⁷ per mouse) were injected into SCID mice by tail vein injection. Mice were irradiated with 2 Gy before transplantation. Percp/Cyanine5.5 anti-human CD45(BioLegend) was used to detect the proportion of CD45+ cells in mouse bone marrow 36 h after transplantation. To generate a leukemic mouse model, 2 × 10⁶ HL-60 cells were injected into SCID mice by tail vein injection.
Survival analysis
Overall survival in AML patients for LSP1, CYTH1, CYTH4, PIK3R5, CSK, RASA3, ARHGEF1, CD300A, ITGAL, PREX1, RAC2, SASH3, STK10 was analyzed using Kaplan-Meier analysis from GEPIA 2 and UALCAN. Samples were categorized into high- and low-expression groups based on the median expression of the indicated genes. A p-value of <0.05 indicated a statistically significant difference in overall survival.
Clinical variables analysis
RNA-seq data from the TCGA database (https://portal.gdc.cancer.gov) were downloaded from the TCGA-LAML (acute myeloid leukemia) program STAR process and extracted in TPM format, along with clinical data. Normal samples and samples without clinical information were removed. Samples were categorized into high- and low-expression groups based on the median expression of LSP1 in all TCGA samples. The difference in the composition ratio of different clinical variables between the subgroups was analyzed using the Chi-square test, and p < 0.05 was considered statistically significant.
Database analysis
Data from TCGA-LAML was analyzed using GEPIA 2 (gepia2.cancer-pku.cn/), UALCAN (ualcan.path.uab.edu/) and Xiantao (www.xiantao.love/). Transcriptomic data were log2 transformed, and the related genes were analyzed by Pearson analysis. All data is published and useful.
Statistical analysis
All data were analyzed using GraphPad Prism 8.0 and SPSS 22.0. All experiments were repeated at last three times and data was presented as the mean ± standard deviation (x̄ ± SD) value. Differences between the means of the two experimental groups were assessed using the Student’s t test. The log-rank test was used to assess the statistical significance of the Kaplan–Meier survival plots. Pearson correlation test was used for correlation analysis. P < 0.05 was considered to indicate a statistically significant difference. *, p < 0.05; **, p < 0.01; ***, p < 0.001; ****, p < 0.0001.
Results
Aberrantly expressed LSP1 is associated with the survival of AML patients
In order to explore the effects of LSP1, we examined its expression in various tumors from TCGA. We found differences in LSP1 expression among tumors. Specifically, LSP1 was down-regulated in BLCA, SKCM, THYM, UCEC and UCS tumors, while it was distinctly up-regulated in GBM, KIRC, KIRP, LAML, OV, PAAD, and TGCT tumors ((A)). To further explore the role of LSP1, we collected and analyzed LSP1 expression in BM cells from five AML patients and normal healthy controls. Minimal expression of LSP1 was observed in adult BM cells, While AML patients consistently exhibited high LSP1 expression ((B)). This result was validated in clinical AML patients, where LSP1 was significantly up-regulated in myeloblasts ((C)). Additionally, we utilized various databases, including GEPIA 2 and UALCAN, to examine the correlation between LSP1 and the prognosis of AML patients. It was revealed that AML patients with higher LSP1 expression had worse survival outcomes ((D-E)), revealing that LSP1 could serve as an indicator of poor survival for AML.
Figure 1. Elevated expression of LSP1 in AML correlates with poor survival. A. dot plot of the expression of LSP1 in tumor samples and paired normal tissues, data was from GEPIA 2. B. dot plot showing the expression of LSP1 in AML patients and normal cells. C. immunoblotting of LSP1 and β-actin in myeloid cells from 5 AML patients and 5 healthy donors. D. Kaplan-Meier plot of overall survival in AML patients based on the expression of LSP1. Data was from GEPIA 2. E. Kaplan-Meier plot of overall survival in AML patients based on the expression of LSP1. Data was from UALCAN. F. Histogram showing the relationship of LSP1 and cytogenetic risk in AML. G. Histogram showing the expression of LSP1 in AML with or without Ras activation, PML/RAR fusion and FLT3 mutation.
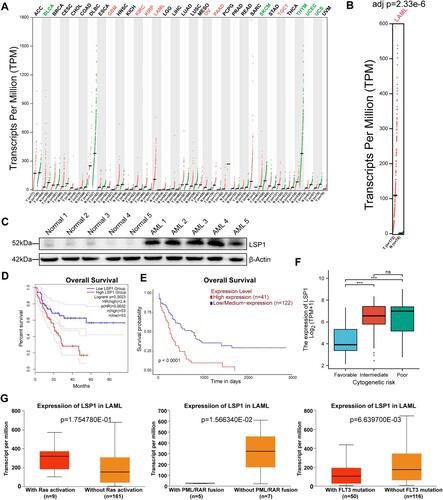
To further identify which factors were related to LSP1 expression, we investigate the characteristics of LSP1 and its relationship with AML progression in the TCGA database. We found that LSP1 was mainly related to cytogenetic risk, Fab classifications, and cytogenetics. High LSP1 expression was observed in patients with poor cytogenetic risk, particularly in cases with complex mutation events. LSP1 expression was also elevated in M0 and M4 types of AML (). We explored if LSP1 was associated with specific gene mutations in AML patients and found that it was expressed higher in patients with more severe mutations ((F)). This phenotype was mildly correlated with RAS signaling pathway mutation and inversely correlated with PML/RAR fusion and FLT3 mutation ((G)). These results suggested that the expression of LSP1 is widely increased in AML patients and is associated with a higher risk of gene mutations. AML patients with high LSP1 expression showed worse prognosis, highlighting the key role of LSP1 in AML.
Table 1. Clinical factors and LSP1 expression from AML patients.
Knockout of LSP1 inhibits the proliferation of AML cells by regulating MEK/ERK signaling pathways
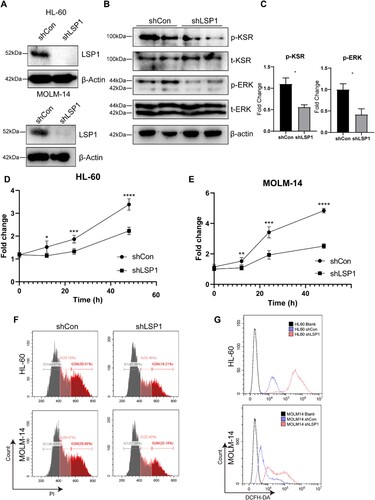
To investigate the function of LSP1 in AML, we transfected LSP1 shRNA into human AML cell lines HL-60 and MOLM-14 and validated the transfection efficiency ((A)). Previous studies have suggested a connection between MEK/ERK signaling pathways and LSP1 [Citation22–24]. Therefore, we identified the activation of MEK/ERK in the wild-type and shLSP1 groups. KSR was previously demonstrated that have physical interaction with LSP1 for MEK/ERK complex organization and activation [Citation23]. Our findings indicated the decrease of phosphorylated KSR/ERK in shLSP1 cell lines, suggesting that LSP1 actively regulates the activation of the KSR/MEK/ERK signaling pathway in AML cell lines ((B-C)). Moreover, we detected whether LSP1 could regulate the proliferation of AML cells. Our results demonstrated reduced proliferation in the shLSP1 HL-60 cell line ((D)), and we validate the same result in the shLSP1 MOLM-14 cell line ((E)). Additionally, G2/M cell cycle phases were significantly decreased, while G1/S phases were increased ((F)). We found that shLSP1 AML cells had elevated oxidative stress, resulting in increased ROS levels and greater cytotoxicity ((G)). These results indicated that LSP1 regulates the proliferation and cell cycle of AML cells. Hence, inhibiting the expression of LSP1 arrested the cell cycle and decreased cell proliferation in AML, partly through the KSR/MEK/ERK signaling pathway.
Figure 2. Knock-out of LSP1 inhibited KSR/ERK activation and proliferation in AML cell lines. A. Immunoblotting verifying the knock-out efficiency of LSP1 in HL-60 and MOLM-14 cell lines. B. Immunoblotting of KSR/ERK activation in the control and shLSP1 groups. C. Histogram showing the relative expression of p-KSR and p-ERK from immunoblotting. D. Diagram of cell proliferation rate for the indicated HL-60 groups. E. Diagram of cell proliferation rate for the indicated MOLM-14 groups. F. Percentage of cell cycle in the control and shLSP1 groups. G. Histogram of DCFH-DA intensity in the control and shLSP1 groups.
LSP1 promotes AML cell migration, chemotaxis and increases homing and survival
Previous reports have demonstrated that LSP1 controls cell adhesion and migration in tumor and immune cells by interacting with F-actin or myosin1e [Citation16,Citation25]. Increased cell mobility is considered essential for AML cells. Based on this, we detected whether the knock-out of LSP1 could affect the migration of HL-60 cell line by locomotion assay. We found that knock-out of LSP1 significantly impaired their migration rate within 2 h ((A)). These cells only achieved half of the migration distance compared to the control HL-60 cell line after 2 h ((B)). Cell migration assay also demonstrated that the knock-out of LSP1 in the HL-60 cell line damages its chemotaxis and migration abilities ((C)). Similarly, in the MOLM-14 cell line, cell migration ((D)) and chemotaxis ((E)) were both inhibited after LSP1 knock-out. These results demonstrated that LSP1 promotes migration and chemotactic abilities in AML cells.
Figure 3. Knock-out of LSP1 restricts cell migration and homing in AML cell lines. A. line graph showing cell locomotion distance of HL-60 cells with or without LSP1 knock-out. B. Histogram showing the migration distance of HL-60 cells with or without LSP1 knock-out after 2 h. C. Histogram showing cell number counts of migration. D. Histogram showing migration distance of MOLM-14 with or without LSP1 knock-out after 2 h. E. Histogram showing cell number counts of migration. F. Diagram of percentage of HL-60 cells in transplanted mice. G. Histogram showing percentage of HL-60 cells in transplanted mice. H. Kaplan-Meier plot depicting the survival of mice transplanted with shCon HL-60 or shLSP1 HL-60 cells. I. H&E staining pictures of BM from mice transplanted with shCon or shLSP1 HL60 cells. J. Morphologic pictures of the spleen from mice transplanted with shCon or shLSP1 HL60 cells. K. Immunoblotting of KSR/ERK activation in BM cells from control and shLSP1 HL60-transplanted mice.
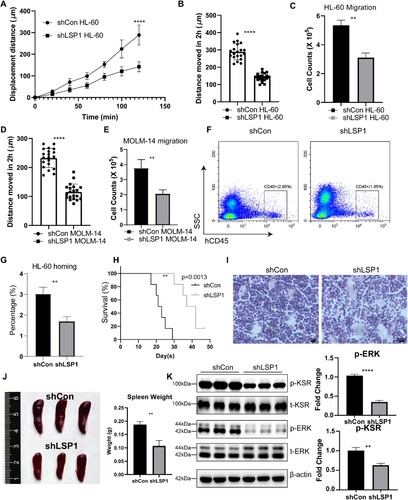
To confirm that LSP1 promotes AML cell migration and enhances survival, we generated a leukemia mouse model by injecting HL-60 cells into immunodeficient SCID mice via tail vein injection. Subsequently, we detected the number of HL-60 cells in BM 36 h after injection and found that knock-out of LSP1 obviously inhibited the homing ability of HL-60 cells ((F-G)). Furthermore, we found that shLSP1 transfected cells bearing mice exhibited prolonged survival compared to the control ((H)). shLSP1 HL-60 bearing mice exhibited less infiltration of leukemia cells in BM and reduced splenomegaly. The deficiency of LSP1 alleviated AML progression ((I-J)). we also verified decreased activation of KSR/ERK in BM cells from shLSP1 HL-60 bearing mice, which is consistent with the in vitro results ((K)). These results suggested that LSP1 could enhance the homing and environmental chemotaxis of leukemia cells, promoting survival and stress resistance, ultimately driving disease progression.
LSP1 and its associated co-expression gene networks regulate AML progression and survival
LSP1 is thought to regulate the KSR/ERK pathway in AML progression, so we were keen to explore the protein network through which LSP1 interacts. To explore the interactions between LSP1 and its related genes, we searched analogous gene sets related to LSP1 in AML from GEPIA2 and XIANTAO. We filtrated 40 genes that exhibited simultaneous correlation with LSP1 in AML ((A)). Then, we used STRING to predict the interactions between LSP1 and these genes, demonstrating that LSP1 serves as the center axis in a signaling pathway with strong direct or indirect interaction with these genes ((B)). These genes formed interaction networks that collaboratively regulate the function of leukemia cells. To understand the function of the 40 genes, we conducted a GO enrichment analysis ((C)) and showed that these genes were primarily enriched in the process of cell adhesion, migration and the RAS signaling pathway. The key genes associated with cell adhesion included CD300A, ITGAL, PREX1, RAC2, SASH3 and STK10, while those linked to the RAS signaling pathway included CYTH1, CYTH4, PIK3R5, CSK, RASA3, ARHGEF1 ((D)). Correlation analysis revealed that both adhesion-related genes and RAS signaling pathway-related genes had significant co-expression relationships with LSP1. these findings confirmed that LSP1, along with adhesion- and RAS-related genes, forms a signaling network that selectively regulates AML progression.
Figure 4. LSP1-related gene sets exhibit diagnostic and prognostic value in AML. A. Heatmap showing the correlated expression of 40 genes in AML patients. B. STRING assay of protein interaction among LSP1 and the co-expressed 40 genes. C. Histogram showing the GO enrichment of the co-expressed 40 genes. D. Chart of selected gene sets that associated with LSP1. E. Histogram of Ras signaling-related gene expression in AML. F. Histogram showing the relative mRNA levels of the indicated genes in shCon and shLSP1 HL-60 cells. G. Kaplan-Meier plot depicting the overall survival of AML patients, with patients divided according to these Ras signaling-related genes. H. Histogram of cell adhesion-related gene expression in AML. I. Histogram displaying the relative mRNA levels of the indicated genes in shCon and shLSP1 HL-60 cells. J. Kaplan-Meier plot depicting the overall survival of AML patients, with patients divided according to these cell adhesion-related genes.
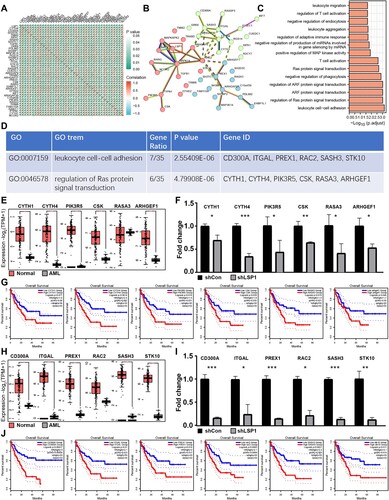
Next, We examined the expression of these related genes to determine whether they exhibited similar expression patterns. RAS signaling pathway-related genes, including CYTH1, CYTH4, PIK3R5, CSK, RASA3, and ARHGEF1, all showed elevated expression in AML cells compared to healthy donors ((E)). Moreover, RT-qPCR result demonstrated that the expression of these related genes was decreased significantly after LSP1 knock-out in AML cells ((F)). Consisting with LSP1, patients with high expression of these Ras signaling-related genes exhibited poor prognoses, suggesting that changes in LSP1-related RAS signaling pathway genes could serve as prognostic indicators for AML ((G)). Additionally, genes related to cell adhesion, such as CD300A, ITGAL, PREX1, SASH3 and STK10, were consistently upregulated ((H)). We further proved that expression of these cell adhesion genes related to LSP1 was decreased obviously in shLSP1 cells ((I)). Moreover, AML patients with high expression of these cell adhesion genes showed worse prognoses, suggesting that these genes could be the prognostic indicators related to LSP1 in AML patients ((J)). In summary, we have found LSP1-related RAS signaling pathways and cell adhesion-related genes, that are closely related to LSP1 expression and can be utilized alongside LSP1 as prognostic indicators for AML. LSP1 and its related genes work in synergy to promote AML progression.
Discussion
Leukemia arises from the prolonged persistence and uncontrolled proliferation of LSCs, resulting in ineffective hematopoiesis, multiple organ failure, oncurrent infection and death. Unfortunately, the lack of effective treatments specifically targeting LSCs has hindered the management of leukemia [Citation26]. Additionally, the challenge of distinguishing LSCs from HSCs at the cellular level further complicates the diagnosis and treatment of leukemia [Citation27]. In our study, we observed a significant increase in LSP1 expression among AML patients, suggesting that LSP1 could serve as a potential diagnostic target for AML.
Our results revealed that LSP1 primarily shortens survival by activating the RAS signaling pathway and increasing the malignant proliferation of leukemia. The dysregulation of the RAS signaling pathway has been well-documented in various solid tumors and forms of leukemia, where it plays a pivotal role in processes such as cell proliferation, survival, differentiation, and migration [Citation28].
Furthermore, the mobilization and migration of HSCs are critical for their maintenance, homeostasis and BM remodeling [Citation29], In contrast, LSCs exhibit heightened migratory and homing abilities, enabling them to thrive under environmental stress [Citation30]. Understanding the mechanisms governing LSCs migration and homing can provide effective targets for leukemia treatment and address minimal residual disease [Citation31]. In our study, we demonstrated that LSP1 regulates leukemia cells migration. Inhibiting LSP1 reduces leukemia cells migration, chemotaxis and homing, leading to the deceleration of leukemia progression and improved survival rate in mice. Previous research has confirmed that LSP1 can combine with F-actin or myosin1e, regulating cell skeleton proteins, increasing cell stiffness, and enhancing mobility. LSP1 mobilization boots the mobility of LSCs by regulating LSCs cytoskeleton, thereby promoting leukemia cell migration and homing, creating a more suitable microenvironment, and bolstering environmental resistance.
Moreover, LSP1 has been identified as a prognostic indicator for AML [Citation32,Citation33]. In our study, we also discovered that genes such as CYTH1, CYTH4, PIK3R5, CSK, RASA3 and ARHGEF1 are coregulated with LSP1 within the Ras signaling pathway, while genes like CD300A, ITGAL, PREX1, SASH3 and STK10 coregulate with LSP1 to influence the mobility of AML cells. These genes are associated with poor survival in AML patients and could be valuable components of a prognostic scoring system for AML [Citation34].
Taken together, our findings indicate that AML cells benefit from the expression of LSP1, and its knock-out attenuates the malignant behavior of AML cells, including cell proliferation, migration and homing, resulting in prolonged survival. Their effects are partially regulated by the MEK/ERK signaling pathway. Additionally, we identified a series of genes related to LSP1, which can be classified as related to the RAS signaling pathway and cell adherent and migration. These genes are co-expressed with LSP1, exhibit high expression in leukemia cells, and are associated with poor patient survival. Combining these genes with LSP1 creates an interaction gene set that can serve as an indicator of AML occurrence and prognosis and may offer potential gene targets for treating AML.
Acknowledgments
The authors thank the colleagues from the Department of Hematology for their support and help.
Disclosure statement
No potential conflict of interest was reported by the authors.
Additional information
Funding
References
- Heuser M, et al. Acute myeloid leukaemia in adult patients: ESMO Clinical Practice Guidelines for diagnosis, treatment and follow-up. Ann Oncol. 2020;31(6):697–712. doi:10.1016/j.annonc.2020.02.018
- Wojcicki AV, et al. Metabolomics in acute myeloid leukemia. Mol Genet Metab. 2020;130(4):230–238. doi:10.1016/j.ymgme.2020.05.005
- Sung PJ, Luger SM. Minimal residual disease in acute myeloid leukemia. Curr Treat Options Oncol. 2017;18(1):1. doi:10.1007/s11864-017-0447-3
- Zeng AGX, et al. A cellular hierarchy framework for understanding heterogeneity and predicting drug response in acute myeloid leukemia. Nat Med. 2022;28(6):1212–1223. doi:10.1038/s41591-022-01819-x
- Lu J, et al. Eukaryotic initiation factor-2, gamma subunit, suppresses proliferation and regulates the cell cycle via the MAPK/ERK signaling pathway in acute myeloid leukemia. J Cancer Res Clin Oncol. 2021;147(11):3157–3168. doi:10.1007/s00432-021-03712-5
- McMahon CM, et al. Clonal selection with RAS pathway activation mediates secondary clinical resistance to selective FLT3 inhibition in acute myeloid leukemia. Cancer Discov. 2019;9(8):1050–1063. doi:10.1158/2159-8290.CD-18-1453
- Schmalbrock LK, et al. Clonal evolution of acute myeloid leukemia with FLT3-ITD mutation under treatment with midostaurin. Blood. 2021;137(22):3093–3104. doi:10.1182/blood.2020007626
- Duarte D, et al. Inhibition of endosteal vascular niche remodeling rescues hematopoietic stem cell loss in AML. Cell Stem Cell. 2018;22(1):64–77 e6. doi:10.1016/j.stem.2017.11.006
- Boyd AL, et al. Niche displacement of human leukemic stem cells uniquely allows their competitive replacement with healthy HSPCs. J Exp Med. 2014;211(10):1925–1935. doi:10.1084/jem.20140131
- Mead AJ, et al. Niche-mediated depletion of the normal hematopoietic stem cell reservoir by Flt3-ITD-induced myeloproliferation. J Exp Med. 2017;214(7):2005–2021. doi:10.1084/jem.20161418
- Johansen S, et al. The possible importance of beta3 integrins for leukemogenesis and chemoresistance in acute myeloid leukemia. Int J Mol Sci. 2018;19(1. doi:10.3390/ijms19010251
- Pelletier SD, et al. Lack of the adhesion molecules P-selectin and intercellular adhesion molecule-1 accelerate the development of BCR/ABL-induced chronic myeloid leukemia-like myeloproliferative disease in mice. Blood. 2004;104(7):2163–2171. doi:10.1182/blood-2003-09-3033
- Su L, Hu Z, Yang YG. Role of CXCR4 in the progression and therapy of acute leukaemia. Cell Prolif. 2021;54(7):e13076. doi:10.1111/cpr.13076
- Jongstra-Bilen J, Jongstra J. Leukocyte-specific protein 1 (LSP1): a regulator of leukocyte emigration in inflammation. Immunol Res. 2006;35(1-2):65–74. doi:10.1385/IR:35:1:65
- Le NPK, et al. Deficiency of leukocyte-specific protein 1 (LSP1) alleviates asthmatic inflammation in a mouse model. Respir Res. 2022;23(1):165. doi:10.1186/s12931-022-02078-7
- Scharinger K, et al. LSP1-myosin1e bimolecular complex regulates focal adhesion dynamics and cell migration. FASEB J. 2021;35(2):e21268. doi:10.1096/fj.202000740RR
- Le NP, et al. Leukocyte-specific protein 1 regulates neutrophil recruitment in acute lung inflammation. Am J Physiol Lung Cell Mol Physiol. 2015;309(9):L995–1008. doi:10.1152/ajplung.00068.2014
- Hossain M, et al. Endothelial LSP1 modulates extravascular neutrophil chemotaxis by regulating nonhematopoietic vascular PECAM-1 expression. J Immunol. 2015;195(5):2408–2416. doi:10.4049/jimmunol.1402225
- Cong P, et al. MiR-920 and LSP1 co-regulate the growth and migration of glioblastoma cells by modulation of JAK2/STAT5 pathway. J Bioenerg Biomembr. 2020;52(5):311–320. doi:10.1007/s10863-020-09848-2
- Meyer WH, Howard TH. Actin polymerization and its relationship to locomotion and chemokinetic response in maturing human promyelocytic leukemia cells. Blood. 1987;70(2):363–367. doi:10.1182/blood.V70.2.363.363
- Li Y, et al. LSP1 modulates the locomotion of monocyte-differentiated U937 cells. Blood. 2000;96(3):1100–1105. doi:10.1182/blood.V96.3.1100
- Hossain M, et al. ICAM-1-mediated leukocyte adhesion is critical for the activation of endothelial LSP1. Am J Physiol Cell Physiol. 2013;304(9):C895–C904. doi:10.1152/ajpcell.00297.2012
- Harrison RE, Sikorski BA, Jongstra J. Leukocyte-specific protein 1 targets the ERK/MAP kinase scaffold protein KSR and MEK1 and ERK2 to the actin cytoskeleton. J Cell Sci. 2004;117(Pt 10):2151–2157. doi:10.1242/jcs.00955
- Wu Y, et al. MAPKAPK2-mediated LSP1 phosphorylation and FMLP-induced neutrophil polarization. Biochem Biophys Res Commun. 2007;358(1):170–175. doi:10.1016/j.bbrc.2007.04.104
- Li Y, Guerrero A, Howard TH. The actin-binding protein, lymphocyte-specific protein 1, is expressed in human leukocytes and human myeloid and lymphoid cell lines. J Immunol. 1995;155(7):3563–3569. doi:10.4049/jimmunol.155.7.3563
- Dohner H, Wei AH, Lowenberg B. Towards precision medicine for AML. Nat Rev Clin Oncol. 2021;18(9):577–590. doi:10.1038/s41571-021-00509-w
- Hosen N, et al. CD96 is a leukemic stem cell-specific marker in human acute myeloid leukemia. Proc Natl Acad Sci USA. 2007;104(26):11008–11013. doi:10.1073/pnas.0704271104
- Simanshu DK, Nissley DV, McCormick F. RAS proteins and their regulators in human disease. Cell. 2017;170(1):17–33. doi:10.1016/j.cell.2017.06.009
- Ni F, et al. Ptpn21 controls hematopoietic stem cell homeostasis and biomechanics. Cell Stem Cell. 2019;24(4):608–620 e6. doi:10.1016/j.stem.2019.02.009
- Li M, et al. METTL3 mediates chemoresistance by enhancing AML homing and engraftment via ITGA4. Leukemia. 2022;36(11):2586–2595. doi:10.1038/s41375-022-01696-w
- Salvestrini V, et al. Purinergic signaling inhibits human acute myeloblastic leukemia cell proliferation, migration, and engraftment in immunodeficient mice. Blood. 2012;119(1):217–226. doi:10.1182/blood-2011-07-370775
- Wagner S, et al. A parsimonious 3-gene signature predicts clinical outcomes in an acute myeloid leukemia multicohort study. Blood Adv. 2019;3(8):1330–1346. doi:10.1182/bloodadvances.2018030726
- Zhao X, Li Y, Wu H. A novel scoring system for acute myeloid leukemia risk assessment based on the expression levels of six genes. Int J Mol Med. 2018;42(3):1495–1507.
- Moore AR, et al. RAS-targeted therapies: is the undruggable drugged? Nat Rev Drug Discov. 2020;19(8):533–552. doi:10.1038/s41573-020-0068-6