
Abstract
The changes in accumulation of two potential osmoprotectants (proline and glycine betaine), lipid peroxidation appraised as malondialdehyde (MDA) level, activities of key antioxidant enzymes such as superoxide dismutase (SOD: EC 1.15.1.1), catalase (CAT: EC 1.11.1.6), peroxidase (POD: EC 1.11.1.7), and glutathione reductase (GR: EC 1.6.4.2), and soluble protein profile in two cultivars of mulberry (S146 and Sujanpuri) differing in alkalinity (NaHCO3) tolerance were investigated at 2-month intervals up to 6-month growth under stress conditions. Varying levels of salinity–alkalinity developed in soil were 0, 30, 40, and 50 g of NaHCO3 kg−1 soil with pH 7.8, 9.1, 9.8, and 10.3, respectively. Alkali stress led to a consistent accumulation of proline and glycine betaine in mulberry leaves with time. The activities of leaf SOD, CAT, POD, and GR increased with increase in external salt concentration and pH. The increase in antioxidant enzyme activities was higher in cv. S146 than cv. Sujanpuri, whereas rate of lipid peroxidation measured in terms of MDA was higher in cv. Sujanpuri as compared to cv. S146. Protein profile revealed that some unknown proteins of low molecular mass (10–32.5 kDa) were induced by NaHCO3 stress, but differently in two cultivars.
| Abbreviations | ||
| ROS | = | reactive oxygen species |
| GB | = | glycine betaine |
| MDA | = | malondialdehyde |
| SOD | = | superoxide dismutase |
| CAT | = | catalase |
| POD | = | peroxidase |
| GR | = | glutathione reductase |
1. Introduction
Salt affected soils have been categorized into three different types such as saline, saline–alkali, and alkaline soils depending on total concentration (electrical conductivity) of soluble salts they possess, pH of the soil solution, and exchangeable sodium percentage of the soil (Qadir et al. Citation2006; Rasool et al. Citation2012). Although NaCl is the dominant salt in most salt affected soils, other salts such as Na2SO4, MgCl2, KCl, NaHCO3 are also frequently found in considerable amounts in such soils (Bie et al. Citation2004). High levels of alkalinity in soil or irrigation waters adversely affect seed germination and crop growth and productivity (Wang et al. Citation2011; Lin et al. Citation2012; Zhang et al. Citation2012). Much work has been done on the salinity tolerance of various crops using NaCl, whereas pH of the root-growing medium has been maintained close to neutral. Alkalinity is associated with the presence of sodium in soil such as Na2CO3 or NaHCO3 which damages plants by sodium toxicity as well as high pH (Chen et al. Citation2012). However, relatively few studies have been undertaken on the effects of alkaline soils on plant growth and productivity. The investigations carried out on the effects of alkalinity developed by NaHCO3 on two populations of Populus cathayana (Lu et al. Citation2009) have revealed that increasing pH of the saline growth medium causes more damage to cell membranes. The alkalinity at the same time severely upsets the mechanism of ion uptake in both populations. Not much work has been conducted on antioxidant studies under alkalinity stress.
Mulberry is an economically important tree in the global plant diversity. It is cultivated under both irrigated and rain-fed conditions. Salt problems are generally more pronounced in the areas of tropical and subtropical regions (Agastian & Vivekananda Citation1997; Kumar et al. Citation1999; Lal et al. Citation2008; Jaleel et al. Citation2009; Vijayan et al. Citation2003, Citation2009), which hamper its fruit yield and leafy biomass. Salinity tolerance of these trees has not been investigated extensively at the physiological and biochemical levels. In view of this, the present study was undertaken to examine the effects of saline–alkaline medium created by NaHCO3 on two potential osmoprotectants such as proline and glycine betaine, some key antioxidant enzymes, extent of salt-induced lipid peroxidation, and changes in soluble proteins in two mulberry cultivars differing in tolerance to NaHCO3.
Soil is affected with different salts such as NaCl, Na2SO4, NaHCO3, Na2CO3, etc. The impact of salt stress generally contains osmotic and ionic stress effects. However, alkali stress added the influence of high pH which inhibits ion uptake and disrupts ionic balance of plant cells. Alkalinity stress is more harmful than salinity stress and is reported by many researchers (Guo et al. Citation2010; Wang et al. Citation2011; Javid et al. Citation2012; Lin et al. Citation2012). Maximum papers are published on salinity stress on plants and the research on alkalinity stress is very less. The biochemical and antioxidative responses in plants during alkalinity stress is very less. Alkalinity stress being the most crucial part which plants face in the era of climate change, so need to be studied extensively at par with salinity stress.
2. Materials and methods
2.1. Plant material and NaHCO3 treatment
Nodal cuttings of 15 cm in length comprising at least 3–4 active buds were excised from field grown 2-year old S146 and Sujanpuri cultivars of Morus alba L. These were spontaneously planted in polythene bags containing soil and sand (3:1 ratio). Before planting, the required pH in the soil was attained by applying 0, 30, 40, and 50 g of NaHCO3 kg−1 soil. The bags were left under natural climatic conditions with a mean photoperiod of 12–13 h and a temperature of 28 ± 4°C. These were watered daily and pH of the soil extract was monitored, and adjusted at regular intervals. Experiment was conducted using expanded third leaf from the top of the plant. The data on growth and biomass yield, shoot length, and fresh and dry weights were recorded after 2, 4, and 6 months of the application of NaHCO3 treatment.
Proline concentration was determined using the method of Bates et al. (Citation1973). Fresh leaves (300 mg) were homogenized in 10 ml of 3% aqueous sulfosalicylic acid. The homogenate was centrifuged at 9000 × g for 15 min. A 2-ml aliquot of the supernatant was mixed with an equal volume of acetic acid and acidic ninhydrin, and then incubated for 1 h at 100°C, and reaction was terminated in an ice bath before extraction with 4 ml of toluene. The extract was vortexed for 20 s, the chromatophore-containing toluene was aspirated from the aqueous phase, and absorbance was determined photometrically at 520 nm (Beckman 640 D, USA) using toluene for a blank.
Glycine betaine was measured according to Grieve and Grattan (Citation1983). Dried and finely ground plant material (300 mg) was mechanically shaken with 20 ml deionized water for 24 h at 25°C. The samples were then filtered and the filtrates were diluted (1:1) with 2 N H2SO4. Aliquots (0.5 ml) were taken into centrifuge tubes and cooled in ice bath for 1 h. Cold KI-I2 reagent (0.20 ml) was added and then reactants were gently stirred. The tubes were stored at 4°C for 16 h and then centrifuged at 10,000 rpm for 15 min at 0°C. The supernatant was carefully aspirated with a fine tipped glass tube. The periodide crystals were dissolved in 9.0 ml of 1,2-dichloroethane and mixed vigorously. After 2 h, the absorbance was measured at 365 nm using a spectrophotometer. A reference standard of glycine betaine (50–200 mg ml−1) was prepared in 1 N H2SO4.
Lipid peroxidation was determined by measuring malondialdehyde (MDA) formation according to Madhava Rao and Sresty (Citation2000). Fresh leaves of 300 mg were homogenized with 2.5 ml of 0.1% trichloroacetic acid (TCA). The homogenate was centrifuged for 10 min at 10,000 rpm. For every 1 ml of the aliquot, 4 ml of 20% TCA containing 0.5% thiobarbituric acid was added. The mixture was heated at 95°C for 30 min and then cooled quickly on an ice bath. Afterwards, the mixture was centrifuged for 15 min at 10,000 rpm and the absorbance of the supernatant was measured at 532 nm. Measurements were corrected for unspecific turbidity by subtracting the absorbance at 600 nm. The concentration of MDA was calculated using an extinction coefficient of 155 mM−1 cm−1.
The enzyme extraction was performed with fresh leaf material (0.3 g) homogenized in 5.0 ml of extraction mixture (100 mM potassium phosphate buffer of pH 7.0 and 0.1 mM ethylenediaminetetraacetic acid [EDTA]). The process was carried out under cold conditions (4°C). After filtering the sample, it was centrifuged at 10,000 × g for 20 min and the supernatant so obtained was used for enzyme.
Superoxide dismutase (SOD) activity was estimated following the method of Dhindsa et al. (Citation1981). The assay mixture, consisting of 1.5 ml reaction buffer, 0.2 ml of methionine, 0.1 ml enzyme extract with equal amount of 1 M Na2CO3, 2.25 mM nitroblue tetrazolium (NBT) solution, 3 mM EDTA, 60 mM riboflavin, and 1.0 ml of double distilled water, was incubated under a 15 W inflorescent lamp for 10 min at 25/28°C. Blank A, containing the same reaction mixture, was placed in the dark. Blank B containing the same reaction mixture except for the enzyme extract was placed in light along with the sample. The reaction was terminated by switching off the light, and the tubes were covered with a blank cloth. Absorbance at 560 nm of each sample along with blank B was read against blank A and the difference in percentage of color reduction between blank B and the sample was calculated. Fifty percent of color reduction was considered one unit of enzyme activity, and activity was expressed as EU mg−1 protein.
Catalase (CAT) activity in leaves was estimated by the method given by Aebi (Citation1984). CAT activity was determined by examining the disappearance of H2O2 by measuring a dropping off in absorbance at 240 nm. The reaction was carried out in a final volume of 2 ml of reaction mixture containing reaction buffer with 0.1 ml of 3 mM EDTA, 0.1 ml of enzyme extract, and 0.1 ml of 3 mM H2O2. The reaction was allowed to run for 10 min. Activity was calculated using extinction coefficient (ε) 0.036/mM/cm and expressed in EU/mg protein. One unit of enzyme determined the amount necessary to decompose 1 µmol of H2O2 per min at 25°C.
For peroxidase (POD) activity, method given by Kar and Mishra (Citation1976) was used. Five milliliters of the assay mixture for the POD activity comprised 125 µmoles of phosphate buffer, pH 6.8, 50 µmoles of pyrogallol, 50 µmoles of H2O2, and 1 ml of the 20 times diluted enzyme extract. This was incubated for 5 min at 25°C after which the reaction was stopped by adding 0.5 ml of 5% (v/v) H2SO4. The amount of purpurogallin formed was determined by taking the absorbance at 420 nm. Change in enzyme units mg−1 protein denoted the enzyme activity.
Glutathione reductase (GR) activity was assayed as per the method of Foster and Hess (Citation1980). The reaction mixture consists of enzyme extract, 100 mM potassium phosphate buffer (pH 7.0) containing 1.0 mM EDTA, 150 mM nicotinamide adenine dinucleotide phosphate (NADPH), and 500 mM oxidized glutathione. The enzyme activity was measured at 340 nm. Activity was calculated using the extinction coefficient for NADPH of 6.22 mM−1 cm−1 and expressed as mmol NADPH oxidized mg−1 protein.
To determine the molecular weight of the protein subsets, SDS-PAGE under denaturing conditions was used as described by Laemmli (Citation1970) using 12.5% acrylamide concentration. Each sample (protein extract) was subjected to 95°C for 2 min in 10 mM Tris–HCl (pH 7) that contained 2% (w/v) SDS, 2% β-mercaptoethanol, and 5% (w/v) glycerol, before electrophoresis. An aliquot (40 µl) of the prepared sample was loaded per well after mixing with loading buffer bromophenol blue and glycerine. The gel was removed from the apparatus, immersed in staining solution containing coomassie brilliant blue-R250. Broad range molecular weight marker was used to estimate the molecular weights of the sample proteins.
2.2. Statistical analysis of data
Data for each growth or biochemical parameter were subjected to analysis of variance using Agris Statistical software program (AgRes 3.01). Critical difference was worked out at 5% level of probability.
3. Results
3.1. Growth and biomass yield
The results related to the effect of NaHCO3 on growth and biomass yield are depicted in –. The shoot length decreases in both cultivars at all stress levels. The concentration of 50 g NaHCO3 kg−1 soil decreases the shoot length to 53.4% in S146 and 69.7% in Sujanpuri as compared to the control after 6 months (). The fresh weight also decreased by 54.6% in S146 and 62.6% in Sujanpuri as compared to the control after 6 months. A decrease in dry weight in both cultivars was observed as 55.2% and 67% in S146 and Sujanpuri, respectively, as compared to the control after 6 months ( and ).
Note: T1 = 0.0, pH 7.8; T2 = 30 g, pH 9.1; T3 = 40 g, pH 9.8; and T4 = 50 g, pH 10.3.
![Figure 1. Effect of different concentrations of NaHCO3 (g/kg soil) on shoot length (A), shoot fresh weight (B), and shoot dry weight (C) of two cultivars of mulberry (means SE; n = 5). All treatments are significantly different at P ≤ 0.05 from control (Duncan's multiple range test [DMRT]).Note: T1 = 0.0, pH 7.8; T2 = 30 g, pH 9.1; T3 = 40 g, pH 9.8; and T4 = 50 g, pH 10.3.](/cms/asset/0ef02049-6597-4b8c-bb1f-55440eb2029c/tjpi_a_855271_f0001_b.jpg)
3.2. Free proline content
The results related to the effect of NaHCO3 on proline content are presented in . The proline content increased to 82% in S146 and 77% in Sujanpuri at 50 g NaHCO3 kg−1 soil after 2 months. Further increase of 87% and 79.7% in proline content was observed in S146 and Sujanpuri, respectively, at 50 g NaHCO3 kg−1 soil after 6 months.
Note: T1 = 0.0, pH 7.8; T2 = 30 g, pH 9.1; T3 = 40 g, pH 9.8; and T4 = 50 g, pH 10.3.
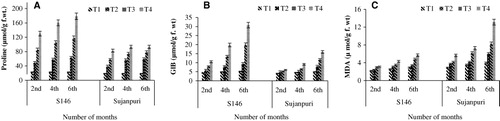
3.3. Glycine betaine
Glycine betaine content increased significantly in the salt stressed leaves of both cultivars (). However, the magnitude of increase was greater in the leaves of cv. S146 than cv. Sujanpuri. The glycine betaine increased by 59.5% in the stressed leaves of S146 and 32.9% in Sujanpuri after 2 months of application of NaHCO3 stress. However after 6 months of treatment, S146 showed an increase of 83.3% and Sujanpuri showed 69% as compared to control.
3.4. Lipid peroxidation
Salt stress caused a significant increase in MDA content in both the cultivars at all stress levels (). The degree of accumulation was 29.3%, 40.6%, and 48.9% in S146 after 2, 4, and 6 months, respectively, at 50 g NaHCO3 kg−1 soil. However, Sujanpuri showed 49.1% after 2 months, 51.8% after 4 months, and 69.8% after 6 months at 50 g NaHCO3 kg−1 soil.
3.5. SOD activity
The activity of SOD increased in both mulberry cultivars at all concentrations of NaHCO3 and the results are presented in . After 2 months of NaHCO3 stress, the increase of SOD activity was 43.4% and 41.8% in S146 and Sujanpuri, respectively, at 50 g NaHCO3 kg−1 soil. Further increase of 62.1% in S146 and 61.1% in Sujanpuri was observed after 6 months at the same NaHCO3 level.
Note: T1 = 0.0, pH 7.8; T2 = 30 g, pH 9.1; T3 = 40 g, pH 9.8; and T4 = 50 g, pH 10.3.
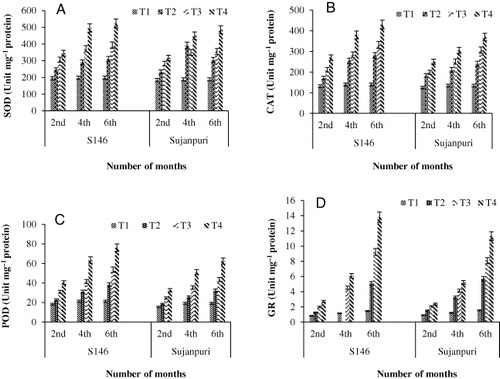
3.6. CAT activity
The results regarding effect of NaHCO3 on CAT activity are presented in . The increase in CAT activity was 51% in S146 and 49.9% in Sujanpuri after 2 months of treatment with 50 g NaHCO3 kg−1 soil, and it further increased to 67.3% and 63.4%, in S146 and Sujanpuri cultivars, respectively, after 6 months. A significant increase in CAT activity was observed only after 6 months and was concentration- and time-dependent.
3.7. POD activity
The results related to the effect of NaHCO3 on POD activity are presented in . The POD activity increased in both cultivars but the maximum increase was observed in S146 than Sujanpuri. The POD activity increased in the order of 54.7% < 66.5% < 72% in S146 and 52.5% < 62.4% < 69.2% in Sujanpuri after 2, 4, and 6 months of stress, respectively, at 50 g NaHCO3 kg−1 soil.
3.8. GR activity
The GR activity increased in both cultivars on exposure to NaHCO3 and the results are depicted in . After 6 months of treatment with 50 g NaHCO3 kg−1 soil, S146 cultivar showed an increase of 46.6% and Sujanpuri showed 42.9% as compared to control.
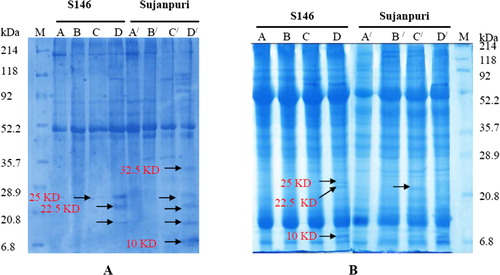
3.9. Expression of proteins of different molecular mass
Highest NaHCO3 treatment for 2 months caused the expression of new low molecular mass proteins (21.0, 22.5, and 25 kDa) in cv. S146 (, lane D) after 2 months, whereas the same proteins along with two other protein molecules of 10 and 32.5 kDa appeared in cv. Sujanpuri (, lane D/). However, after 6 months of NaHCO3 treatment, the expression of protein of 22.5 kDa was masked in both cultivars and new protein molecules of 24 and 57 kDa appeared in both cultivars particularly at the treatment of 50 g NaHCO3 kg−1 soil (, lanes D and D/).
Note: M = marker, A = control, B = 30 g, C = 40 g, D = 50 g NaHCO3, A/ = control, B/ = 30 g, C/ = 40 g, and D/ = 50 g NaHCO3.
4. Discussion
Alkalinity is known to suppress growth and yield of most plants, but its effects due to high pH have been reported to be more severe than those of salt stress (Lu et al. Citation2009; Ahmad & Sharma Citation2010). In our studies, we found out that sodium carbonate-induced alkalinity caused a marked inhibition in the growth of two mulberry cultivars appraised as shoot fresh and dry weights and shoot length, but this reduction in growth was more pronounced in cv. Sujanpuri than in cv. S146. Such a NaHCO3-induced decrease in growth has earlier been reported in two populations of a tree species, P. cathayana (Lu et al. Citation2009). The growth inhibition caused by salt stress has been reported in Triticum aestivum (Guo et al. Citation2010), Leymus chinesis (Sun & Hong et al. Citation2011), Medicago ruthenica (Yang et al. Citation2011), Brassica juncea (Javid et al. Citation2012), and variety of tree species e.g. Salvadora persica (Ramoliya et al. Citation2004), Olea europea (Chartzoulakis et al. Citation2002), and Simmondsia chinesis (Roussos et al. Citation2006). However, growth inhibition in a plant due to salt or alkali stress could occur due to regulation of a multitude of physiological and biochemical processes such as water relations (Munns Citation2002; Meloni & Martinez Citation2009; Ahmad et al. Citation2012b), ion transport and accumulation (Hasegawa et al. Citation2000), photosynthesis (Dubey Citation2005; Ashraf et al. Citation2008), accumulation of osmoprotectants (Ashraf & Foolad Citation2007; Koyro et al. Citation2012; Katare et al. Citation2012), synthesis of antioxidant enzymatic and nonenzymatic molecules (Mittler Citation2002; Ahmad et al. Citation2010; Patade et al. Citation2011; Bano et al. Citation2013; Kaya et al. Citation2013; Rasool et al. Citation2013), synthesis of plant growth regulators (Ashraf et al. Citation2010), mineral nutrient metabolism (Marschner Citation1995), and many others.
One of the most important biochemical responses of plants to abiotic stresses is overproduction of different types of compatible solutes such as proline, glycine betaine, sugars, soluble proteins, amino acids, etc. (Ahmad et al. Citation2007; Koyro et al. Citation2012). Of all compatible solutes, proline and glycine betaine occur widely in higher plants and accumulate in considerable amounts in salt stressed plants (Ahmad et al. Citation2006; Koyro et al. Citation2012; Ahmad et al. Citation2012b). In this study, both proline and GB increased markedly with increase in external NaHCO3 level and growth period. Relatively NaHCO3 tolerant cv. S146 was superior to cv. Sujanpuri in accumulating both osmoprotectants under alkaline regimes. This pattern of accumulation of the two osmoprotectants clearly shows that they could be used as potential indicators of alkalinity tolerance in mulberry as has earlier been reported in broad bean (Azooz et al. Citation2011), mustard (Ahmad et al. Citation2012a, Citation2012b), and chickpea (Rasool et al. Citation2013).
The membrane damage is reported to be a primary effect of salt stress on most plant species out of the variety of salt-induced adverse effects (Ashraf et al. Citation2008; Ahmad et al. Citation2012a, Citation2012b). Most common way of appraising membrane damage is the measurement of amount of MDA, which accumulates in the cells as a result of lipid peroxidation (Mandhania et al. Citation2006; Ahmad et al. Citation2012a, Citation2012b). It has been reported to be one of the important selection criteria of salt tolerance in most plants as salt sensitive plants generally accumulate higher amounts of MDA than do salt tolerant ones (Mandhania et al. Citation2006; Ahmad et al. Citation2012a, Citation2012b). In the present study, MDA content increased in both varieties with time as well as with increase in external NaHCO3 level. The varietal difference was also quite evident as S146 was relatively tolerant cultivar, accumulated markedly lower amounts of MDA as compared to cv. Sujanpuri. Similar findings have been reported in two diverse populations of P. cathayana (Lu et al. Citation2009).
Plants tend to counteract reactive oxygen species produced by stress (Ahmad et al. Citation2010, Citation2011; Bano et al. Citation2013; Kaya et al. Citation2013). They synthesize both enzymatic and nonenzymatic antioxidants in high amounts for this purpose (Ahmad et al. Citation2010, Citation2011). Most important enzymatic antioxidants are SOD, CAT, PODs, and GR. In this study, the activities of all four enzymes increased consistently with increase in NaHCO3 concentration of the growth medium as well as with increase in growth period. However, the activities were higher in cv. S146 than cv. Sujanpuri under alkaline regimes. A negative association between the activities of these enzymes and MDA content is evident from the results presented here, which clearly reveals that the tolerant cultivar produces excessive amounts of antioxidant enzymes to counteract a variety of oxidants generated by salt stress, which may have played an effective role in maintaining the stability of membranes. This is manifested from the lower accumulation of MDA in NaHCO3 tolerant cv. S146 than salt sensitive cv. Sujanpuri. Results showing NaHCO3-induced enhanced activities of different antioxidant enzymes as observed in two mulberry cultivars are in parallelity with those reported earlier in the same species under salt stress (Sudhakar et al. Citation2001; Harinasut et al. Citation2003; Ahmad et al. Citation2012b) and in P. cathayana under NaHCO3 stress (Lu et al. Citation2009).
Salt stress also causes considerable changes in the expression of soluble proteins or de novo synthesis of proteins of different molecular mass (Thomas & Bohnert Citation1993). In the present investigation, de novo synthesis of proteins of low molecular mass (21.0, 22.5, and 25.0 kDa) took place in both mulberry cultivars after 2 months of growth at the highest alkaline regime (50 g NaHCO3 kg−1 soil). However, with prolonged exposure (for 6 months) of cultivars, two new protein molecules of 24 and 57 kDa appeared in addition to the existing proteins. An osmotin-like protein (MW= 24–26 kDa) in salt stressed Mesembryanthemum crystallinum increased relative to that in nonstressed plants (Thomas & Bohnert Citation1993). Changes in the gene activation, transcription, and translation (protein synthesis) often occurs during the acclimatization process under stressful environments and thus are thought to be involved in the induction of tolerance to salts (Moran et al. Citation2002).
5. Conclusion
Overall, tolerance of mulberry plants to NaHCO3 was found to be associated with enhanced accumulation/synthesis of the key osmoprotectants, proline and glycine betaine, as well as upregulation of antioxidant enzymes such as SOD, CAT, POD, and GR. These biomolecules could act as potential biochemical selection criteria for tolerance in mulberry to NaHCO3.
Acknowledgments
This paper is part of PhD work of Dr Parvaiz Ahmad. S Sharma was the PhD guide of Dr Parvaiz Ahmad. Prof. S Gucel, cross checked the results which Dr Parvaiz got during the work on this paper and helped him a lot in writing this paper. Prof. Munir Ozturk, drafted the experimental design, which cultivars we should use and also helped Dr Parvaiz in statistical analysis of this paper. Authors are thankful to CSIR-New Delhi, India for providing financial assistance to PA.
References
- Aebi, H. 1984. Catalase invitro. Method Enzymol. 105:121–126.
- Agastian STP, Vivekananda M. 1997. Effect of induced salt stress on growth and uptake of mineral nutrients in mulberry (Morus alba) genotypes. Indian J Agric Sci. 67:469–472.
- Ahmad P. 2010. Growth and antioxidant responses in mustard (Brassica juncea L.) plants subjected to combined effect of gibberellic acid and salinity. Arch Agro Soil Sci. 56:575–588. doi:10.1080/03650340903164231
- Ahmad P, Ashraf M, Azooz MM, Rasool S, Akram NA. 2012a. Potassium starvation-induced oxidative stress and antioxidant defense responses in Brassica juncea. J Plant Interact. doi:10.1080/17429145.2012.747629
- Ahmad P, Hakeem KR, Kumar A, Ashraf M, Akram NA. 2012b. Salt-induced changes in photosynthetic activity and oxidative defense system of three cultivars of mustard (Brassica juncea L.) Afr J Biotechnol. 11:2694–2703.
- Ahmad P, Jaleel CA, Salem MA, Nabi G, Sharma S. 2010. Roles of enzymatic and non-enzymatic antioxidants in plants during abiotic stress. Crit Rev Biotechnol. 30:161–175. doi:10.3109/07388550903524243
- Ahmad P, Nabi G, Jeleel CA, Umar S. 2011. Free radical production, oxidative damage and antioxidant defense mechanisms in plants under abiotic stress. In: Ahmad P, Umar S, editors. Oxidative stress: role of antioxidants in plants. New Delhi: Studium Press Pvt. Ltd; p. 19–53.
- Ahmad P, Sharma S. 2010. Physio-biochemical attributes in two cultivars of mulberry (M. alba) under NaHCO3 stress. Int J Plant Produc. 4:79–86.
- Ahmad P, Sharma S, Srivastava PS. 2006. Differential physio-biochemical responses of high yielding varieties of mulberry (Morus alba) under alkalinity (Na2CO3) stress in vitro. Physiol Mol Biol Plant. 12:59–66.
- Ahmad P, Sharma S, Srivastava PS. 2007. In vitro selection of NaHCO3 tolerant cultivars of Morus alba (Local and Sujanpuri) in response to morphological and biochemical parameters. Hortic Sci (Prague). 34:115–123.
- Ashraf M, Akram NA, Arteca RN, Foolad MR. 2010. The role of plant hormones in salinity tolerance of plants: brassinosteroids and salicylic acid. Crit Rev Plant Sci. 29:162–190. doi:10.1080/07352689.2010.483580
- Ashraf M, Athar HR, Harris PJC, Kwon TR. 2008. Some prospective strategies for improving crop salt tolerance. Adv Agron. 97:45–110.
- Ashraf M, Foolad MR. 2007. Improving plant abiotic stress resistance by exogenous application of osmoprotectants, glycinebetaine and proline. Environ Exp Bot. 59:206–216. doi:10.1016/j.envexpbot.2005.12.006
- Azooz MM, Youssef AM, Ahmad P. 2011. Evaluation of salicylic acid (SA) application on growth, osmotic solutes and antioxidant enzyme activities on broad bean seedlings grown under diluted seawater. Inter J Plant Physiol Biochem. 3:253–264.
- Bano S, Ashraf M, Akram NA. 2013. Salt stress regulates enzymatic and nonenzymatic antioxidative defense system in the edible part of carrot (Daucus carota L.). J Plant Interact. doi:10.1080/17429145.2013.832426
- Bates L, Waldren PP, Teare JD. 1973. Rapid determination of free proline of water stress studies. Plant Soil. 39:205–207.
- Bie Z, Ito T, Shinohara Y. 2004. Effects of sodium sulfate and sodium bicarbonate on the growth, gas exchange and mineral composition of lettuce. Sci Hort. 99:215–224. doi:10.1016/S0304-4238(03)00106-7
- Chartzoulakis K, Loupassaki M, Bertaki M, Androulakis I. 2002. Effects of NaCl salinity on growth, ion content and CO2 assimilation rate of six olive cultivars. Sci Hort. 96:235–247. doi:10.1016/S0304-4238(02)00067-5
- Chen S, Xing J, Lan H. 2012. Comparative effects of neutral salt and alkaline salt stress on seed germination, early seedling growth and physiological response of a halophyte species Chenopodium glaucum. Afr J Biotechnol. 11:9572–9581.
- Dhindsa RH, Plumb-Dhindsa R, Thorpe TA. 1981. Leaf senescence correlated with increased level of membrane permeability, lipid peroxidation and decreased level of SOD and CAT. J Exp Bot. 32:93–101. doi:10.1093/jxb/32.1.93
- Dubey RS. 2005. Photosynthesis in plants under stress full conditions. In: Pessarakli M, editor. Photosynthesis. New York: CRC Press; p. 717–718.
- Foster JG, Hess JL. 1980. Responses of superoxide dismutase and glutathione reductase activities in cotton leaf tissue exposed to an atmosphere enriched in oxygen. Plant Physiol. 66:482–487. doi:10.1104/pp.66.3.482
- Grieve CM, Grattan SR. 1983. Rapid assay for determination of water soluble quaternary ammonium compounds. Plant Soil. 70:303–307. doi:10.1007/BF02374789
- Guo R, Shi LX, Ding XM, Hu Y, Tian SY, Yan DF, Shao S, Gao Y, Liu R, Yang YF. 2010. Effects of saline and alkaline stress on germination, seedling growth, and ion balance in wheat. Agron J. 102:1252–1260. doi:10.2134/agronj2010.0022
- Harinasut P, Poonsopa D, Roengmongkoi K, Charoensataporn R. 2003. Salt effects on antioxidant enzymes in mulberry cultivar. Sci Asia. 29:109–113. doi:10.2306/scienceasia1513-1874.2003.29.109
- Hasegawa PM, Ray BA, Zhu JK, Bohnert HJ. 2000. Plant cellular and molecular responses to high salinity. Ann Rev Plant Physiol Plant Mol Biol. 51:463–499. doi:10.1146/annurev.arplant.51.1.463
- Jaleel CA, Azooz MM, Panneerselvam IR. 2009. Treatment with different sodium salts alters growth and photosynthetic pigment constituents in Withania somnifera. Global J Mol Sci. 4:6–9.
- Javid M, Ford R, Nicolas ME. 2012. Tolerance responses of Brassica juncea to salinity, alkalinity and alkaline salinity. Funct Plant Biol. 39:699–707. doi:10.1071/FP12109
- Kar M, Mishra D. 1976. Catalase, peroxidase, polyphenyl oxidase activities during rice leaf senescence. Plant Physiol. 57:315–319. doi:10.1104/pp.57.2.315
- Katare DP, Nab G, Azooz MM, Aeri V, Ahmad P. 2012. Biochemical modifications and enhancement of psoralen content in salt-stressed seedlings of Psoralea corylifolia Linn. J Funct Environ Bot. 2:65–74. doi:10.5958/j.2231-1742.2.1.009
- Kaya C, Sonmez O, Aydemir S, Ashraf M, Dikilitas M. 2013. Exogenous application of mannitol and thiourea regulates plant growth and oxidative stress responses in salt-stressed maize (Zea mays L.). J Plant Interact. 8:234–241. doi:10.1080/17429145.2012.725480
- Koyro HW, Ahmad P, Geissler N. 2012. Abiotic stress responses in plants: an overview. In: Ahmad P, Prasad MNV, editors. Environmental adaptations and stress tolerance of plants in the era of climate change. New York (NY): Springer Science + Business Media; p. 1–28.
- Kumar GS, Lakshmi A, Madhusudan KV, Ramanjulu S, Sudhakar C. 1999. Photosynthesis parameters in two cultivars of mulberry differing in salt tolerance. Photosynthetica. 36:611–616. doi:10.1023/A:1007008608217
- Laemmli UK. 1970. Cleavage of structural proteins during the assembly of the head bacterophage T4. Nature. 227:680–685. doi:10.1038/227680a0
- Lal S, Gulyani V, Khurana P. 2008. Over expression of HVA1 gene from barley generates tolerance to salinity and water stress in transgenic mulberry (Morus indica). Transgenic Res. 17:651–663. doi:10.1007/s11248-007-9145-4
- Lin J, Li X, Zhang Z, Yu X, Gao Z, Wang Y, Wang J, Li Z, Mu C. 2012. Salinity-alkalinity tolerance in wheat: seed germination, early seedling growth, ion relations and solute accumulation. Afr J Agric Res. 7:467–474.
- Lu S, Zhang S, Xu X, Korpelainen H, Li C. 2009. Effect of increased alkalinity on Na+ and K+ contents, lipid peroxidation and antioxidative enzymes in two populations of Populus cathayana. Biol Plant. 53:597–600. doi:10.1007/s10535-009-0109-9
- Mandhania S, Madan S, Sawhney V. 2006. Antioxidant defense mechanism under salt stress in wheat seedlings. Biol Plant. 50:227–231. doi:10.1007/s10535-006-0011-7
- Marschner H. 1995. Mineral nutrition of higher plants. 2nd ed. London: Academic Press.
- Meloni DA, Martinez CA. 2009. Glycinebetaine improves salt tolerance in vinal (Prosopis ruscifolia Griesbach) seedlings. Braz J Plant Physiol. 21:233–244.
- Mittler R. 2002. Oxidative stress, antioxidants and stress tolerance. Trends Plant Sci. 7:405–410. doi:10.1016/S1360-1385(02)02312-9
- Moran PJ, Cheng Y, Cassell JL, Thompson GA. 2002. Gene expression profiling of Arabidopsis thaliana in compatible plant-aphid interactions. Arch Insect Biochem Physiol. 51:182–203. doi:10.1002/arch.10064
- Munns R. 2002. Comparative physiology of salt and water stress. Plant Cell Environ. 25:239–250. doi:10.1046/j.0016-8025.2001.00808.x
- Patade VY, Bhargava S, Suprasanna P. 2011. Salt and drought tolerance of sugarcane under iso-osmotic salt and water stress: growth, osmolytes accumulation, and antioxidant defense. J Plant Interact. 6:275–282. doi:10.1080/17429145.2011.557513
- Qadir M, Noble AD, Schubert S, Thomas RJ, Arslan A. 2006. Sodicity-induced land degradation and its sustainable management: problems and prospectives. Land Degrad Develop. 17:661–676. doi:10.1002/ldr.751
- Ramoliya P, Patel H, Pandey AN. 2004. Effect of salinization of soil on growth and macro- and micro-nutrient accumulation in seedlings of Salvadora persica (Salvadoraceae). Forest Ecol Manag. 202:181–193. doi:10.1016/j.foreco.2004.07.020
- Rao MKV, Sresty TVS. 2000. Antioxidative parameters in the seedlings of pigeonpea (Cajanus cajan L. Millspaugh) in response to Zn and Ni stresses. Plant Sci. 157:113–128. doi:10.1016/S0168-9452(00)00273-9
- Rasool S, Ahmad A, Siddiqi TO, Ahmad P. 2013. Changes in growth, lipid peroxidation and some key antioxidant enzymes in chickpea genotypes under salt stress. Acta Physiol Plant. 35:1039–1050. doi:10.1007/s11738-012-1142-4
- Rasool S, Hameed A, Azooz MM, Rehman M, Siddiqi TO, Ahmad P. 2012. Salt stress: causes, types and responses of plants. In: Ahmad P, Azooz MM, Prasad MNV, editors. Ecophysiology and responses of plants under salt stress. New York (NY), Heidelberg, Dordrecht and London: Springer; p. 1–24.
- Roussos PA, Tsantili E, Pontikis CA. 2006. Responses of Jojoba explant to different salinity levels during the proliferation stage in vitro. Indus Crops Prod. 23:65–72. doi:10.1016/j.indcrop.2005.04.006
- Sudhakar C, Lakshmi A, Giridarakumar S. 2001. Changes in the antioxidant enzyme efficacy in two high yielding genotypes of mulberry (Morus alba L.) under NaCl salinity. Plant Sci. 161:613–619. doi:10.1016/S0168-9452(01)00450-2
- Sun YL, Hong SK. 2011. Effect of citric acid as an important component of the response to saline and alkaline stress in the halophyte Leymus chinensis (Trin.). Plant Growth Regul. 64:129–139. doi:10.1007/s10725-010-9547-9
- Thomas JC, Bohnert HJ. 1993. Salt stress perception and plant growth regulators in the halophyte Mesembryanthemum crystallinum. Plant Physiol. 103:1299–1304.
- Vijayan K, Chakraborti SP, Ghosh PD. 2003. In vitro screening of axillary buds for salinity tolerance in mulberry genotypes. Plant Cell Rep. 22:350–357. doi:10.1007/s00299-003-0695-5
- Vijayan K, Nair CV, Chatterjee SN. 2009. Diversification of mulberry (Morus indica var. S36) – a vegetatively propagated tree species. Caspian J Environ Sci. 7:23–30.
- Wang H, Wu Z, Chen Y, Yang C, Shi D. 2011. Effects of salt and alkali stresses on growth and ion balance in rice (Oryza sativa L.). Plant Soil Environ. 57:286–294.
- Yang J, Zheng W, Tian Y, Wu Y, Zhou D. 2011. Effects of various mixed salt-alkaline stresses on growth, photosynthesis, and photosynthetic pigment concentrations of Medicago ruthenica seedlings. Photosynthetica. 49:275–284. doi:10.1007/s11099-011-0037-8
- Zhang P, Fu J, Hu L. 2012. Effects of alkali stress on growth, free amino acids and carbohydrates metabolism in Kentucky bluegrass (Poa pratensis). Ecotoxicology. 21:1911–1918. doi:10.1007/s10646-012-0924-1