
ABSTRACT
Phytohormones are essential regulators that control both plant growth and defense mechanisms, with cytokinins (CKs) playing a crucial role in regulating antioxidants. However, conflicting research results regarding their effect on antioxidants require further investigation. This study addresses the effects of cis-zeatin (cZ), a type of CK, and its inhibitor lovastatin (LT) on the antioxidant system of 29-day-old Zea mays plants. Seedlings were treated by aerial spraying with 5 M cZ, LT, or their combination (cZ-LT) five days after planting. The results showed that cZ significantly increased growth performance, antioxidant activity and photosynthesis efficiency. cZ treatment increased the accumulation of osmolytes (including total phenolics, total flavonoids, proline, and total soluble proteins), resulting in larger leaves, longer shoots, and increased biomass while reducing root length and biomass, respectively. In contrast, LT treatments resulted in reductions in leaf size, shoot length, and biomass, as well as impairment in photosynthesis rates. LT-treated seedlings showed reduced osmolyte accumulation but increased antioxidant enzymatic activity, which contributed to an increase in electrolyte leakage. Examination of phytohormonal crosstalk showed that cZ treatment increased endogenous GA4 and cZ levels while decreasing IAA levels, while LT had opposite effects. These results provide insights into the complex interplay of phytohormones in modulating both plant growth and antioxidant defense mechanisms.
Introduction
Phytohormones are tiny chemical signaling compounds produced in plants to ensure optimal growth and development (Bhatt et al. Citation2020). Optimum plant growth is usually determined by the effective rate of photosynthesis (Ahmed, Yu-Xin, and Qi-Chang Citation2020). Phytohormones significantly regulate photosynthetic processes by interacting among one another under any stress condition (Zaid, Mushtaq, and Wani Citation2021). The major phytohormones involved are auxins, gibberellins (GA), cytokinins (CK), and brassinosteriods for the regulation of photosynthesis (Zhao et al. Citation2021). In addition, these phytohormones also influence the delay in leaf senescence, which is essential for achieving optimal photosynthesis. Reactive oxygen species, or ROS, are induced at specific times during photosynthesis, and the excess of ROS harms the rate of photosynthesis (Khorobrykh et al. Citation2020).
The accumulation of ROS beyond a certain threshold level leads to oxidative stress, which in turn causes cell death (Paes de Melo et al. Citation2022). However, ROS can function as adaptable signaling molecules as long as they remain below the toxicity threshold and maintain a state of equilibrium between ROS production and their removal by antioxidants (Hasanuzzaman et al. Citation2020). The imbalance between antioxidant and oxidant leads to disruption of control over redox signaling to cause molecular damage to the critical factors involved in photosynthesis (Haider, Jaskani, and Fang Citation2021). This misbalancing is known as oxidative stress (Haider, Jaskani, and Fang 2021). The most crucial factor for photosynthesis is the chlorophyll which is the efficient pigment absorbing the light by the so-called light-harvesting complexes (Parmagnani et al. 2023). During oxidative stress, the imbalance fails to control the flow of electrons and protons, leading to disruptive photosynthesis (Leister Citation2023). The effective ROS scavenging by the phytohormonal interplays induces the production of antioxidant enzymes or osmolytes (Samanta, Seth, and Roychoudhury Citation2023).
The interrelation between phytohormone signaling pathways and ROS scavenging systems results in mutual interaction, ultimately leading to a defense response (Kora et al. Citation2023). Through this interacting system, phytohormones protect from ROS damage manifested by oxidizing chlorophyll or essential transporters such as ferredoxin, plastocyanin, and cytochrome b6f (Khorobrykh et al. Citation2020). In stressed plants, exogenous administration of CKs improved stomatal conductance, and Rubisco activity during photosynthesis (Talaat Citation2023). It has been reported that chloroplast development, function and chlorophyll biosynthesis are also strongly influenced by CKs (Altaf et al. Citation2024). Among the more than 100 related genes, the well-known genes code for the light-harvesting chlorophyll-a/b-binding proteins (Chla/bBP) of PSII and the small and large subunits of ribulose-1,5-bisphosphate carboxylase/ oxygenase encode photosynthesis are controlled by CKs(Svolacchia and Sabatini Citation2023).
Auxins and gibberellins, in a similar manner, are crucial in encouraging the antioxidant system to deal with the ROS produced during photosynthesis (Rodrigues de Queiroz et al. Citation2023). Auxins play an essential role in cellular differentiation and development in plants under stress. Beside this, ROS is also a key component of auxin-mediated plant growth and developmental control, including cell elongation (Pasternak, Palme, and Pérez-Pérez Citation2023). Exogenous IAA administration increased expression of auxin-responsive genes (GH3.1, GH3.9, IAA8) to enhance RWC (Relative Water Content) and Chl synthesis under stress responses (Wang et al. Citation2023). However, there is currently little known about the stimulation of antioxidants by auxins. Depending on the stress level, GA signaling promotes or inhibits plant development (Yousaf et al. 2023). The exogenous application of GA improved water and chlorophyll content while regulating the antioxidant defense mechanism (Yousaf et al. Citation2023). Hence, these hormones tremendously impact the plant's ROS homeostasis during photosynthesis (Zahid et al. 2023).
However, the interactions among these hormones on synthesizing antioxidant compounds to promote photosynthesis are inadequately understood. This research aims to analyze the interaction of auxins, GA, and CK to induce the production of an antioxidant system for effective photosynthesis. In this context, we applied cis-zeatin (cZ) exogenously or inhibited it by applying LT to analyze its interactions with auxins and GA for effective photosynthesis through the induction of an antioxidant system in plants. This study would also support establishing future research integration to manage the various deteriorating environmental impacts through the antioxidant system of plants.
Materials and methods
Plant material and treatment conditions
The seeds of corn (Zea mays L. everta Sturt) provided by the Department of Agriculture, Khyber Pakhtunkhwa, Pakistan, were first sterilized as previously described (Yousaf et al. Citation2022b). After sterilization, the intact seeds were placed on wet filter paper in a Petri dish at 25°C for three days. The germinated seedlings were transferred to pots with sterilized soil and acclimated for five days. After five days in soil, seedlings were aerially sprayed with 5 µM of cis-zeatin as cZ or 5 µM lovastatin as LT or their combination as cZ-LT. Lovastatin (CAS No. 75330-75-5) dissolved in dimethyl sulfoxide and diluted in dH2O. This treatment was followed every five days. Collection of plant material and sampling performed comply with the relevant institutional, national and international guidelines and legislation. All chemical reagents employed in this study were exclusively procured from Sigma-Aldrich.
Growth parameters
On day 29, growth parameters such as relative growth rate (RGR), net assimilation rate (NAR), leaf area ratio (LAR) and root shoot ratio (RSR) were determined. RGR and NAR were recorded as previously described (Yousaf et al. Citation2021). The leaf area ratio was determined by measuring the leaf size in cm and dividing it by the plant's total weight in g. The root-to-shoot ratio was obtained by dividing the root weight in g by the shoot weight in g.
Sample extraction preparation and phytohormonal analysis using UPLC/MS/MS
The extraction and preparation of extraction and sample preparation for phytohormonal analytes were performed as described (Balcke et al. Citation2012). Briefly, the leaf sample was pulverized to a fine powder in liquid nitrogen, and 5 mg of the powder was aliquoted into 2 mL microcentrifuge tubes. The samples were kept at 80°C until further extraction. The extract was obtained in 1 mL MTBE/MeOH solvent pre-cooled to 20°C. After vortexing the samples, they were shaken on an orbital shaker at 4°C for 40 min before being sonicated in an ice-cold sonication bath for 15 min. The samples were again vortexed for 40 s with 0.5 mL of acidified water (0.2% HCl). The samples were kept on an orbital shaker at 4°C for 40 min. After that, the samples were centrifuged at 4°C and 10,000 g for 10 min. At 25 °C room temperature, a fixed volume (0.8 mL) of the upper supernatant (MTBE phase) was transferred to a new 1.5 mL microcentrifuge tube and dried (concentrate to dryness by 1 h at 30 °C). The dried pellets were resuspended in 100 µL of a 50:50 mixture of water and methanol. The resuspended samples were quickly analyzed for hormone content (IAA as indole-3-acetic acid, cZ as cis-zeatin, GA4 as gibberellic acid 4) using UPLC-ESI-MS/MS (ultra-performance liquid chromatography-electrospray tandem mass spectroscopy). HPLC system (2695 Waters HPLC, Waters, Mississauga, Canada) coupled to a tandem mass spectrometer (Quattro Ultima, Micromass, Manchester, UK), MassLynx™ and QuanLynx™ (Micromass, Manchester, UK) were used for the analysis. A Waters ACQUITY UPLC BEH C18 column (2.1 mm × 50 mm, 1.7 μm) was utilized for chromatographic separation. The mobile phase comprised of a solvent A (0.1% formic acid in water) and solvent B (acetonitrile with 0.1% formic acid). The gradient used was Initial conditions: 5% B, 1.5 min: 5% B, 3 min: 95% B, 4 min: 95% B, 4.1 min: 5% B (re-equilibration), 6 min: 5% B (re-equilibration). The mass spectrometer was run in positive ionization mode with parameters optimized at 3.5 kV Capillary voltage, 30 V Cone voltage, 150°C Source Temperature, 350°C Desolvation temperature, 50 L/h Cone gas flow, 800 L/h Desolvation gas flow, and Collision energy optimized individually for each analyte. Calibration curves were constructed using standard solutions of known concentrations (1 to 100 ng/mL). The LOD and LOQ were determined based on signal-to-noise ratios, with LOD defined as a signal-to-noise ratio of 3:1 and LOQ as a signal-to-noise ratio of 10:1. Other parameters with details of each hormone standard are given in Supplementary Table S1. Hormone peak regions were plotted against their concentrations to generate standard curves. Validation testing was performed following the recommendations for validation of analytical methods published by the US Food and Drug Administration.
Quantification of bioactive compounds
The bioactive metabolites included total flavonoids content (TF), total phenolic content (TP), total proline and total soluble proteins. To determine TF and TP, leaf sample (10 g) was dried in the oven at 55°C for 48 h, ground in 75 mL (95% v/v) ethanol, and heated at 40°C for 10 min. Extracts were obtained, and the solvent was evaporated under reduced pressure at 40°C in a rotary evaporator.
Total flavonoid content
The total flavonoid content (TF) in plants was measured with aluminum chloride method. The reaction mixture was prepared by mixing 500 µL of the plant extract with 4.8 mL of methanol (80%), 100 µL of potassium acetate (10%), and 100 µL of aluminum chloride (10%), and the mixture was then shaken vigorously for 30 min in the incubator. After incubation, the optical density was monitored at 415 nm on a UV-Vis-NIR spectrophotometer (UV-3600i Plus, Shimadzu, Japan).
Total phenolic content determination
The Folin–Ciocalteu technique was used to measure total phenolic contents (TP) in the samples. Briefly, for a 200 µL sample, 2 mL of sodium carbonate (2.7% in water) and 800 µL of Folin–Ciocalteu reagent were mixed and incubated for 2 h in dark. The optical density was measured at 765 nm on a spectrophotometer.
Total proline content determination
The proline content was determined as previously described (Yousaf et al. Citation2021).
Total soluble protein determination
To determine Total Soluble Proteins (TSP), leaf (1 g) was ground in 4 mL of sodium phosphate buffer (50 mM, pH 7.8) to extract TSP and then centrifuged at 10,000*g for 20 min. The supernatant sample (20 μL) was mixed with 2.5 mL Bradford's reagent and incubated for 15 min. The absorbance was measured at 595 nm on Double Beam UV-Visible Spectrophotometer.
Enzymatic antioxidants determination
Leaf sample (1 g) was finely pulverized in potassium phosphate buffer (50 mM) containing 1% polyvinylpyrrolidone (pH 7.8) in a cold pestle and mortar. The homogenate obtained was then centrifuged at 15,000*g for 20 min at 4 °C. The supernatant was used for enzymatic analysis. Activities of Superoxide dismutase (SOD), Peroxidase activity (POD), Catalase Activity (CAT), Ascorbate Peroxidase (APX) were monitored using already described previously (Qadir et al. Citation2023).
Rate of photosynthesis
Measurement of photosynthesis was carried out in the mature leaves between 9:00 and 12:00. Photosynthetic parameters included stomatal conductance, photosynthetic rate, transpiration rate, intercellular CO2 concentrations, and water use efficiency using a portable photosynthetic system LI-6400XT (LI-6400; Li-Cor, Inc., Lincoln, NE, USA). The chlorophyll content was estimated using a chlorophyll meter (Minolta, Chlorophyll meter, SPAD-502, Japan). The quantum yield of PSII in the central part of the 3rd mature leaf was estimated using a portable FluorPen FP-100 (Photon System International, Czech Republic). Low light measurement was used to observe Fo, and then Fm was measured at a 3000 mmol m−² s−¹ saturation pulse. Using the formula (Fm-Fo/Fm), the PSII quantum yield was obtained.
Water relation of the seedlings
Leaf water potential was measured using a Schlender-type pressure chamber in a fully inflated leaf in the early morning hours to eliminate variations in plant conditions caused by water loss through transpiration. A glass rod was used to thaw the same leaf after being frozen at −20°C for a week. Cell sap collected from the leaf was then used to measure its osmotic potential (ΨP) using an osmometer (Vapro, 5520, USA). ΨP was calculated using the following formula: ΨP = water potential (Ψ) – osmotic potential (Ψs). Relative water content and electrolytic leakage were measured as previously described (Yousaf et al. Citation2021).
Quantification of MDA and H2O2
The fresh leaf (1.0 g) was powdered in liquid nitrogen and homogenized in 10 mL of ice-cold trichloroacetic acid (TCA) (3%). The TCA extract was centrifuged at 12,000 rpm for 15 min at 4°C. The reaction mixture containing 0.5 ml of potassium phosphate buffer (pH 7.0) and 1 ml of potassium iodide (1 M) was added to 0.5 ml of the extract. After 10 min incubation in the dark, absorbance at 390 nm was recorded to determine H2O2 (Lucas García et al. Citation2023). MDA was determined by adding the extract to 20% trichloroacetic acid and 0.5% thiobarbituric acid and then heating it to 95°C for 30 min in a water bath. The mixture was immediately cooled in an ice bath and centrifuged at 12,000*g for 10 min at 4 °C. The absorbance was recorded at 523, 450, and 600 nm (Lucas García et al. Citation2023).
Quantification of ROS (reactive oxygen species)
ROS was determined as previously described (Yousaf et al. 2022b).
Determination of redox potential
The redox potential consisting of DDPH and ABTS inhibition activities was determined using the procedure as already described (Yousaf et al. 2021).
In-silico analysis
The in-silico analysis was performed by selecting the genes that regulate photosynthesis and produce secondary metabolites such as flavonoids, phenols, and prolines (Supplementary Table S2). The function of these genes was confirmed by the TAIR and PlantGSEAv2 databases. After that, expression data of genes under IAA, cZ, and GA were extracted from the online database BAR (https://bar.utoronto.ca/) and expressed in heat maps and regression plots using R programming. The expression of genes in heatmaps was analyzed using the red-to-blue scale, with red color indicating high expression and blue color indicated lower expression. However, the regression plots showed the correlation expression of genes between cZ vs. GA and cZ vs. IAA treatment in terms of R and p values.
RNA extraction and subsequent qRT-PCR analysis
The procedure was adopted as described earlier (Yousaf et al. 2022b). Using the Spectrum Plant Total RNA Kit from Sigma Aldrich, RNA was extracted. During the RNA extraction process, any genomic DNA in the sample was eliminated using DNase I. To create a cDNA library, primers (Table S3) of oligo (dTs) were combined with Super-Script III Frist Strand Synthesis SuperMix (Invitrogen). In a CFX96 real-time PCR (Bio-Rad detection system), the qRT-PCR with invitrogen 1 SYBR Green I was carried out. Housekeeping gene expression (Zm00001eb285220) was utilized as a comparison to normalize the expression level of the target genes (Zm00001d037674 for IAA biosynthesis, Zm00001d007894 for GA biosynthesis). The functions of these genes were verified from online maize data (https://www.maizegdb.org/) before qRT-PCR analysis. Primer3Plus (https://www.bioinformatics.nl/cgi-bin/primer3plus/primer3plus.cgi) was used to build the primers for the genes in Table S3 at the required temperature and primer length. The orthologues were confirmed from TAIR database (https://www.arabidopsis.org/) and the functions were confirmed from maize database (https://www.maizegdb.org/). The sequence alignments were performed using R programming with msa package to discover the maximum percent identity.
Statistical analyses
Statistical analyzes were performed to determine the significance of the results as described (Yousaf et al. Citation2022a). To assess the similarity clustering of sample data, a PCA (Principal Component Analysis) plot was also created using R programming (). Based on the statistics and experimentations, a graphical abstract is also depicted ().
Figure 1. PCA (principal component analysis) plot was created to assess similarity clustering of sample data using R programming.
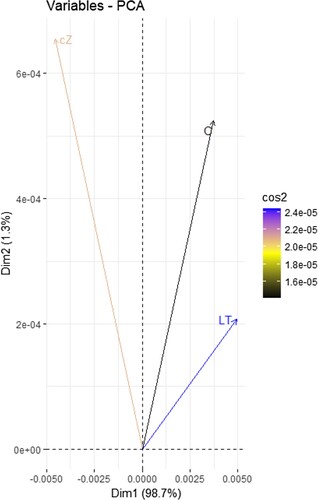
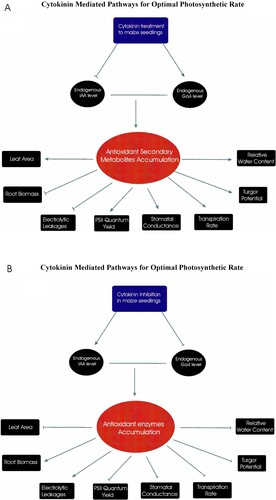
Figure 2. Graphical abstract as A showing the physiological mechanism adopted by maize seedlings when cZ was applied exogenously. The exogenous treatment reduced the endogenous IAA level while enhancing the endogenous GA4 level which in turn accumulated secondary metabolites to improve the photosynthetic rate while compromising root growth and as B showing the physiological mechanism adopted by maize seedlings when cytokinin was inhibited. The inhibition treatment enhanced the endogenous IAA level while reducing the endogenous GA4 level which in turn accumulated secondary metabolites to improve the root growth while compromising photosynthetic rate.
Results
Phytohormonal analyses
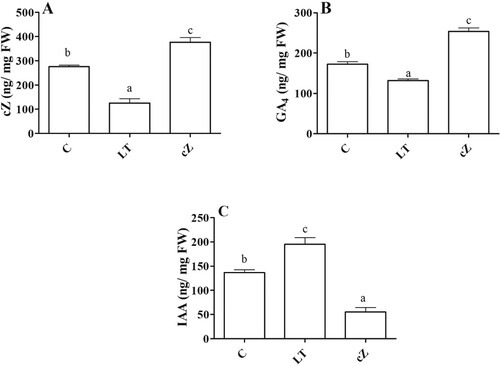
In Z. mays leaves receiving LT treatment (5 µM), the level of cZ was reduced to 38% ± 1.38 of control ((A)). Similarly, exogenous treatment of cZ also contribute to increase the endogenous cZ level of the seedlings, as its concentration in the leaves of the cZ-sprayed plants remained high (p < 0.05) ((A)). To further elucidate the cZ effects on other phytohormones that induce growth, we also quantified IAA and GA4 in the maize plants. Interestingly, cZ treatment increased GA4 levels (31% ± 0.9) while reducing IAA levels (47% ± 2.6) compared to control ((B,C)). In contrast, under the conditions in which cZ was inhibited (LT treatment), the IAA level was increased (27% ± 1.0), while the GA4 level was decreased (39% ± 2.7) compared to the control ((B,C)).
Figure 3. Determination of endogenous cZ (cis-zeatin), GA4 (Gibberellic acid), IAA (Indole-3-acetic acid) in the plants of Z. mays after been exposed to cZ (5 µM) or and its inhibitor – lovastatin – LT (5 µM). Data are mean from 3 independent experiments with standard error bars. Bars labeled with different letters are significantly different (Duncan test; p < 0.05). Experiment was performed at least times in triplicates for validation.
Expression of IAA and GA biosynthesis genes
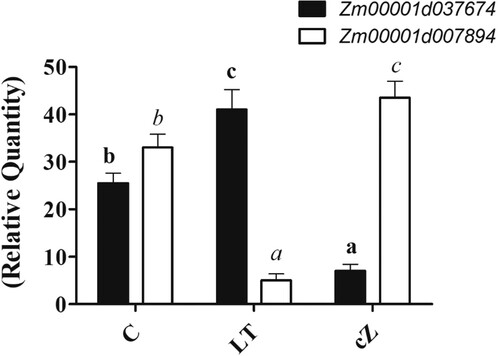
Expression of IAA biosynthetic gene in maize (Zm00001d037674) was low in cZ-treated seedlings, while it appeared high with LT treatment (). In contrast, GA biosynthetic gene such as Zm00001d007894 were upregulated in cZ treatment while downregulated in LT treatment ().
Figure 4. Determination of gene expression analysis of IAA biosynthetic gene (Zm00001d037674) and GA biosynthetic gene (Zm00001d007894) in Zea mays after been exposed to cZ (5 µM) or and its inhibitor – lovastatin – LT (5 µM). Data are mean from 3 independent experiments with standard error bars. Bars labeled with different letters are significantly different (Duncan test; p < 0.05). Experiment was performed at least times in triplicates for validation.
Growth performance
After evaluating the hormonal interactions in the Z. mays seedlings, we studied the morphological aspects in terms of growth kinetics. The effect of cZ treatment was pronounced on growth kinetics expressed in RGR, NAR, LAR and RSR. As shown in (A), cZ treatment significantly improved growth as the RGR was 48% ± 3.1 higher than the control. In contrast, the LT-treated plants had lower growth and their RGR was reduced to 41% ± 2.7 of the control. Similarly, NAR was also affected by treatment, being higher (41%) in cZ seedlings and lower (55%) in LT treatment compared to control ((B)).
Figure 5. Determination of relative growth rate (A), Net assimilation rate (B), Leaf area ratio (C) and Root shoot ratio (D) in the plants of Z. mays after been exposed to cZ (5 µM) or and its inhibitor – lovastatin – LT (5 µM). Data are mean from 3 independent experiments with standard error bars. Bars labeled with different letters are significantly different (Duncan test; p < 0.05). Experiment was performed at least times in triplicates for validation.
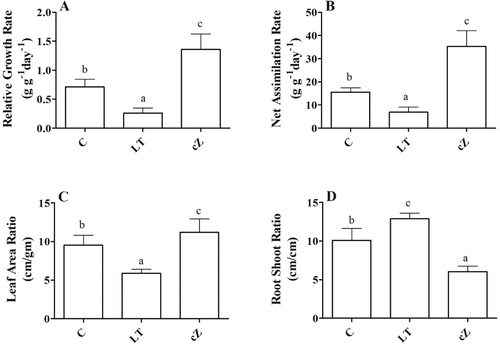
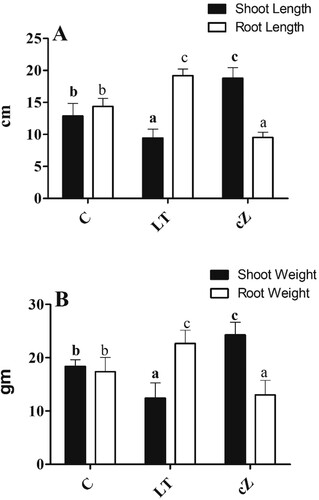
LAR, which indicates the relative size of the leaf compared to the total weight of the plants, was also high in the cZ treatment compared to the LT and C plants (39% and 28%, respectively) ((C)). Interestingly, the cZ phenotypes had a reduced RSR (31%), indicating shoot size relative to root size ((D)). Inhibition of cZ by LT treatment significantly improved RSR by 51% compared to the control ((D)). Furthermore, root length and weight remained lower than shoot length and weight in the cZ phenotype, while root length and weight were high in LT plants ((A,B)).
Figure 6. Determination of root and shoot length (A) and Root and shoot weight (B) in the plants of Z. mays after been exposed to cZ (5 µM) or and its inhibitor – lovastatin – LT (5 µM). Data are mean from 3 independent experiments with standard error bars. Bars labeled with different letters are significantly different (Duncan test; p < 0.05). Experiment was performed at least times in triplicates for validation.
ROS scavenging system
Determination of antioxidant activity and accumulation of osmolytes (secondary metabolites) assessed the ROS scavenging system. The enzymatic activity was expressed as POD, SOD, CAT, and APX. In LT-treated seedlings, the activities of these enzymes remained relatively higher than in control ((A–D)). Low cZ phenotypes (treated with LT) had 47%, 36%, 44%, and 50% higher POD, SOD, CAT, and APX activities than the control ((A–D)). The osmolytes (TPC, TFC, Proline, and TSP) showed an opposite trend to the antioxidant enzymes. The accumulation of TPC, TFC, prolines, and TSP was 49%, 52%, 56%, and 40% higher in cZ-treated seedlings than in control ((A–D)). In seedlings with low cZ (LT-treated), the accumulation of these substances remained lower than in control. The seedlings’ water relationship status was also evaluated; the results are shown in (A–D).
Figure 7. Determination of peroxidase (POD) (A), Super oxidase (SOD) (B), Catalase (CAT) (C) and Ascorbate peroxidase (APX) (D) in the plants of Z. mays after been exposed to cZ (5 µM) or and its inhibitor – lovastatin – LT (5 µM). Data are mean from 3 independent experiments with standard error bars. Bars labeled with different letters are significantly different (Duncan test; p < 0.05). Experiment was performed at least times in triplicates for validation.
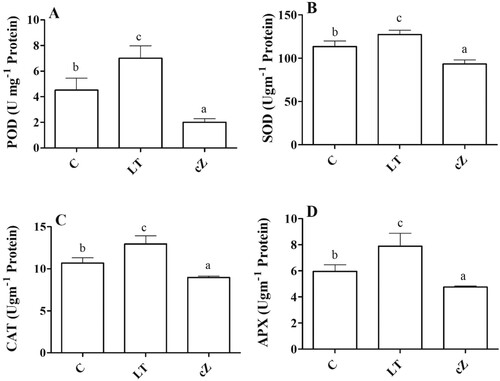
Figure 8. Determination of TPC (total phenolic content) (A), TFC (total flavonoid content) (B), Proline (C) and TPS (total soluble protein) (D) in the plants of Z. mays after been exposed to cZ (5 µM) or and its inhibitor – lovastatin – LT (5 µM). Data are mean from 3 independent experiments with standard error bars. Bars labeled with different letters are significantly different (Duncan test; p < 0.05). Experiment was performed at least times in triplicates for validation.
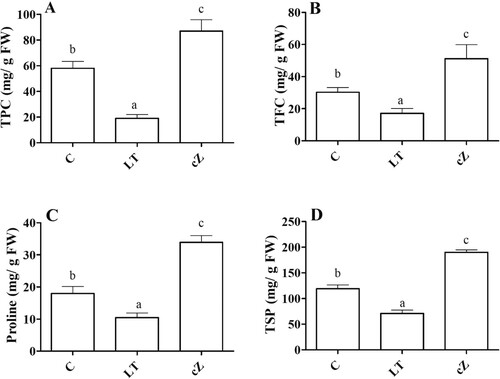
Figure 9. Determination of water potential (A), Osmotic potential (B), Turgor Potential (C), and Relative water content (D) in the plants of Z. mays after been exposed to cZ (5 µM) or and its inhibitor – lovastatin – LT (5 µM). Data are mean from 3 independent experiments with standard error bars. Bars labeled with different letters are significantly different (Duncan test; p < 0.05). Experiment was performed at least times in triplicates for validation.
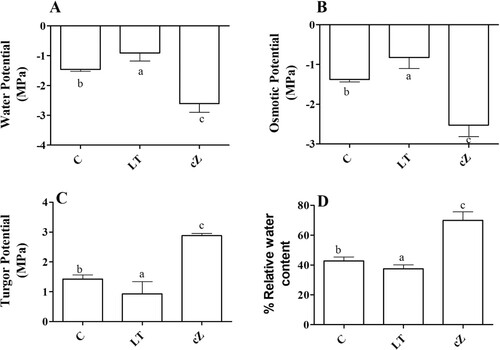
Water status analysis
The maize plants treated with cZ had the three treatments’ highest (more negative) water and osmotic potential. The seedlings treated with LT had the lowest (less negative) water and osmotic potential among the selected treatments ((A,B)). In contrast, turgor potential remained high in cZ phenotypes (48%) while it was low in LT seedlings compared to control (31%) ((C)). The relative water content remained higher in cZ seedlings and lower in LT seedlings ((D)) than in the control.
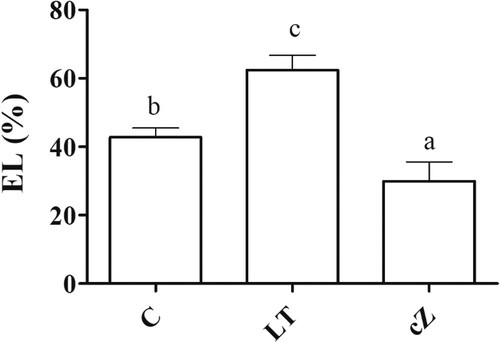
Electrolytic leakage
The LT-treatment had greater (45%) electrolytic leakage than the control (). Electrolyte leakage decreased significantly to 33% of control in cZ treatment.
Figure 10. Determination of electrolytic leakage (EL) in the plants of Z. mays after been exposed to cZ (5 µM) or and its inhibitor – lovastatin – LT (5 µM). Data are mean from 3 independent experiments with standard error bars. Bars labeled with different letters are significantly different (Duncan test; p < 0.05). Experiment was performed at least times in triplicates for validation.
Determination of ROS and ROS scavenging system
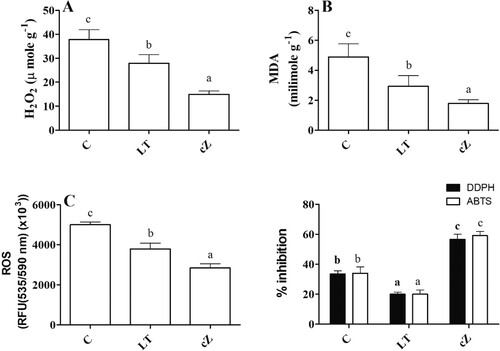
The ROS level was also evaluated under the treatment conditions. The cZ phenotype showed a 39% reduced ROS level compared to the control ((A)). In contrast, the LT seedlings produced only an 18% reduction in ROS content. Similarly, damaged markers (MDA and H2O2) were significantly reduced (38%) in cZ phenotypes, while LT phenotypes caused only a 23% reduction compared to the control ((B,C)). Concurrently, DDPH and ABTS inhibitory activities were also high in the cZ phenotype compared to LT phenotypes, which remained low ((D)).
Figure 11. Determination of damage marker such as H2O2(A), MDA (Malondialdehyde, lipid peroxidation marker) (B) and ROS (reactive oxygen species) (C) and DDPH and ABTS inhibitory activities (D) in the plants of Z. mays after been exposed to cZ (5 µM) or and its inhibitor – lovastatin – LT (5 µM). Data are mean from 3 independent experiments with standard error bars. Bars labeled with different letters are significantly different (Duncan’s test; p < 0.05). Experiment was performed at least times in triplicates for validation.
Photosynthetic rate kinetics
We quantified the transpiration rate, stomata conductivity, and photosynthetic rate to determine photosynthetic efficiency. The cZ seedlings promoted the photosynthetic efficiency of the seedlings as the transpiration rate, stomata conductance, photosynthesis rate, intercellular CO2 concentration and water use efficiency were higher, increasing to 34%, 59%, 32%, 30% and 47%, respectively of the control, while in the seedlings where cZ was inhibited (LT seedlings) the rate of photosynthesis reduced was reduced to 27%, 24%, 21%, 37% and 53% respectively, of the control ((A–E)).
Figure 12. Determination of net photosynthetic rate (A), Stomatal conductance (B), Transpiration rate (C), Intercellular CO2 concentration (D), Water use efficiency (E), Chlorophyll content (F) and PSII quantum yield (G) and Epicuticular wax (H) in the plants of Z. mays after been exposed to cZ (5 5 µM) or and its inhibitor – lovastatin – LT (5 5 µM). Data are mean from 3 independent experiments with standard error bars. Bars labeled with different letters are significantly different (Duncan test; p < 0.05). Experiment was performed at least times in triplicates for validation.
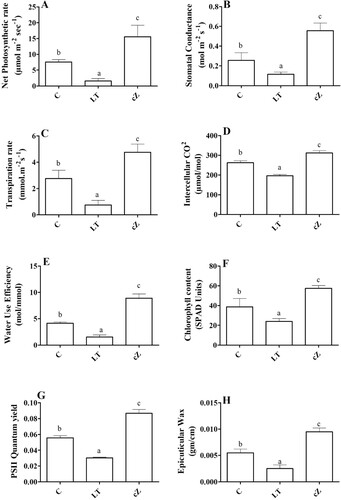
In addition, the chlorophyll content in LT seedlings was also lower, while the content in cZ seedlings remained high (49% 3.11) compared to the control. It was also reported that the PSII quantum yield was significantly reduced in LT seedlings (0.02 ± 0.001), while the same was high in control CK seedlings (0.07 ± 0.001) ((F,G)).
Regarding the accumulation of epicuticular wax on the leaf, CK treatment enhanced wax accumulation while LT reduced its accumulation ((H)).
In-silico analyses
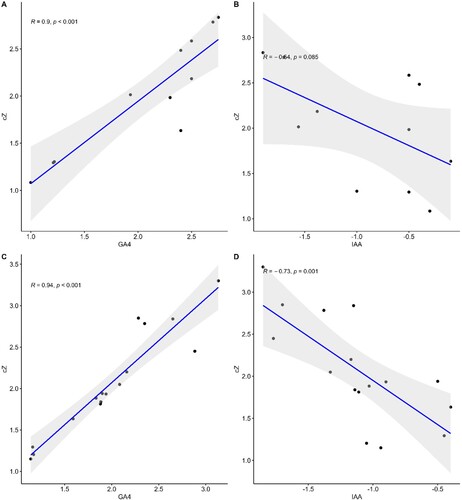
The potential genes involved in the regulation of photosynthesis, such as FBA, PGK, GAPCP-1, RAF2, CAB, PsbA, CRM3, PsbB, PETE1, LAR, SnRK1, and VIPP1 (described in Supplementary Table S2) showed higher expression in GA4 and cZ treatments. However, their expression was downregulated with IAA treatment ((A)). The regression plot for GA4 and cZ for such expression was 0.9, while the regression plot for IAA and cZ was only 0.37 ((A–C)). Likewise, the genes involved in the production of secondary metabolites such as flavonoids, phenols, and prolines (C4H, 4CL, CAD, CCR1, F3H, UGT72E, HCT, F5H, REF1, CH1, FLS, DFR, C4H, and 4CL3) had a higher-level Expression in GA and cZ exposed Arabidopsis. These gene expressions were downregulated in IAA-treatment ((B)). The regression plot for GA4 and cZ for such expression was 0.98 with a P value, while the regression plot for IAA and cZ was only 0.13 ((B–D)).
Figure 13. Genes expression analyses involved in the regulation of photosynthetic rate (A) such as FBA, PGK, GAPCP-1, RAF2, CAB, PsbA, CRM3, PsbB, LAR, PETE1, SnRK1 and VIPP1 and genes expression analyses involved in the production of secondary metabolites (B) such as C4H, 4CL, CAD, CCR1, F3H, UGT72E, HCT, F5H, REF1, CH1, FLS, DFR, C4H, and 4CL3 in the treatment of GA, cZ and IAA. Data are mean from 3 independent experiments and expressed in heat map where red shows high expression and blue shows low expression of the genes.
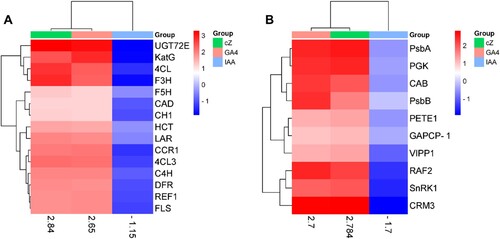
Figure 14. Regression plots representing the expression of genes analyses involved in the regulation of photosynthetic rate such as FBA, PGK, GAPCP-1, RAF2, LAR, CAB, PsbA, CRM3, PsbB, PETE1, SnRK1 and VIPP1 (A) & (C) and in the production of secondary metabolites such as C4H, 4CL, CAD, CCR1, F3H, UGT72E, HCT, F5H, REF1, CH1, FLS, DFR, C4H and 4CL3 (B) & (D) in the treatment of cZ versus GA4 (A & B) and cZ versus IAA (B & C). Data are mean from 3 independent experiments and expressed in R and P values to show the co-relation among genes expression under treatment.
Discussion
Phytohormones such as IAA, GA and CK play an indispensable role in plant growth and alleviating environmental stress (Bhatt et al. Citation2020). This study focuses on the influence of cis-zeatin (cZ), a cytokinin variant, on promoting the growth of Z. mays, an important agricultural crop (Chekole and Ahmed Citation2023). Cytokinins, known for their ability to promote cell division and expansion, are critical for leaf development, chlorophyll production, and photosynthesis (Altaf et al. Citation2023). Insufficient cytokinin levels can result in reduced leaf size and stunted growth (Sosnowski et al. Citation2023). Both cis-zeatin and trans-zeatin are crucial for maintaining photosynthetic efficiency (Cruz et al. Citation2023; Shah et al. Citation2023), while inhibitors such as lovastatin can negatively affect these processes (Kumar et al. Citation2023). Consistent application of cZ every five days to Z. mays plants for 29 days improved growth parameters such as relative growth rate (RGR), net assimilation rate (NAR) and leaf area ratio (LAR), indicating improved overall growth efficiency. In contrast, plants subjected to LT treatment showed a reduction in these growth metrics. Interestingly, cZ treatment resulted in reduced root growth and thus a reduction in root-to-shoot ratio, a phenomenon that is in contrast to the improvement in root-to-shoot ratio by LT treatment. This observation is typically associated with stress responses that stimulate increased root growth for better adaptation (Rosa et al. Citation2023).
The improved growth metrics of the plants are related to the optimized antioxidant activity of the plants under stress conditions, which scavenges the ROS produced (Loudari et al. Citation2023). The ROS scavenging system operates through enzymatic and non-enzymatic pathways (Rudenko et al. Citation2023). In cZ-treated seedlings, non-enzymatic antioxidants like TFC, TPC, proline, and TSP were abundant, aiding in ROS neutralization, while antioxidant enzyme activities such as SOD, POD, CAT, and APX remained low. Conversely, LT seedlings, characterized by low cZ levels, exhibited higher enzymatic activities but fewer secondary metabolites. These findings suggest that cZ induces antioxidant activity by promoting secondary metabolite production in maize plants. Secondary metabolites, acting as co-enzymes, are competitive against environmental stresses and crucial for maintaining physiological activities (Ali et al. Citation2023).
The superior antioxidant activity of cZ was confirmed through assays measuring DDPH and ABTS inhibition activities, indicating its effectiveness in scavenging free radicals. Moreover, cZ-treated plants showed reduced levels of damage markers like MDA and H2O2 compared to LT phenotypes, reflecting lower lipid peroxidation and ROS content, indicative of reduced oxidative stress (Hasanuzzaman et al. Citation2023). Accumulation of secondary metabolites in cZ-treated plants resulted in higher turgor pressure and relative water content compared to LT phenotypes. Genes (HCT, F5H, REF1 and CH1 family genes) responsible for secondary metabolite production showed higher expression under cZ treatment while lowered in LT treatment. Increased production of secondary metabolites is crucial for effective photosynthesis, as demonstrated by the net photosynthetic rate, transpiration rate, stomatal conductance, intercellular CO2 concentration, as well as water use efficiency and chlorophyll content (Luqman et al. Citation2023), which remained high in cZ-treated plants. Additionally, cZ treatment improved cell membrane integrity, as indicated by low electrolyte leakage, further enhancing photosynthetic rates (Wang et al. Citation2023).
Secondary metabolite accumulation, low electrolyte leakage, and optimal ROS scavenging system for effective photosynthesis require the synergistic and antagonistic interactions of multiple phytohormones in plants (Zhang et al. Citation2023; Sun, Jia, et al. Citation2023). Compared to LT treatment, cZ-treated plants exhibited high endogenous GA4 levels while simultaneously showing lower IAA levels. The aim of this study was to investigate the interaction of IAA, GA4 and cZ, which contributes to an efficient photosynthesis rate through a compatible antioxidant capacity. To achieve this goal, the crosstalk of cZ with IAA and GA4 was analyzed. These interactions regulate gene expression required for chlorophyll biosynthesis and subsequent efficient photosynthesis (Luo et al. Citation2023; Sun, Wang, et al. Citation2023). In silico analysis revealed that the expression of genes involved in photosynthesis regulation, such as FBA, PGK, GAPCP-1, RAF2, CAB, PsbA, CRM3, PsbB, PETE1, SnRK1 and VIPP1, was upregulated when the GA4 and cZ values were higher. Interestingly, the expression of these genes was reduced by IAA treatment. The genes listed in Supplementary Table S1 along with their descriptions are known to be involved in the regulation of photosynthesis as validated by the TAIR database (Ribone et al. Citation2023). Thus, it was elucidated that cZ and GA4 similarly affect the expression of all these genes involved in the regulation of photosynthesis, whereas the effect of IAA was antagonistic to cZ. In summary, this study highlights that cZ positively influences photosynthesis, leaf area and shoot growth in maize plants by modulating IAA levels and increasing GA4 levels. This effect is attributed to both exogenous cZ treatment and endogenous upregulation of GA4. Increased photosynthesis is supported by increased amounts of non-enzymatic osmolytes, which effectively scavenge ROS. However, the increased shoot length and leaf area caused by cZ treatment are offset by reduced root length and biomass. Conversely, inhibition of cZ results in upregulation of IAA, reduced GA4 levels and impaired photosynthesis, resulting in reduced shoot length and leaf area but excessive root growth.
Conclusion
In conclusion, the 29-day-old Z. mays plants established a unique crosstalk of cZ, IAA and GA4 to modulate the status of antioxidant compounds, which induced optimal shoot and leaf growth and consequently increased the rate of photosynthesis. The cZ treatment accumulated the secondary metabolites in the leaf instead of increasing antioxidant enzymes such as SOD, POD, CAT and APX. This peculiarity was observed in the maize seedlings due to the down-regulation of IAA and up-regulation of GA4 by exogenous treatment of cZ. In contrast, where endogenous cZ was inhibited by LT treatment, IAA levels shot up while GA4 levels were reduced. Under such conditions, the activity of antioxidant enzymes became high, while the level of osmolytes remained low. This altered crosstalk where IAA was high, photosynthetic activity was impaired, and root biomass was increased relative to the shoot. Findings became a significant incentive to differentially regulate root shoot growth and maintenance of the ROS scavenging system to eliminate harmful environmental stress and reduce food insecurity.
Author contributions
The author's contributions are: (1) Muhammad Junaid Yousaf conducted research and wrote a draft manuscript. (2) Anwar Hussain & Muhammad Hamayun supervised the work. (3) Mohamed A. El-Sheikh and Hosam O. Elansary provided financial support. (4) Ho- Youn Kim provided assistance in statistical analysis.
Supplemental Material
Download MS Word (20 KB)Acknowledgments
The work was supported by Researchers Supporting Project number (RSP2023R182), King Saud University, Riyadh, Saudi Arabia.
Disclosure statement
No potential conflict of interest was reported by the author(s).
Data availability statement
The data that support the findings of this study are available on request from the corresponding author (Anwar Hussain).
Additional information
Funding
Notes on contributors
Muhammad Junaid Yousaf
Mr. Muhammad Junaid Yousaf
Education and Employment: He is a PhD Scholar in Abdul Wali Khan University in the Department of Botany.
Achievements: Has more than 20 ISI publications in prestigious Q1 and Q2 journals in the fields of Microbial phytohormones (bacterial and cyanobacterial), Plant-microbe interaction, Phytopathology and Molecular biology.
Anwar Hussain
Prof. Dr. Anwar Hussain
Education and Employment: Current Professor at the Department of Botany, Abdul Wali Khan University. Previous Lecturer in Govt. Degree College, Turo Mardan, NWFP from November 2007 to September 2011, also served as Part time lecturer in the Department of Microbiology and Molecular Genetics University of the Punjab, Lahore (October 2006–September 2008), and Higher Education Scholarship under 5000 Indigenous Scholarship programme, Batch-II (2005). He also served as research associate at Higher Education Scholarship (IRSIP) for six months international studies in Germany, Department of Pharmaceutical biology Julius-Maxmilians University Wurzburg (2008–2009).
Achievements: Has more than 100 ISI publications in prestigious Q1 and Q2 journals in the fields of Microbial phytohormones (bacterial and cyanobacterial), Plant-microbe interaction, Phytopathology, Molecular biology, and Genetics. He was selected as an editorial board of several international journals.
Muhammad Hamayun
Muhammad Hamayun
Education
Post-Doctorate (27 August 2008–1 June 2010)
School of Applied Biosciences, College of Agriculture and Life Sciences, Kyungpook National University, South Korea
PhD (Agriculture) August 2008
Institution: School of Applied Biosciences, Kyungpook National University, South Korea Thesis: Physio-hormonal changes in soybean as influenced by salinity, drought and gibberellin producing fungi
PhD (Plant science) June 2005
Institution: Department of Biological Science, Quaid-i-Azam University, Pakistan
Thesis: Studies on ethnobotany, conservation and plant diversity of Utror and Gabral valleys, district Swat, Pakistan
Professional experience
Chairman Department of Botany: 25 September 2018–till date, Department of Botany, Abdul Wali Khan University Mardan, Pakistan
Chairman Department of Botany: 9 September 2010–27 April 2016, Department of Botany, Abdul Wali Khan University Mardan, Pakistan
Professor (Tenured): 13 October 2015–till date, Department of Botany, Abdul Wali Khan University Mardan, Pakistan
Editorial/Reviewer Experience
Editor-in-Chief, Pakhtunkhwa Journal of Life Science (ISSN: 2304-8182)
Associate editor, Journal of Medicinal Plants Research (ISSN: 1996-0875)
Associate Editor, Biosciences Biotechnology Research Asia (ISSN: 0973-1245)
Editor, Journal of Botany, Hindawi Publishing Corporation (ISSN: 2090-0120)
Editor, Korean Journal of Life Science (ISSN: 1225-9918)
Editor, Academic Journal of Agricultural Sciences (http://www.xournals.com/academic-journal-of-agricultural-sciences/info/editorial-board)
Mohamed A. El-Sheikh
Prof. Dr. Mohamed Abdelraouf El-Sheikh working as a Professor of Plant Ecology in the Department of Botany & Microbiology, King Saud University, Saudi Arabia. He received PhD degree in Botany with special emphasis in Plant Ecology from Tanta University, Egypt. He has done postdoctoral research at Department of Environmental Biology, Sapienza University of Rome, Italy. Dr. El-Sheikh also visited Institute for Water and Wetland Research (IWW), Radboud University Nijmegen, Netherlands and MSARYK University, Brno, Czech Republic to learn the multivariate analysis programs for Ecoinformatics. He has several MSc and PhD students (30).
His current research focuses on Plant diversity, Floristic analysis, Vegetation analysis, Vegetation Data Base, Population ecology, Plant succession, Phytoremediation; Conservation of the vegetation in Kuwait, Gaza, Oman, Egyptian Mediterranean coast, and Nile Delta and Saudi Arabia.
He is actively engaged in several scientific projects and has been successfully completed. He has published over 80 papers in peer-reviewed journals of international repute and with RG index of 30.91. He holds life membership of several academic societies e.g. International Association of Vegetation Science (IAVS), European vegetation Science, European Dry Grassland Group (EDGG), etc. He is in the editorial board of Saudi Journal of Biological Sciences Editorial Board (2010–2017) published by Elsevier.
Hosam O. Elansary
Dr. Hosam O. Elansary
Education and Employment: Current Professor at the Department of Plant Production, College of Food and Agricultural Sciences, King Saud University. Previous visiting faculty at the Biodiversity Institute of Ontario, University of Guelph, Canada. He was a PhD graduate of the faculty of Science, Charles University in Prague (one of the world top 200 Universities).
Scientific collaboration: During his study in Europe, he worked on a project between USA & the Czech Academy of Sciences and has several impacted publications in the field of plant physiology, biochemistry and biodiversity. He launched a national volunteering barcoding project aimed to barcode herbs, shrubs and trees especially ornamentals in Egypt since 2010 and up to now in collaboration with the University of Guelph in Canada.
Achievements: Has more than 100 ISI publications in prestigious Q1 and Q2 journals in the fields of plant physiology and molecular Biology. Current Academic Editor in Molecules – MDPI journal. He was selected as the ambassador of the Society of Experimental Biology located in London; the society is considered as the main biological mass of scientists in Europe. He was selected as an editorial board of several international journals.
Projects: He participated either as a PI, Co-PI and as a consultant in several local and international projects like EIFAD & TreeBOL. Finally, he established EgyptBOL to be a big umbrella for Egyptian barcoders and to witness the birth of Egypt Barcode of Life dream (egyptbol.org).
Keywords: Plant Physiology, Plant Molecular Biology, Genetics, Ecology, medicinal plants, antioxidants, horticultural crops.
References
- Ahmed HA, Yu-Xin T, Qi-Chang Y. 2020. Optimal control of environmental conditions affecting lettuce plant growth in a controlled environment with artificial lighting: A review. South African J Bot. 130:75–89.
- Ali V, Rashid A, Kumar D, Vyas DJ. 2023. Stage-specific metabolomics suggests a trade-off between primary and secondary metabolites for nutritional advantage in Lepidium latifolium L. Food Chem. 419:136035. doi:10.1016/j.foodchem.2023.136035.
- Altaf F, Parveen S, Farooq S, Lone ML, Haq AU, Tahir I. 2024. Enigmas of senescence: a reappraisal on the hormonal crosstalk and the molecular mechanisms. Theor Exp Plant Physiol., 1–31.
- Altaf MA, Shahid R, Kumar R, Altaf MM, Kumar A, Khan LU, Saqib M, Nawaz MA, Saddiq B, Bahadur SJ. 2023. Phytohormones mediated modulation of abiotic stress tolerance and potential crosstalk in horticultural crops. J Plant Growth Regul. 42:4724–4750. doi:10.1007/s00344-022-10812-0.
- Balcke GU, Handrick V, Bergau N, Fichtner M, Henning A, Stellmach H, Tissier A, Hause B, Frolov AJ. 2012. An UPLC-MS/MS method for highly sensitive high-throughput analysis of phytohormones in plant tissues. Plant Methods. 8:1–11. doi:10.1186/1746-4811-8-47.
- Bhatt D, Nath M, Sharma M, Bhatt MD, Bisht DS, Butani NV. 2020. Role of growth regulators and phytohormones in overcoming environmental stress. In: Roychoudhury A, Tripathi DA, editors. Protective chemical agents in the amelioration of plant abiotic stress: biochemical and molecular perspectives. Hoboken, NJ: Wiley; p. 254–279.
- Chekole FC, Ahmed AM. 2023. Future climate implication on maize (Zea mays) productivity with adaptive options at Harbu district, Ethiopia. J Agric Food Res. 11:100480. doi:10.1016/j.jafr.2022.100480.
- Cruz CG, Da Rosa APC, Costa JAV. 2023. Identification of the phytohormones indole-3-acetic acid and trans-zeatin in microalgae. J Chem Technol Biotechnol. 98:1048–1056. doi:10.1002/jctb.7312.
- Haider MS, Jaskani MJ, Fang J. 2021. Biocontrol agents and secondary metabolites. Woodhead Publishing; p. 347–382.
- Hasanuzzaman M, Bhuyan MB, Parvin K, Bhuiyan TF, Anee TI, Nahar K, Hossen MS, Zulfiqar F, Alam MM, Fujita M. 2020. Regulation of ROS metabolism in plants under environmental stress: A review of recent experimental evidence. Int J Mol Sci. 21(22).
- Hasanuzzaman M, Raihan MRH, Siddika A, Rahman K, Nahar K. 2023. Supplementation with Ascophyllum nodosum extracts mitigates arsenic toxicity by modulating reactive oxygen species metabolism and reducing oxidative stress in rice. Ecotoxicol Environ Saf. 255:114819. doi:10.1016/j.ecoenv.2023.114819.
- Khorobrykh S, Havurinne V, Mattila H, Tyystjärvi E. 2020. Oxygen and ROS in photosynthesis. Plants. 9(1).
- Kora D, Dey A, Pal B, Roy UK, Dey N, Bhattacharjee T, Bhattacharjee S. 2023. ROS-hormone interaction in regulating integrative defense signaling of plant cell. Biocell. 47(3):503–521.
- Kumar M, Singh Y, Maurya SK, Maurya SK, Maurya DK, Sachan R, Gautam MK, Tiwari A. 2023. Efficient use of nano-fertilizer for increasing productivity and profitability along with maintain sustainability in rice crop: a review. Int J Environ Clim Change. 13:1358–1368. doi:10.9734/ijecc/2023/v13i102788.
- Leister D. 2023. Enhancing the light reactions of photosynthesis: Strategies, controversies, and perspectives. Mol Plant. 16(1):4–22.
- Loudari A, Latique S, Mayane A, Colinet G, Oukarroum A. 2023. Polyphosphate fertilizer impacts the enzymatic and non-enzymatic antioxidant capacity of wheat plants grown under salinity. Sci Rep. 13:11212. doi:10.1038/s41598-023-38403-3.
- Lucas García JA, García Villaraco A, Montero Palmero MB, Montalbán Ginés B, Ramos Solano B, Gutierrez-Mañero FJ. 2023. Physiological and genetic modifications induced by plant-growth-promoting rhizobacteria (PGPR) in tomato plants under moderate water stress. Biology. 12(7):901. doi:10.3390/biology12070901.
- Luo W-G, Liang Q-W, Su Y, Huang C, Mo B-X, Yu Y, Xiao L-T. 2023. Auxin inhibits chlorophyll accumulation through ARF7-IAA14-mediated repression of chlorophyll biosynthesis genes in Arabidopsis. Front Plant Sci. 14:1172059. doi:10.3389/fpls.2023.1172059.
- Luqman M, Shahbaz M, Maqsood MF, Farhat F, Zulfiqar U, Siddiqui MH, Masood A, Aqeel M, Haider FU. 2023. Effect of strigolactone on growth, photosynthetic efficiency, antioxidant activity, and osmolytes accumulation in different maize (Zea mays L.) hybrids grown under drought stress. Plant Signal Behav. 18:2262795. doi:10.1080/15592324.2023.2262795.
- Paes De Melo B, Carpinetti PDA, Fraga OT, Rodrigues-Silva PL, Fioresi VS, De Camargos LF, Ferreira MFDS. 2022. Abiotic stresses in plants and their markers: a practice view of plant stress responses and programmed cell death mechanisms. Plants. 11(9).
- Pasternak T, Palme K, Pérez-Pérez J M. 2023. Role of reactive oxygen species in the modulation of auxin flux and root development in Arabidopsis thaliana. J Plant Interact. 114(1):83–95.
- Qadir M, Hussain A, Shah M, Hamayun M, Iqbal A. 2023. Enhancement of chromate phytoremediation and soil reclamation potential of Brassica campestris L. by Aspergillus niger. Environ Sci Pollut Res Int. 30:9471–9482.
- Ribone AI, Fass M, Gonzalez S, Lia V, Paniego N, Rivarola M. 2023. Co-expression networks in sunflower: harnessing the power of multi-study transcriptomic public data to identify and categorize candidate genes for fungal resistance. Plants. 12:2767. doi:10.3390/plants12152767.
- Rodrigues De Queiroz A, Hines C, Brown J, Sahay S, Vijayan J, Stone JM, Bickford N, Wuellner M, Glowacka K, Buan NR, Roston RL. 2023. The effects of exogenously applied antioxidants on plant growth and resilience. Phytochem Rev. 22(2):407–447.
- Rosa AP, Barão L, Chambel L, Cruz C, Santana MM. 2023. Early identification of plant drought stress responses: changes in leaf reflectance and plant growth promoting rhizobacteria selection-the case study of tomato plants. Agronomy. 13:183. doi:10.3390/agronomy13010183.
- Rudenko NN, Vetoshkina DV, Marenkova TV, Borisova-Mubarakshina MM. 2023. Antioxidants of non-enzymatic nature: their function in higher plant cells and the ways of boosting their biosynthesis. Antioxidants. 12:2014. doi:10.3390/antiox12112014.
- Samanta S, Seth CS, Roychoudhury A. 2023. The molecular paradigm of ROS and RNS with different phytohormone signaling during drought stress in plants. Plant Physiol Biochem.
- Shah S, Cai L, Li X, Fahad S, Wang D. 2023. Influence of cultivation practices on the metabolism of cytokinin and its correlation in rice production. Food Energy Secur. 12:e488. doi:10.1002/fes3.488.
- Sosnowski J, Truba M, Vasileva V. 2023. The impact of auxin and cytokinin on the growth and development of selected crops. Agriculture. 13:724. doi:10.3390/agriculture13030724.
- Sun H, Jia M, Wang Y, Lu H, Wang X. 2023. The complexity of melatonin and other phytohormones crosstalk with other signaling molecules for drought tolerance in horticultural crops. Sci Hortic. 321:112348. doi:10.1016/j.scienta.2023.112348.
- Sun T, Wang P, Rao S, Zhou X, Wrightstone E, Lu S, Yuan H, Yang Y, Fish T, Thannhauser T. 2023. Co-chaperoning of chlorophyll and carotenoid biosynthesis by orange family proteins in plants. Mol Plant. 16:1048–1065. doi:10.1016/j.molp.2023.05.006.
- Svolacchia N, Sabatini S. 2023. Cytokinins. Current Biology. 33:R10–R13.
- Talaat NB. 2023. Drought stress alleviator melatonin reconfigures water-stressed barley (Hordeum vulgare L.) plants’ photosynthetic efficiency, antioxidant capacity, and endogenous phytohormone profile. Int J Mol Sci. 24(22).
- Wang C, Zhang P, He Y, Huang F, Wang X, Li H, Yuan L, Hou J, Chen G, Wang W, Wu J. 2023. Exogenous spraying of IAA improved the efficiency of microspore embryogenesis in Wucai (Brassica campestris L.) by affecting the balance of endogenous hormones, energy metabolism, and cell wall degradation. J Plant Interact. 24(1).
- Wang F, Wan C, Wu W, Pan Y, Cheng X, Li C, Pi J, Chen X. 2023. Exogenous methyl jasmonate (MeJA) enhances the tolerance to cadmium (Cd) stress of okra (Abelmoschus esculentus L.) plants. Plant Cell Tissue Organ Cult. 155:907–922. doi:10.1007/s11240-023-02596-2.
- Yousaf MJ, Hussain A, Hamayun M, Iqbal A, Irshad M, Kim HY, Lee IJ. 2021. Transformation of endophytic Bipolaris spp. into biotrophic pathogen under auxin cross-talk with brassinosteroids and abscisic acid. Front Bioeng Biotechnol. 9.
- Yousaf MJ, Hussain A, Hamayun M, Iqbal A, Lee IJ. 2022a. Gibberellins hypersensitivity hinder the interaction of Bipolaris sorokiniana (Scc.) under cross talks with IAA and transzeatin. J Plant Interact. 17(1):152–167.
- Yousaf MJ, Hussain A, Humayun M, Iqbal A, Ali F, Lee IJ, El-Sabrout AM, Elansary HO. 2022b. Induced host defense by virulence manipulation of Erysiphe orontii through exogenous application of apoplastic nutrients. J Plant Interact. 119.
- Zahid G, Iftikhar S, Shimira F, Ahmad HM, Kaçar YA. 2023. An overview and recent progress of plant growth regulators (PGRs) in the mitigation of abiotic stresses in fruits: A review. J Plant Interact. 309.
- Zaid A, Mushtaq M, Wani SH. 2021. Frontiers in plant-soil interaction. Academic Press; p. 221–236.
- Zhang L, Zuluaga MYA, Pii Y, Barone A, Amaducci S, Miras-Moreno B, Martinelli E, Bellotti G, Trevisan M, Puglisi E. 2023. A pseudomonas plant growth promoting rhizobacterium and arbuscular mycorrhiza differentially modulate the growth, photosynthetic performance, nutrients allocation, and stress response mechanisms triggered by a mild zinc and cadmium stress in tomato. Plant Sci. 337:111873. doi:10.1016/j.plantsci.2023.111873.
- Zhao B, Liu Q, Wang B, Yuan F. 2021. Roles of phytohormones and their signaling pathways in leaf development and stress responses. J Agric Food Chem. 69(12):3566–3584.