
Abstract
The mode of action of silver nanoparticles (AgNPs) is suggested to be exerted through both Ag+ and AgNP dependent mechanisms. Ingestion is one of the major NP exposure routes, and potential effects are often studied using Caco-2 cells, a well-established model for the gut epithelium. MCF-7 cells are epithelial breast cancer cells with extensive well-characterized toxicogenomics profiles. In the present study, we aimed to gain a deeper understanding of the cellular molecular responses in Caco-2 and MCF-7 cells after AgNP exposure in order to evaluate whether epithelial cells derived from different tissues demonstrated similar responses. These insights could possibly reduce the size of cell panels for NP hazard identification screening purposes. AgNPs of 20, 30, 60, and 110 nm, and AgNO3 were exposed for 6 h and 24 h. AgNPs were shown to be taken up and dissolve intracellularly. Compared with MCF-7 cells, Caco-2 cells showed a higher sensitivity to AgNPs, slower gene expression kinetics and absence of NP size-dependent responses. However, on a molecular level, no significant differences were observed between the two cell types. Transcriptomic analysis showed that Ag(NP) exposure caused (oxidative) stress responses, possibly leading to cell death in both cell lines. There was no indication for effects specifically induced by AgNPs. Responses to AgNPs appeared to be induced by silver ions released from the AgNPs. In conclusion, differences in mRNA responses to AgNPs between Caco-2 and MCF-7 cells were mainly related to timing and magnitude, but not to a different underlying mechanism.
Introduction
The great challenge of safety assessment of nanomaterials is to keep pace with innovations in research and development that is resulting in an ever-increasing diversity of nanomaterials. In conventional risk assessment in vivo studies are still regarded essential. However, in vitro studies are of great value for mechanistic (Adverse Outcome Pathway) studies and further integration of knowledge obtained from in vitro studies into the safety assessment is deemed imperative (Hartung et al., Citation2013; Nel et al., Citation2013). For this, studies with a systematic design and highly characterized NPs can pave the way. However, selection of in vitro models is often arbitrary, as well as the chosen nanoparticles and exposure conditions.
Silver nanoparticles (AgNPs) are interesting for a mechanistic evaluation of in vitro tests because their mechanism of action is suggested to depend on both Ag+ and NPs (Ivask et al., Citation2014; Lemire et al., Citation2013). In suspension, AgNPs have been described to release ions (Kittler et al., Citation2010), which strongly contribute to the biological activity of AgNPs in vitro and in vivo (Bouwmeester et al., Citation2011; Foldbjerg et al., Citation2012; van der Zande et al., Citation2012). However, the kinetics behind the biological activity have not fully been elucidated: i.e. Ag+ uptake, or a “Trojan horse” mechanism in which AgNPs shed Ag+ in lysosomes following cellular uptake (Bouwmeester et al., Citation2011; Gliga et al., Citation2014).
NP ingestion is a major route of exposure. It is estimated that the average person in a developed country is exposed orally to 1012 and 1014 man-made fine (0.1–1 μm) to ultrafine (<100 nm) particles every day (Lomer et al., Citation2002). Oral exposure to AgNPs in rats has shown absorption and biodistribution throughout the body (Loeschner et al., Citation2011; van der Zande et al., Citation2012). The Caco-2 epithelial cell line is one of the most relevant in vitro models to study intestinal functions (Christensen et al., Citation2012; Lefebvre et al., Citation2015). However, literature on Caco-2 responses to AgNPs is limited. Cellular uptake has been described, which was suggested to occur through endocytosis (Gaiser et al., Citation2012). Cytotoxicity data is contradictory, varying from absence of cytotoxicity (Chalew & Schwab, Citation2013; Bouwmeester et al., Citation2011), to time and dose dependent cytotoxicity (Bohmert et al., Citation2012,Citation2015; Martirosyan et al., Citation2014). The human breast cancer MCF-7 epithelial cell line has been used to create a reference collection of gene-expression profiles following treatment with bioactive small molecules. These profiles have been used around the world for research purposes, including nanomedicine related research, to discover functional connections among diseases and drug action (Lamb et al., Citation2006; Shieh et al., Citation2011; Wang et al., Citation2010; Yallapu et al., Citation2012). Therefore, MCF-7 is potentially a very suitable epithelial cell model for the hazard identification of nanomaterials. AgNP toxicity to MCF-7 cells has been reported to be size (Liu et al., Citation2010b) and dose dependent (Jeyaraj et al., Citation2013) after 24 h exposure.
The aim of this study is to examine the functional cellular mechanisms connected to exposure to AgNPs and from that evaluate whether epithelial cells derived from different tissues show different responses. As previous studies suggested size- and time related responses (Bohmert et al., Citation2012; Tuomela et al., Citation2013), we used four sizes of AgNPs at two exposure durations. AgNO3 was used to assess effects of Ag+. Effects of AgNPs on both Caco-2 and MCF-7 cells were assessed by means of detailed toxicokinetic and toxicogenomic studies.
Methods
Nanoparticle suspensions
Suspended uncapped AgNPs (BioPure™; 1 mg/ml in 2 mM citrate buffer) in four sizes (i.e. 20.3 ± 1.9, 34.4 ± 3.4, 61.2 ± 5.3 and 112.6 ± 7.8 nm; transmission electron microscopy (TEM) diameter as provided by the manufacturer; lot numbers: EAW1091, CTH1088, EAW1093 and CTH1409, respectively), referred to as Ag-20, Ag-30, Ag-60 and Ag-110, were purchased from Nanocomposix (San Diego, CA). Stock suspensions were diluted in complete cell culture medium (DMEM+) and sonicated for 10 min at 20 °C in a Branson 5510 water bath sonicator (Emerson, Danbury, CT) at 100% output (4 W specific ultrasound energy (240 J/m3)).
Nanoparticle characterization
For Scanning Electron Microscopy (SEM) analysis, a dried droplet of AgNP suspension (20 μg/ml in water), deposited on a nickel-coated polycarbonate filter and sputter coated with chromium, was analyzed with a high resolution field emission gun SEM (MIRA-LMH FEG-SEM; Tescan, Czech Republic) and a Scandium SIS software package (Olympus Soft Imaging Solutions GmbH, Germany). The mean diameter ± SD of 50–500 particles is given. To determine the presence of a coating, both secondary electron (SE) and backscattered electron (BE) modes were used.
The hydrodynamic diameter (Dh) of the particles suspended in DMEM + was analyzed by Dynamic Light Scattering (DLS). Measurements were performed at t = 0 h and 24 h at 37 °C using an ALV DLS setup (ALV-Laser Vertriebsgesellschaft m-b.H., Langen, Germany) and the graphical interface AfterALV 1.0d software to treat data by Contin (Provencher, Citation1979; Citation1982). Each measurement, consisting of 10 technical replicates, was performed in duplicate at a scattering angle of 90°.
Elemental analysis using inductively coupled plasma mass spectrometry (ICP-MS; Thermo Scientific Xseries 2, equipped with a Babington nebulizer and CETAC auto-sampler, MA) was performed to determine AgNP dissolution. AgNP/DMEM + suspensions of 25 μg/ml were analyzed after 6 h or 24 h incubation at 37 °C (n = 2). Incubation was followed by ultracentrifugation at 302 986×g for 10 min (Beckman coulter optima LE-80K ultracentrifuge, rotor SW55, CA). The supernatant and pellet were separately measured using the selected element monitoring mode of the ICP-MS with m/z values of 107 and 109 for silver. Prior to measurement, samples were diluted 17× and 33× for the supernatant and pellet, respectively. Ionic Ag standards (Merck, NJ) ranging from 0 to 150 μg/l were used, no internal standard was used. The limit of detection and estimated limit of quantification were 0.06 and 0.19 μg/l, respectively.
Cell culture
Human colorectal adenocarcinoma (Caco-2, HTB-37TM) and human breast cancer (MCF-7) cell lines were obtained from the American Type Culture Collection (Manassas, VA). Caco-2 cells (passages 44–49) were cultured in complete cell culture medium (DMEM+) composed of: Dulbecco Modified Eagle’s Minimal Essential medium (DMEM; 4.5 g/l glucose) supplemented with l-glutamine (Lonza, Belgium), non-essential amino acids (NEAA; 1% v/v; BioWhittaker, Lonza), penicillin-streptomycin (PEST; 1% v/v; Sigma, St. Louis, MO), and heat-inactivated fetal bovine serum (FBS; 10% v/v; Gibco, Lawrence, MA). MCF-7 cells (passages 18–22) were cultured in Minimum Essential Medium (MEM; Invitrogen, Waltham, MA), supplemented with sodium pyruvate (Gibco), and NEAA, PEST and FBS as mentioned above. Cells were incubated at 37 °C (95% humidity, 5% CO2). Culture medium was refreshed every other day and cells were passed at 80% confluency.
Cell viability
Cell viability experiments (n = 3) were analyzed using a WST-1 viability assay. Approximately 40 000 cells/cm2 were seeded in 96-well plates 48 h prior to exposure. After 24 h the medium was renewed and at t = 0 h cells were exposed to 5 or 25 μg/ml AgNPs or 1.5 μg/ml AgNO3 (Sigma). Doses of 5 and 25 μg/ml AgNPs were selected based on a previous study where we showed absence of toxicity of 20, 34, 61 and 110 nm phosphate buffered AgNPs up to 50 μg/ml to Caco-2 cells (Bouwmeester et al., Citation2011). SDS (0.01%; Sigma) was included as a positive cytotoxicity control. The plates were incubated for 24 h at 37 °C and the WST-1 assay was performed according to the provided protocol (Roche, Mannheim, Germany). The optical density (OD) was measured before and after performing the WST-1 assay at 450 nm (Synergy HT Multi-Mode microplate reader, BioTek, Winooski, VT) and OD630 was used for background correction. Interference of particles was corrected by subtracting the ODbeforeWST-1 from the ODafterWST-1. Cell viability was calculated using the following equation: ODtreated/ODsolvent control×100%.
Cellular uptake
The amount of cellular associated silver after 6 h and 24 h exposure was determined by ICP-MS analysis. Confocal microscopy (CM) and TEM were used for visual detection of AgNP uptake. Prior to exposure both cell types were seeded at a density of ∼40 000 cells/cm2 in a six-well plate (ICP-MS) or in glass chamber slides (CM, TEM; Ibidi, Germany) and incubated for 48 h, after 24 h the medium was renewed. At t = 0 h cells were exposed for 6 h or 24 h to Ag-20, Ag-60, or Ag-110 (25 μg/ml), or to AgNO3 (1.5 μg/ml) (n = 3). Due to the small differences in size between the Ag-20 and Ag-30 NPs, the Ag-30 NPs were omitted from these analyses.
For ICP-MS analysis, cells were washed 3× by 15 s rinsing with PBS (Sigma) and trypsinized (Gibco). Cells were destroyed by addition of HNO3 (70 vol%; Sigma) and HCl (37 vol%; Sigma) in a 1:3 ratio and incubated for 30 min at 60 °C. Also samples of the exposure solution were taken and treated equally. Samples were diluted 200× and 20× for the exposure solution, and 20× and 2× for the cell fraction of AgNPs and AgNO3, respectively. Silver was measured using the selected element monitoring mode of the ICP-MS with m/z values of 107 and 109. Ionic Ag standards (Merck) ranging from 1 to 50 μg/l were used. Additionally, standards of Ag-20, Ag-60 and Ag-110 prepared in MilliQ water were measured, no internal standard was used. All standards received the same pretreatment as the samples. The limit of detection and estimated limit of quantification were 0.054 and 0.16 μg/l, respectively.
For CM, cells were fixed with 4% paraformaldehyde (Sigma) for 15 min at room temperature (RT), followed by staining of the lysosomes using a primary LAMP-1 antibody (Abcam, UK) and a secondary antibody conjugated with Alexa Fluor-546 (Invitrogen, Waltham, MA). The nuclei were stained with DAPI (Invitrogen, Waltham, MA; Supplementary Material I). The cells were analyzed using a confocal microscope (LSM 510 UVMETA; Carl Zeiss, Germany). Samples were excited with 364 nm and 543 nm lasers and AgNPs were detected by backscattered light using the 543 nm laser. Multi-tracked images were captured to avoid bleed through. The used pinholes were in the range of 0.7–0.8 μm at magnification 63× and the gain and offset for the different channels were kept constant during the entire experiment.
Samples for TEM were fixed in 2.5% glutaraldehyde in 0.1 M Sørensen’s phosphate buffer (SPBS) and post fixed in 1% osmium tetroxide in SPBS. Subsequently, the specimens were dehydrated in a graded ethanol (Sigma) series and embedded in epoxy resin (Supplementary Material I). For orientation purposes, sections (500 nm) were stained with toluidine blue (Sigma) and regions of interest were identified by light microscopy. Ultrathin (80 nm) sections were obtained using an ultramicrotome (EM UC6; Leica Microsystems, Germany), collected on 200 mesh thin bar copper grids, and stained with uranyl acetate (20 min; Sigma) and lead citrate (5 min; Sigma). Samples were examined by TEM (Tecnai G2 12 BioTWIN using an accelerating voltage of 120 kV; FEI, Hillsboro, OR).
Statistical analysis
Results from DLS, ICP-MS and WST-1 analysis were statistically analyzed using Prism (v5; GraphPad Software, Inc., La Jolla, CA) software. A one or two-way ANOVA was used with a Bonferroni post-test, a p value of ≤0.05 was considered significant.
Microarray hybridization and data normalization
The effects of 6 h or 24 h AgNPs exposure on whole genome gene expression profiles of Caco-2 and MCF-7 cells were studied using Illumina human HT-12 v4 bead arrays (Illumina, San Diego, CA). Prior to exposure both cell types were seeded at a density of ∼40 000 cells/cm2 in a six-well plate, and incubated for 48 h. Cells were exposed (n = 3) for 6 h or 24 h to Ag-20, Ag-30, Ag-60 or Ag-110 (25 μg/ml), or to AgNO3 (1.5 μg/ml). Untreated cells at 6 h and 24 h (n = 3) were used as a control. At these concentrations, ∼80–100% of the cells was still viable after 24 h, as measured by the WST-1 assay. After exposure, the cells were washed to remove NPs that were not taken up. For RNA isolation, cells were solved in 600 μl RLT buffer (Qiagen, the Netherlands) containing 1% β-mercapto ethanol (Sigma). The RNAs were purified using a Qiashredder (Qiagen, Valencia, CA) and RNeasy Mini Kit, including DNase treatment (Qiagen), and finally biotin labeled. After RNA labeling, 750 ng of each labeled cRNA sample was hybridized overnight at 58 °C onto Illumina HumanHT-12 v4 Expression BeadChips. Subsequently, the BeadChips were washed and incubated with Streptavidin-Cy3 and the chips were scanned using the Illumina iScan array scanner (Illumina). Primary gene expression analysis of the scanned BeadChips was performed using Illumina’s Genomestudio v2011.1 software. BeadChip arrays have internal quality control features, which consist of spiked-in sample independent controls as well as sample dependent controls. The expression data were deposited in the Gene Expression Omnibus (GEO) database (accession number GSE84982). Normalization and analysis of the datasets were performed using MadMax, an in-house, on-line system (Lin et al., Citation2011). A Variance Stabilization and Normalization (VSN) method was used to obtain expression values. After background subtraction, the spot intensities were floored to 40, followed by 2 log mean centering and calculation of 2 log ratios of treatments versus the average of the control samples. Significantly differentially expressed genes (DEGs) between the control versus the treatment groups were identified with a limma package using an empirical Bayes moderated t-test and the p values were adjusted with false discovery rate (FDR) method (Smyth, Citation2004). For limma analysis, treatment triplicates were paired with control triplicates. Genes were considered differentially expressed with a minimal fold change (FC) of 1.5×, a p value ≤ 0.05, and a FDR ≤ 0.25.
Venn mapping, hierarchical clustering and pathway analysis
DEGs (1.5FC; limma analysis) were clustered in Venn diagrams using Vennture software (Martin et al., Citation2012). For hierarchical clustering, all probes were clustered using the programs Cluster 3.0 (uncentered correlation; average linkage clustering; 2FC threshold; Stanford University) and Treeview 1.6 (Eisen Lab, CA). The number of differentially expressed probes is often higher than the number of DEGs, as one gene is often represented by several probes. Genes within the Venn clusters and hierarchical cluster heatmaps were extracted and further analyzed again using the ConsensusPathDB database (Kamburov et al., Citation2011) and the Database for Annotation, Visualization and Integrated Discovery (DAVID) (Dennis et al., Citation2003) to assess significance for overrepresentation of DEGs in biological processes. Pathways with a p value ≤ 0.01 and a FDR ≤ 0.25 were considered as significantly regulated.
Results
Nanoparticle characterization
SEM analysis demonstrated a spherical shape of all particles (Supplementary Material I; Figure S1) and average sizes are given in . The Dh of the AgNPs in DMEM + was measured using DLS to assess possible agglomeration during exposure. The Dh of Ag-20 and Ag-30 did not change significantly during 24 h incubation, but the Dh of Ag-60 and Ag-110 increased significantly (), although no sedimentation was observed in any of the suspensions by visual inspection.
Table 1. Characterization of AgNPs in suspension.
Dissolution of the AgNPs was evaluated in DMEM + after 6 h and 24 h incubation. After 24 h incubation, the percentage of Ag+ in the suspensions increased significantly for all tested AgNPs, although dissolution remained low (i.e. <2%; ).
Cell viability
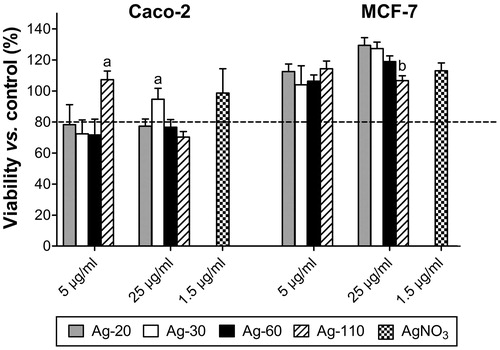
To detect biologically relevant effects by whole genome differential gene expression analysis we established a sub-cytotoxic dose of 80–100% viability. As we previously showed absence of toxicity of 20, 34, 61 and 110 nm phosphate buffered AgNPs up to 50 μg/ml to Caco-2 cells (Bouwmeester et al., Citation2011), only two doses of 5 and 25 μg/ml AgNPs were tested in the current study. After 24 h exposure, Caco-2 cells displayed mild cytotoxicity, but within acceptable sub-toxic viability values, except for the Ag-110 particles, which showed a slightly lower viability of ∼70% at 25 μg/ml (). AgNO3 at a dose of 1.5 μg/ml, corresponding to 3.8% dissolution of AgNPs at a dose of 25 μg/ml, did not induce toxicity. In MCF-7 cells cytotoxicity was completely absent, therefore the highest dose of 25 μg/ml was chosen for the transcriptomics experiments.
Figure 1. Viability of Caco-2 and MCF-7 cells exposed to AgNPs for 24 h, given as a percentage versus the negative control (mean ± SD; n = 3). Significant difference (p ≤ 0.05) versus aall NPs in Caco-2 cells at the same exposure concentration and bversus Ag-20 and Ag-30 at 5 μg/ml in MCF-7 cells.
Cellular uptake
The uptake of AgNPs into cells was quantitatively and qualitatively evaluated by ICP-MS (), CM and TEM (). Due to the small differences in size between the Ag-20 and Ag-30 NPs, the Ag-30 NPs were omitted from these analyses. ICP-MS only gives information on the mass of silver in the cells (), but not on the number of AgNPs these masses represent, so we also calculated the respective number of AgNPs from the measured silver mass (). In order to compare Ag uptake between different exposure groups and cell types we calculated the uptake of silver as a percentage of the total exposed dose (). Based on the latter, Ag uptake appeared to increase with increasing NP size in both cell types, but observed increases were only significant between Ag-20 and Ag-110 and between Ag-60 and Ag-110 in MCF-7 cells after 24 h of exposure, and in Caco-2 cells between Ag-20 and Ag-110 after 6 h exposure. In Caco-2 and MCF-7 cells, the uptake of AgNO3 was higher after 24 h than after 6 h. In contrast, with the exception of Ag-110 NPs, the uptake of the AgNPs did not increase between 6 and 24 h of exposure.
Figure 2. Ag uptake in Caco-2 and MCF-7 cells after 6 and 24 h exposure, as determined by ICP-MS given (A) in μg/ml (mean ± SEM; n = 6), (B) as the number of NPs/ml (mean ± SEM; n = 6) and (C) as a percentage of the total exposure dose (mean ± SEM; n = 6), influence of size (same cell type and exposure time) significant difference (p ≤ 0.05) versus aAg-20, a*Ag-20/Ag-60, a**Ag-20/AgNO3, a***all other groups. Influence of time (same treatment group and cell type), significant difference (p ≤ 0.05) versus b6 h. Influence of cell type (same treatment group and exposure time), significant difference (p ≤ 0.05) versus cMCF-7 cells.
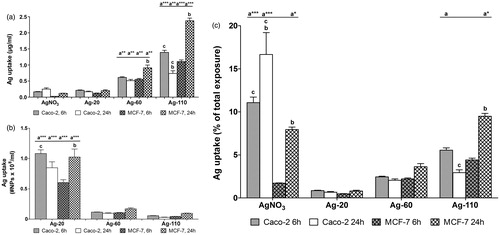
Figure 3. Uptake of AgNPs in Caco-2 and MCF-7 cells after 6 h exposure. Confocal microscopy images of Caco-2 (A) control cells or exposed to (B) AgNO3, (C) Ag-20, (D) Ag-60, (E) Ag-110 for 6 h, and of MCF-7, (F) control cells or exposed to (G) AgNO3, (H) Ag-20, (I) Ag-60 and (J) Ag-110 for 6 h. DAPI/nucleus (blue), LAMP-1 antibody/lysosomes (red) and backscattered signal/AgNPs (green). TEM images of Caco-2 cells exposed for 6 h to (K) Ag-60 and (L) Ag-110 and of MCF-7 cells exposed for 6 h to (M) Ag-60 and to (N, O) Ag-110. Arrows indicate magnifications of the specified area. AgNPs were mostly seen in lysosomal structures (K, L, N), but also in the cytoplasm (O), and very rarely in the nucleus (M). The size and electro density of the AgNPs shows degradation, which appeared to be more severe in the lysosomes when comparing (N) versus (O).
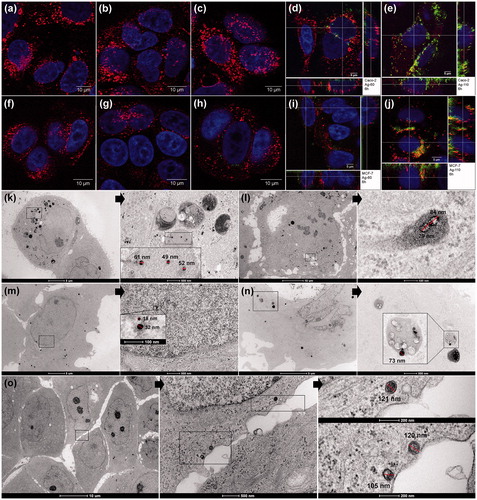
ICP-MS measurement does not allow discrimination between Ag+ and AgNPs, or between cellular associated silver and internalized silver. Therefore, CM and TEM analysis were used to visualize AgNP interactions with the cells. CM clearly showed the presence of Ag-60 and Ag-110 NPs at various planes inside the cells after 6 h exposure (), with partial co-localization with lysosomes in both cell types. AgNPs were not detected in the nucleus. Ag-20 NPs could not be detected after 6 h, most likely because the resolution of CM is too low to detect the smallest AgNPs unless heavily agglomerated or clustered. After 24 h exposure however, low signals of Ag-20 NPs could be detected indicating uptake (Supplementary Material I; Figure S2).
TEM analysis after 6 h exposure also showed uptake of the AgNPs in both cell types. AgNPs were mainly localized in lysosomal structures, but also in the cytoplasm, and occasionally in the nucleus (). Analysis after 24 h exposure showed similar results (data not shown). The size, shape and electron density of the particles indicated degradation of the particles already after 6 h. Due to this degradation the size and electron density of the Ag-20 NPs were highly similar to naturally present electron dense structures in the cells, making it difficult to discriminate between the Ag-20 NPs and regular cellular structures.
Transcriptomic analysis
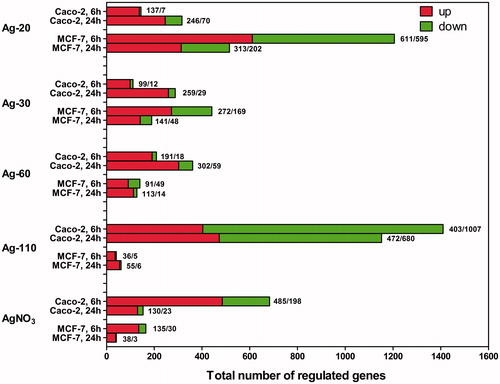
Exposure to AgNPs as well as to AgNO3 induced differential expression of multiple genes in Caco-2 and MCF-7 cells. A threshold of minimal 1.5× FC, with a p value ≤ 0.05 and a FDR ≤ 0.25, was set for selection of DEGs. In general, more DEGs were upregulated than downregulated in both cell types, except for the Caco-2 cells treated with Ag-110 NPs, which resulted in a high number of downregulated genes (). Biological pathway analysis of the gene expression profiles in Caco-2 cells exposed to Ag-110 NPs indicated negative regulation of the cell cycle and downregulation of metabolic and biosynthesis pathways, thus indicating strong cytotoxic effects. This agrees with the lower cell viability results (i.e. ∼70%) for this particular exposure group. Due to this cytotoxicity, this group was disregarded for further analyses.
Figure 4. DEGs in Caco-2 and MCF-7 cells after exposure to AgNPs or AgNO3 compared with the control at t = 6 and t = 24 h (n = 3). Genes with a minimal 1.5FC, a p value ≤ 0.05, and an FDR ≤ 0.25 were selected.
Caco-2 and MCF-7 transcriptional responses; comparison of cell type, NP size and particulate versus ionic silver
In order to evaluate transcriptional responses in detail, all DEGs of each exposure group, as presented in , were grouped in Venn diagrams (). After 6 h and 24 h exposure, 90 and 73 genes respectively were upregulated by all NPs and AgNO3 in Caco-2 cells (Table S1). After 6 h, none of the genes were uniquely affected by all NPs, but after 24 h there were 130 upregulated genes uniquely affected by all NPs. These could potentially be considered “nano specific” upregulated genes (Table S2). However, 83% of these possible “nano specific” genes was upregulated by AgNO3 after 6 h, so the fraction of “nano specific” genes was very low. The same trend was seen for the downregulated genes. MCF-7 cells showed an overlap of 34 expressed genes between all NPs and AgNO3 after 6 h and 24 h exposure. After 24 h, 20 possible “nano specific upregulated genes” were found, but 50% was shared with AgNO3 exposure after 6 h. Furthermore, a heatmap was created by hierarchical clustering of the DEGs, also showing a high overlap in gene expression between AgNO3 and AgNP exposure within each cell type (). Additionally, the heatmap demonstrated significant overlap in the type and direction of DEGs between both cell types ( and S4). Especially clusters 4, 5, 9 and 12 showed a high overlap in DEGs ( and S8, S9, S13 and S16). Deviations in gene expression between both cell types were seen in the other 10 clusters (Figure S5–7, S10–12, S14, S15, S17 and S18). In MCF-7 cells, but not in Caco-2 cells, gene expression appeared to be size dependent in the AgNP exposure groups. The highest response was observed for the group exposed to the smallest NPs, correlating to the lowest intracellular Ag concentration and uptake ( and ) and the highest number of internalized particles ().
Figure 5. Venn diagrams of up- and downregulated genes (1.5FC) in Caco-2 cells after (A) 6 h and (B) 24 h exposure and in MCF-7 cells after (C) 6 h and (D) 24 h exposure to AgNPs or AgNO3. Genes that were shared in aall groups and bthat were shared only between all NP exposure groups. The tables in each corner show the agenes that were grouped in either group or bgiven as a percentage of the total number of DEGs of each exposure group.
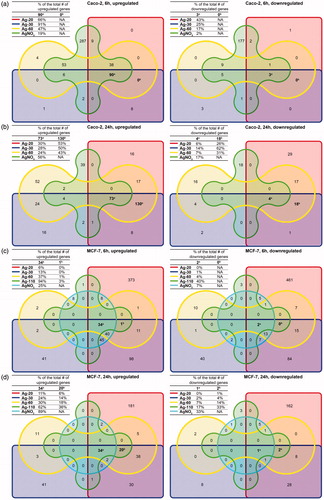
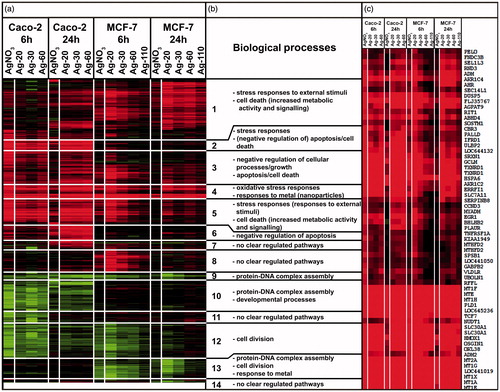
Figure 6. Heatmap of hierarchically clustered DEGs (dendrogram not shown). (A) Each group is given as an average of triplicates with a 2FC threshold. Each row represents a probe for a specific gene and the color and intensity of the color indicates the up- (i.e. red) or downregulation (i.e. green) of this gene. (B) Biological pathways connected to the 14 clusters. (C) Magnification of cluster 4.
Mechanistic responses in Caco-2 and MCF-7 cells
To gain a deeper understanding of the affected biological processes we compared the transcriptional responses on a functional level. These approaches were based on subjection of data generated from previously discussed Venn diagram grouping and hierarchical clustering to Gene Ontology (GO) and pathway analysis. shows the most dominant processes corresponding to each of the 14 clusters given in . More detailed information is given in Supplementary Material II. Clusters 4, 5, 9 and 12 visually showed very similar gene regulation between Caco-2 and MCF-7 cells. The most dominant functional pathways were connected to either induction of (oxidative) stress responses and responses to metal ions (metallothionein (MT) members in cluster 4; ), or downregulation of cell division processes. However, the DEGs in the clusters that were visually deviating between both cell types (i.e. clusters 1, 2, 3, 6, 7, 8, 10, 11, 13, and 14) also mainly correlated to induced stress responses or repressed cell division processes. This indicates that some processes were induced or repressed stronger in one cell type than the other, but the underlying mechanism appears to be similar. The only exceptions concerned were clusters 2, 6, and 8. Clusters 2 and 6 showed an upregulation of anti-apoptotic pathways in Caco-2 cells, but not in MCF-7 cells, and cluster 8 showed an upregulation of genes after 6 h exposure in MCF-7 cells only, but these DEGs could not be correlated to a specific pathway.
Three gene sets (given in Table S1 and S2), extracted from the Caco-2 and MCF-7 Venn diagrams, were also analyzed; 1) the gene set that was upregulated in all exposure groups including the AgNO3 group after 6 h and 2) 24 h exposure and 3) the gene set that was only upregulated in the NP exposure groups after 24 h. In both cell types, GO terms indicated responses to metal stimuli and oxidative stress responses for all three gene sets. In Caco-2 cells also responses connected to cell death were found (Supplementary Material II). A third separate analysis method “gene set enrichment analysis” also confirmed above findings (Supplementary Material I).
Discussion
Nanoparticle characterization
The observed sizes of the AgNPs were in agreement with the TEM data of the manufacturer and the measured dissolution properties corresponded with the existing literature on time dependent release of Ag+ (Foldbjerg et al., Citation2012; Kittler et al., Citation2010), and size-dependent release of Ag+ (Bouwmeester et al., Citation2009; Liu et al., Citation2010a).
Cellular uptake
ICP-MS measurement indicated that AgNP uptake was size dependent, with the largest AgNPs being taken up highest. Size-dependent uptake of NPs has been reported previously for various types of NPs. However, there are contradicting reports on the direction of this size dependency as some reports describe the smallest NPs to be taken up highest (Shapero et al., Citation2011; Zhu et al., Citation2013), others report it the other way around (Cho et al., Citation2011; Hinderliter et al., Citation2010), and also maximal uptake in a privileged size gap was reported (Chithrani et al., Citation2006; Varela et al., Citation2012). Higher uptake of larger NPs could be explained by sedimentation of the larger NPs onto the cells (Hinderliter et al., Citation2010), leading to increased cellular uptake (Cho et al., Citation2011). The Ag uptake in the AgNP exposure groups was relatively stable in time and there were generally no significant differences between the two cell types. The only exception to this was the Ag-110 24 h exposure group in MCF-7 cells, which demonstrated a significant increase in time and was also higher than the same exposure group in Caco-2 cells. The increase in time could be explained by aggregation and thus sedimentation of Ag-110, as they were shown to significantly increase in hydrodynamic size after 24 h. Caco-2 cells might be more resistant to sedimentation of AgNPs. When comparing the AgNP group versus the AgNO3 group many differences were observed. In the AgNO3 group, Ag uptake was time and cell type dependent. The latter could be due to different uptake kinetics, as Caco-2 cells are specialized for absorption, whereas MCF-7 cells are not. The increased uptake in time for the AgNO3 group, as opposed to the more stable Ag concentration for the (smaller) AgNPs groups suggests different uptake mechanisms for Ag+ and AgNPs. NPs have been proposed to be taken up by phagocytotic mechanisms (Aberg et al., Citation2013; Salvati et al., Citation2011), but the exact uptake mechanism of Ag+ is unknown to our knowledge and requires more study.
CM and TEM results showed that AgNPs were taken up in particulate form with partial co-localization of the AgNPs with lysosomes, as shown before (Salvati et al., Citation2011). Also intracellular degradation of AgNPs was demonstrated, supporting the previously proposed “Trojan horse” mechanism of dissolving AgNPs inside the cell (Bouwmeester et al., Citation2011; Gliga et al., Citation2014). It proved difficult to detect the Ag-20 NPs with CM or TEM, due to their small size and degradation. However, taking all data into account (i.e. ICP-MS, CM, and TEM) we are confident that Ag-20 NPs were initially taken up as NPs into the cells like the other AgNPs.
Transcriptomic analysis
As shown in , generally more DEGs were upregulated than downregulated in both cell types. This agrees with a previous study of our group in which 4 h treatment of Caco-2 cells with similar sized and dosed AgNPs and AgNO3 also induced more up- than downloaded genes, although this difference was not statistically significant (Bouwmeester et al., Citation2011). More up- than downregulation has also been reported for HepG2 cells treated with AgNPs (20 nm, 50 nm; 2.5 μg/ml; 4 and 24 h; Sahu et al., Citation2015) and A549 cells treated with AgNPs (16 nm; 12 μg/ml; 24 h) or Ag+ (1.3 μg/ml; 24 h; Foldbjerg et al., Citation2012). In contrast, more down- than upregulated genes have been reported after exposure of 0.5 μg/ml AgNO3 and 25 μg/ml 15 nm AgNPs to differentiated Caco-2 cells for 24 h (Bohmert et al., Citation2015). Like the present study, in the study by Foldbjerg et al., Ag+ induced substantially less DEGs than AgNPs after 24 h exposure. Foldbjerg et al. reported a further decrease in gene expression for Ag+ between 24 h and 48 h. The current study demonstrates that the gene expression induced by Ag+ already decreases between 6 h and 24 h exposure.
Caco-2 and MCF-7 transcriptional responses; comparison of cell type, NP size and particulate versus ionic silver
The gene responses in respect of time and size effects varied between Caco-2 and MCF-7 cells after exposure to AgNPs. Variable responses to metallic NPs between different cell types have been reported previously by Tuomela et al. (Citation2013). AgNO3 affected the number of DEGs after 6 and 24 h in a similar manner, although the numbers were considerably higher in Caco-2 cells. This stronger Caco-2 response is likely due to a higher uptake of silver ions in the Caco-2 cells, as indicated by the ICP-MS measurements. Detailed evaluation of individual genes showed that there was a significant overlap in the specific type of genes that were regulated after exposure to AgNPs and AgNO3 in both Caco-2 and MCF-7 cells. This indicates high similarity in gene expression responses towards silver in particulate and ionic form.
Mechanistic responses in Caco-2 and MCF-7 cells
In the most dominant functional pathways, generally all clusters were connected to either (oxidative) stress responses, responses to metal ions, or cell division. Previously, similar responses were observed in lung epithelial cells exposed 24 h to AgNPs (16 nm; 12.1 μg/ml) (Foldbjerg et al., Citation2012). Exceptions were clusters 2 and 6, showing an upregulation of anti-apoptotic pathways for Caco-2 cells only. Apoptosis has often been reported to be induced by AgNPs through oxidative stress (Gopinath et al., Citation2010; Lee et al., Citation2011) and upregulation of anti-apoptotic pathways could be the result of an adaptation mechanism responding to stress, as previously reported in HepG2 cells exposed to AgNPs (Brzoska et al., Citation2015). As the Caco-2 cells in the present study appeared to have higher stress levels than the MCF-7 cells, possibly in these cells adaptation processes were activated. In both cell types, isoforms of MT genes were upregulated with the highest induction values. MT1 and MT2 are isoforms found in all types of tissues, which were upregulated between 25 and 80FC, and 10 and 40FC on average in Caco-2 and MCF-7 cells, respectively. Previous studies exposing various cell types to metallic NPs also showed a high upregulation of MTs (Bajak et al., Citation2015; Bohmert et al., Citation2015; Bouwmeester et al., Citation2011; Foldbjerg et al., Citation2012; Moos et al., Citation2011; Sahu et al., Citation2015; Tuomela et al., Citation2013). Other highly upregulated genes connected to (oxidative) stress responses included heat shock proteins (HSPs), heme oxygenase 1 (HMOX1), Sulfiredoxin 1 (SRXN1) and Oxidative Stress Induced Growth Inhibitor 1 (OKL38). In correspondence, several studies exposing metal NPs to Caco-2 cells have reported high induction of HMOX1 and/or heat shock proteins as well (Bajak et al., Citation2015; Bohmert et al., Citation2015; Bouwmeester et al., Citation2011; Foldbjerg et al., Citation2012; Kang et al., Citation2012). All applied analysis methods show that there were no indications of NP specific mechanisms, as all responses appeared to be induced mainly by silver ions. These observations are in good correlation with a previous study from our lab, in which the biological activity of AgNPs in Caco-2 cells also appeared to be solely due to the presence of silver ions (Bouwmeester et al., Citation2011). Foldbjerg et al. reported that AgNPs appeared to affect lung epithelial cells in a more complex way than ionic silver alone (Foldbjerg et al., Citation2012). The main differences being a higher number of DEGs and a high number of downregulated genes involved in the regulation and maintenance of the cell-cycle after 24 h exposure (Foldbjerg et al., Citation2012). These findings fully support our data, although we consider the observed effects after 24 h exposure to AgNPs to be due to chronic exposure to Ag+ as a consequence of intracellular AgNP dissolution, rather than to a more complex mechanism of AgNP exposure. In support of this theory, Foldbjerg et al. indicated an induction in cell cycle arrest at the G2/M boundary after 24 h AgNPs exposure, but not after 24 h Ag+ exposure. The “growth arrest and DNA-damage-inducible protein” gene (GADD45a) was indicated as one of the key genes involved in cell cycle arrest at the G2/M boundary. The present study shows that GADD45a was induced 2.2FC after 6 h exposure to Ag+, but the levels of GADD45a expression were unaffected after 24 h exposure. It seems that after 24 h the cells were already recovering from the Ag+ induced stress. Several studies evaluating other metallic NPs also reported the absence of a NP specific mechanism (Moos et al., Citation2011; Tuomela et al., Citation2013).
Conclusions
In both Caco-2 and MCF-7 cells, AgNO3 and AgNP exposures caused strong (oxidative) stress responses. AgNPs were shown to dissolve in the cells after uptake and the observed responses appeared to be largely induced by silver ions. There was no indication for a NP specific mechanism. Evaluation of Caco-2 and MCF-7 cellular responses showed that Caco-2 cells showed a higher sensitivity to AgNPs, slower gene expression response kinetics and absence of size-dependent responses. Nevertheless, when evaluating the responses on a functional level, no significant differences were observed between the two cell types, besides the fact that MCF-7 cells showed milder responses based on the biological processes that were affected. Clearly, the observed differences in responses to AgNP exposure in these epithelial cells derived from two different tissues mainly relate to timing and magnitude, but not to a different underlying mechanism. This implies that for mechanism-based toxicity screening of NPs in epithelial cells, in order to prioritize NPs for safety assessment, use of a single type of epithelial cells may suffice. However, when interested in the sensitivity of a specific tissue to a particular NP, or in the toxicokinetics of a NP in a specific tissue, it is recommended to screen the appropriate cell type for the tissue of interest.
Declaration of interest
The authors have no conflicts of interest to declare.
This research was in part supported by the European Commission 7th framework project QualityNano Transnational Access Facilities grant (QualityNano Grant Agreement No. 262163) and by NanoNextNL, a micro- and nanotechnology consortium of the Government of the Netherlands and 130 partners.
Supplementary material available online
Supplementary Materials
Download Zip (13.3 MB)Acknowledgements
The authors would like to thank D. Scholz, T. O'Neill and G. Vaz (Conway Institute of Biomolecular and Biomedical Research, University College Dublin) for their excellent expertise and assistance with the TEM and CM analyses.
References
- Aberg C, Kim JA, Salvati A, Dawson KA. 2013. Theoretical framework for nanoparticle uptake and accumulation kinetics in dividing cell populations. Epl-Europhys Lett 101:38007–13
- Bajak E, Fabbri M, Ponti J, Gioria S, Ojea-Jimenez I, Collotta A, et al. 2015. Changes in Caco-2 cells transcriptome profiles upon exposure to gold nanoparticles. Toxicol Lett 233:187–99
- Bohmert L, Niemann B, Lichtenstein D, Juling S, Lampen A. 2015. Molecular mechanism of silver nanoparticles in human intestinal cells. Nanotoxicology 9:852–60
- Bohmert L, Niemann B, Thunemann AF, Lampen A. 2012. Cytotoxicity of peptide-coated silver nanoparticles on the human intestinal cell line Caco-2. Arch Toxicol 86:1107–15
- Bouwmeester H, Dekkers S, Noordam MY, Hagens WI, Bulder AS, de Heer C, et al. 2009. Review of health safety aspects of nanotechnologies in food production. Regul Toxicol Pharmacol 53:52–62
- Bouwmeester H, Poortman J, Peters RJ, Wijma E, Kramer E, Makama S, et al. 2011. Characterization of translocation of silver nanoparticles and effects on whole-genome gene expression using an in vitro intestinal epithelium coculture model. ACS Nano 5:4091–103
- Brzoska K, Meczynska-Wielgosz S, Stepkowski TM, Kruszewski M. 2015. Adaptation of HepG2 cells to silver nanoparticles-induced stress is based on the pro-proliferative and anti-apoptotic changes in gene expression. Mutagenesis 30:431–9
- Chalew TEA, Schwab KJ. 2013. Toxicity of commercially available engineered nanoparticles to Caco-2 and SW480 human intestinal epithelial cells. Cell Biol Toxicol 29:101–16
- Chithrani BD, Ghazani AA, Chan WCW. 2006. Determining the size and shape dependence of gold nanoparticle uptake into mammalian cells. Nano Lett 6:662–8
- Cho EC, Zhang Q, Xia YN. 2011. The effect of sedimentation and diffusion on cellular uptake of gold nanoparticles. Nat Nanotechnol 6:385–91
- Christensen J, El-Gebali S, Natoli M, Sengstag T, Delorenzi M, Bentz S, et al. 2012. Defining new criteria for selection of cell-based intestinal models using publicly available databases. BMC Genomics 13:274. doi: 10.1186/1471-2164-13-274
- Dennis G, Jr Sherman BT, Hosack DA, Yang J, Gao W, Lane HC, Lempicki RA. 2003. DAVID: Database for Annotation, Visualization, and Integrated Discovery. Genome Biol 4:P3
- Foldbjerg R, Irving ES, Hayashi Y, Sutherland DS, Thorsen K, Autrup H, Beer C. 2012. Global gene expression profiling of human lung epithelial cells after exposure to nanosilver. Toxicol Sci 130:145–57
- Gaiser BK, Fernandes TF, Jepson MA, Lead JR, Tyler CR, Baalousha M, et al. 2012. Interspecies comparisons on the uptake and toxicity of silver and cerium dioxide nanoparticles. Environ Toxicol Chem 31:144–54
- Gliga AR, Skoglund S, Wallinder IO, Fadeel B, Karlsson HL. 2014. Size-dependent cytotoxicity of silver nanoparticles in human lung cells: the role of cellular uptake, agglomeration and Ag release. Part Fibre Toxicol 11:11. doi: 10.1186/1743-8977-11-11
- Gopinath P, Gogoi SK, Sanpui P, Paul A, Chattopadhyay A, Ghosh SS. 2010. Signaling gene cascade in silver nanoparticle induced apoptosis. Colloids Surf B Biointerfaces 77:240–5
- Hartung T, Luechtefeld T, Maertens A, Kleensang A. 2013. Food for thought … integrated testing strategies for safety assessments. Altex-Altern Anim Ex 30:3–18
- Hinderliter PM, Minard KR, Orr G, Chrisler WB, Thrall BD, Pounds JG, Teeguarden JG. 2010. ISDD: a computational model of particle sedimentation, diffusion and target cell dosimetry for in vitro toxicity studies. Part Fiber Toxicol 7:36. doi: 10.1186/1743-8977-7-36
- Ivask A, ElBadawy A, Kaweeteerawat C, Boren D, Fischer H, Ji ZX, et al. 2014. Toxicity mechanisms in Escherichia coli vary for silver nanoparticles and differ from ionic silver. ACS Nano 8:374–86
- Jeyaraj M, Sathishkumar G, Sivanandhan G, MubarakAli D, Rajesh M, Arun R, et al. 2013. Biogenic silver nanoparticles for cancer treatment: an experimental report. Colloid Surface B 106:86–92
- Kamburov A, Pentchev K, Galicka H, Wierling C, Lehrach H, Herwig R. 2011. ConsensusPathDB: toward a more complete picture of cell biology. Nucleic Acids Res 39:D712–17
- Kang SJ, Ryoo IG, Lee YJ, Kwak MK. 2012. Role of the Nrf2-heme oxygenase-1 pathway in silver nanoparticle-mediated cytotoxicity. Toxicol Appl Pharmacol 258:89–98
- Kittler S, Greulich C, Diendorf J, Koller M, Epple M. 2010. Toxicity of silver nanoparticles increases during storage because of slow dissolution under release of silver ions. Chem Mater 22:4548–54
- Lamb J, Crawford ED, Peck D, Modell JW, Blat IC, Wrobel MJ, et al. 2006. The connectivity map: using gene-expression signatures to connect small molecules, genes, and disease. Science 313:1929–35
- Lee YS, Kim DW, Lee YH, Oh JH, Yoon S, Choi MS, et al. 2011. Silver nanoparticles induce apoptosis and G2/M arrest via PKCζ-dependent signaling in A549 lung cells. Arch Toxicol 85:1529–40
- Lefebvre DE, Venema K, Gombau L, Valerio LG, Jr Raju J, Bondy GS, et al. 2015. Utility of models of the gastrointestinal tract for assessment of the digestion and absorption of engineered nanomaterials released from food matrices. Nanotoxicology 9:523–42
- Lemire JA, Harrison JJ, Turner RJ. 2013. Antimicrobial activity of metals: mechanisms, molecular targets and applications. Nat Rev Microbiol 11:371–84
- Lin K, Kools H, de Groot PJ, Gavai AK, Basnet RK, Cheng F, et al. 2011. MADMAX – management and analysis database for multiple ∼omics experiments. J Integr Bioinform 8:160
- Liu J, Sonshine DA, Shervani S, Hurt RH. 2010a. Controlled release of biologically active silver from nanosilver surfaces. ACS Nano 4:6903–13
- Liu W, Wu YA, Wang C, Li HC, Wang T, Liao CY, et al. 2010b. Impact of silver nanoparticles on human cells: effect of particle size. Nanotoxicology 4:319–30
- Loeschner K, Hadrup N, Qvortrup K, Larsen A, Gao XY, Vogel U, et al. 2011. Distribution of silver in rats following 28 days of repeated oral exposure to silver nanoparticles or silver acetate. Part Fiber Toxicol 8:18. doi: 10.1186/1743-8977-8-18
- Lomer MCE, Thompson RPH, Powell JJ. 2002. Fine and ultrafine particles of the diet: influence on the mucosal immune response and association with Crohn's disease. Proc Nutr Soc 61:123–30
- Martin B, Chadwick W, Yi T, Park SS, Lu D, Ni B, et al. 2012. VENNTURE – a novel Venn diagram investigational tool for multiple pharmacological dataset analysis. PLoS One 7:e36911. doi: 10.1371/journal.pone.0036911
- Martirosyan A, Bazes A, Schneider YJ. 2014. In vitro toxicity assessment of silver nanoparticles in the presence of phenolic compounds-preventive agents against the harmful effect? Nanotoxicology 8:573–82
- Moos PJ, Olszewski K, Honeggar M, Cassidy P, Leachman S, Woessner D, et al. 2011. Responses of human cells to ZnO nanoparticles: a gene transcription study. Metallomics 3:1199–211
- Nel AE, Nasser E, Godwin H, Avery D, Bahadori T, Bergeson L, et al. 2013. A multi-stakeholder perspective on the use of alternative test strategies for nanomaterial safety assessment. ACS Nano 7:6422–33
- Provencher SW. 1979. Inverse problems in polymer characterization: direct analysis of polydispersity with photon correlation spectroscopy. Makromol Chem 180:201–9
- Provencher SW. 1982. A constrained regularization method for inverting data represented by linear algebraic or integral equations. Comput Phys Commun 27:213–27
- Sahu SC, Zheng J, Yourick JJ, Sprando RL, Gao X. 2015. Toxicogenomic responses of human liver HepG2 cells to silver nanoparticles. J Appl Toxicol 35:1160–8
- Salvati A, Aberg C, dos Santos T, Varela J, Pinto P, Lynch I, Dawson KA. 2011. Experimental and theoretical comparison of intracellular import of polymeric nanoparticles and small molecules: toward models of uptake kinetics. Nanomedicine 7:818–26
- Shapero K, Fenaroli F, Lynch I, Cottell DC, Salvati A, Dawson KA. 2011. Time and space resolved uptake study of silica nanoparticles by human cells. Mol Biosyst 7:371–8
- Shieh MJ, Hsu CY, Huang LY, Chen HY, Huang FH, Lai PS. 2011. Reversal of doxorubicin-resistance by multifunctional nanoparticles in MCF-7/ADR cells. J Control Release 152:418–25
- Smyth GK. 2004. Linear models and empirical Bayes methods for assessing differential expression in microarray experiments. Stat Appl Genet Mol Biol 3: Article3. doi: 10.2202/1544-6115.1027
- Tuomela S, Autio R, Buerki-Thurnherr T, Arslan O, Kunzmann A, Andersson-Willman B, et al. 2013. Gene expression profiling of immune-competent human cells exposed to engineered zinc oxide or titanium dioxide nanoparticles. PLoS One 8:e68415. doi: 10.1371/journal.pone.0068415
- van der Zande M, Vandebriel RJ, Van Doren E, Kramer E, Rivera ZH, Serrano-Rojero CS, et al. 2012. Distribution, elimination, and toxicity of silver nanoparticles and silver ions in rats after 28-day oral exposure. ACS Nano 6:7427–42
- Varela JA, Bexiga MG, Aberg C, Simpson JC, Dawson KA. 2012. Quantifying size-dependent interactions between fluorescently labeled polystyrene nanoparticles and mammalian cells. J Nanobiotechnol 10:39. doi: 10.1186/1477-3155-10-39
- Wang T, Petrenko VA, Torchilin VP. 2010. Paclitaxel-loaded polymeric micelles modified with MCF-7 cell-specific phage protein: enhanced binding to target cancer cells and increased cytotoxicity. Mol Pharm 7:1007–14
- Yallapu MM, Jaggi M, Chauhan SC. 2012. Curcumin nanoformulations: a future nanomedicine for cancer. Drug Discov Today 17:71–80
- Zhu J, Liao L, Zhu LN, Zhang P, Guo K, Kong JL, et al. 2013. Size-dependent cellular uptake efficiency, mechanism, and cytotoxicity of silica nanoparticles toward HeLa cells. Talanta 107:408–15