
Abstract
Predictive models for the impact of nanomaterials on biological systems remain elusive. Although there is agreement that physicochemical properties (particle diameter, shape, surface chemistry, and core material) influence toxicity, there are limited and often contradictory, data relating structure to toxicity, even for core diameter. Given the importance of size in determining nanoscale properties, we aimed to address this data gap by examining the biological effects of a defined series of gold nanoparticles (AuNPs) on zebrafish embryos. Five AuNPs samples with narrowly spaced core diameters (0.8–5.8 nm) were synthesized and functionalized with positively charged N,N,N-trimethylammonium ethanethiol (TMAT) ligands. We assessed the bioactivity of these NPs in a high-throughput developmental zebrafish assay at eight concentrations (0.5–50 µg/mL) and observed core diameter-dependent bioactivity. The smaller diameter AuNPs were the most toxic when expressing exposures based on an equal mass. However, when expressing exposures based on total surface area, toxicity was independent of the core diameter. When holding the number of nanoparticles per volume constant (at 6.71 × 10¹³/mL) in the exposure medium across AuNPs diameters, only the 5.8 nm AuNPs exhibited toxic effects. Under these exposure conditions, the uptake of AuNPs in zebrafish was only weakly associated with core diameter, suggesting that differential uptake of TMAT-AuNPs was not responsible for toxicity associated with the 5.8 nm core diameter. Our results indicate that larger NPs may be the most toxic on a per particle basis and highlight the importance of using particle number and surface area, in addition to mass, when evaluating the size-dependent bioactivity of NPs.
Introduction
Over the last 30 years, nanomaterials have been intensively studied to understand their size-dependent properties in order to harness those emerging properties for new technologies and products (Murph, Larsen and Coopersmith, Citation2017). Size-dependent properties are observed throughout the nanoscale (1–100 nm) and are more pronounced as dimensions drop below 30 nm (Auffan et al. Citation2009). Nano-enabled applications are found in nearly every industrial sector and in consumer products, from biomedicine to electronics (Khan, Saeed and Khan, Citation2017). The emergence of nano-enabled products has garnered interest in understanding their potential impacts on human and environmental health (Buzea, Pacheco and Robbie, Citation2007). Within the last decade, research has focused on understanding the biological impacts and interactions of different types of nanoparticles (NPs) as a function of their size, shape and surface chemistry (Lewinski, Colvin and Drezek, Citation2008). A principle goal of this research is to develop structure–activity relationships (SARs) that can be used to predict the impacts of novel NPs based upon their structural features (Oksel et al. Citation2015).
Considerable progress has been made in the study of NP bioimpacts (Albanese, Tang and Chan, Citation2012; Kunzmann et al. Citation2011; Mu et al. Citation2014). However, predictive SARs have been challenging to develop because of the lack of NP samples with defined structures and known purity (Ray, Yu and Fu, Citation2009; Richman and Hutchison, Citation2009), the complexities introduced by NP reactivity (Lai, Citation2015) and the type of assays used to assess impacts (Joris et al. Citation2013; Kim and Tanguay Citation2014; Saifi, Khan and Godugu Citation2018). Thus far, it is well established that inorganic NPs induce toxicity when toxic ions are released from their cores during dissolution (Kittler et al. Citation2010), and when their cores produce reactive oxygen species through surface-mediated redox reactions (Fu et al. Citation2014). Ligands (molecules bound to the surface of a nanoparticle) also influence toxicity. For example, positively charged ligands such as quaternary ammonium ions are considerably more toxic (Chompoosor et al. Citation2010; Harper et al. Citation2011) than ethylene glycol-based ligands (Harper et al. Citation2011). Passivation of the surface by a ligand shell on an inorganic core, in general, may be important to minimize the production of reactive oxygen species on catalytically active surfaces (Truong et al. Citation2017).
Nanoparticle size is often manipulated to govern optical, electronic and catalytic properties, making it a potential driver of NP toxicity. Several studies suggest that smaller core sizes may be more toxic (Fratoddi et al. Citation2015; He et al. Citation2010; Hirn et al. Citation2011; Jiang, Oberdörster and Biswas, Citation2009; Pan et al. Citation2007) However, many questions remain, given the limited number of NPs that have been tested and complications due to variations in surface chemistry, purity and size uniformity (Alkilany and Murphy, Citation2010; Khan, Saeed and Khan, Citation2017). Well-defined model systems, often based upon gold nanoparticles (AuNPs), have been employed in attempts to address these complications.
AuNPs are compelling systems for such studies because gold does not leach toxic ions, it is often possible to passivate the NPs with ligands to achieve a defined surface chemistry and, in some cases, it is possible to produce NPs with specific core sizes. Each of these three attributes has been much harder to control in NPs made from commonly studied materials involving other metal and metal oxide cores. In addition to their utility as defined model systems, AuNPs are widely used in biological applications because of their unique surface chemistry and optical properties, strong and size-tunable surface plasmon resonance, and easy surface functionalization (Boisselier and Astruc Citation2009; Saha et al. Citation2012).
The effects of size on the cytotoxicity, cellular uptake, biodistribution, and toxicity in other model systems have been widely studied and summarized in several comprehensive reviews (Alkilany and Murphy, Citation2010; Dykman and Khlebtsov Citation2012; Fratoddi et al. Citation2015; Jia et al. Citation2017; Johnston, Hutchison, Christensen, Peters, Hankin and Stone, Citation2010, Khlebtsov and Dykman, Citation2011). The authors of these reviews point out that there are contradictory conclusions in the literature regarding whether AuNPs are toxic and whether larger or smaller AuNPs are more toxic (Alkilany and Murphy, Citation2010, Johnston et al. Citation2010; Oberdorster et al. Citation2005). Although studies often suggest that smaller nanoparticles are more toxic, at least when evaluated on a mass exposure basis, Fradoti et al. conclude that larger particles may be more toxic than smaller ones based upon aggregated data from nine different studies (Fratoddi et al. Citation2015).
Only a few studies have been conducted wherein the surface ligand chemistry was held constant while the nanoparticle core diameter was systematically varied to specifically probe the size dependence. Pan et al. investigated a series of gold nanoparticles possessing sulfonated triphenylphosphine ligands and demonstrated the cytotoxicity was dependent on their size, where both the smaller (0.8 nm) and larger (15 nm) were less cytotoxic than the 1–2 nm particles (Pan et al. Citation2007). Yen et al. examined the cytotoxicity of gold nanoparticles containing no ligand shell in three diameter ranges: 2–4, 5–7 and 20–40 nm and found that cytotoxicity increased as the core diameters decreased (Yen, Hsu and Tsai, Citation2009). When gold nanoparticles of three-core size, 1.5, 4, and 14 nm were applied to Human Embryonic Stem Cells (hESCs), only 1.5 nm nanoparticles showed toxicity to hESC viability while the other two nanoparticles exhibited almost no toxic effects (Senut et al. Citation2016). In our work, comparing the toxicity of N,N,N-trimethylammonium ethanethiol-passivated 0.8, 1.5, and 15 nm diameter AuNPs using embryonic zebrafish, we found that the smaller AuNPs were more toxic when compared on an equal-mass concentration, but pointed out that comparing the toxicity based upon total surface area or number of particles would be more informative when considering the relative toxicity of these materials (Harper et al. Citation2011).
The authors of the reviews cited above and others have pointed out the importance of considering the concentration metric, especially when making comparisons between nanoparticle samples (Johnston et al. Citation2010; Oberdorster et al. Citation2005). Johnston et al. assert the importance of comparing toxicity on equal surface area and equal particle number as a means of determining which attributes of the nanoparticle are responsible for their toxicity (Johnston et al. Citation2010). Although equal-mass concentration is valuable for comparing the relative toxicity in practical applications, those metrics related to surface area and particle number may provide better information about the mechanisms of toxicity.
Given the limited understanding of the relationship between size and activity available from the studies described above, we examined NP toxicity as a function of size at the lower end of the nanoscale (<10 nm). To systematically evaluate the interdependence of size and other effects, we designed and synthesized a series of AuNPs with five precisely engineered core diameters (0.8, 0.9, 1.3, 1.7, and 5.8 nm) with identical surface chemistry (a complete ligand shell of (N,N,N-trimethylammonium ethanethiol trifluoroacetate or TMAT) that controlled for parameters including core material, surface chemistry and stability (Harper et al. Citation2011; Tantra, Citation2016). Positively charged TMAT-protected particles were chosen to study whether toxicity could be modified in a core diameter-dependent manner based on our previous work (Harper et al. Citation2011). We used the developmental zebrafish to investigate and compare the toxicity of each core diameter of TMAT-functionalized AuNP.
To further understand the basis for NP toxicity in these materials, we assessed three different exposure metrics (mass, surface area, and particle number) in a developmental zebrafish assay in water. When the mass and surface area exposure metrics were considered, the smallest NPs were more toxic. When solutions of the different sized AuNPs containing the same number of particles per unit volume for each was examined, we discovered that the larger NPs were more toxic on a per NP basis. Our results highlight the importance of using particle number and surface area, in addition to mass, when evaluating the size-dependent bioactivity of NPs.
Methods
Materials synthesis and characterization
Chemicals. Hydrogen tetrachloroaurate (HAuCl4·H2O) was purchased from Strem (Newburyport, MA) and used as received. Dichloromethane (DCM) and chloroform (CHCl3) was purchased from Fisher Scientific. Chloroform was filtered through the plug of basic alumina to remove acidic impurities. Thiocholine (N,N,N-trimethylammonium ethanethiol trifluoroacetate) (TMAT) was synthesized according to the published procedure (Kim et al. Citation2013; Warner and Hutchison Citation2003). All other compounds were purchased from Sigma-Aldrich (St. Louis, MO) and used as received. Nanopure water (18.2 MΩ·cm resistivity) was prepared with a Barnstead Nanopure filtration system and used for all aqueous samples. The samples synthesized were purified either by diafiltration (Sweeney, Woehrle and Hutchison, Citation2006) using polyethersulfone diafiltration membranes (OmegaTM 10 kDa or 100 kDa PES ultrafiltration membrane) obtained from Pall Life Sciences (Port Washington, NY) or by size exclusion chromatography (Sephadex G-50 Fine, GE Healthcare). Carboxyl-functionalized SMART grids for TEM imaging were purchased from Dune Sciences (Eugene, OR).
AuNP synthesis and characterization. All NPs were prepared through interfacial ligand exchange reactions between triphenylphosphine- or tetraoctylammonium bromide (TOAB)-protected NPs and TMAT using published procedures (Kearns, Citation2007; McKenzie, Zaikova and Hutchison Citation2014; Woehrle, Brown and Hutchison Citation2005) briefly described below. The thiocholine trifluoroacetate solutions were neutralized by passing them through a poly (4-vinylpyridine) column before addition to the NP solutions for all syntheses because acidic TMAT solutions lead to NP decomposition during ligand exchange.
Synthesis of 0.8 nm AuNPs. A solution of TMAT (27 mg, 0.11 mmol) in 12 mL of water was added to a solution of [Au11(PPh3)8Cl2]Cl (24 mg, 0.005 mmol) in 12 mL of CHCl3 and deoxygenated with Ar for 2 minutes. The biphasic mixture was stirred rapidly at 45 °C under N2 for 16 h until all colored NPs were transferred from organic to aqueous phase. After cooling to room temperature, the water layer was isolated in a separatory funnel and washed with CH2Cl2 (20 mL × 3). The solution was concentrated to 0.5 mL using a rotary evaporator at room temperature and eluted on a Sephadex 50 column with water to give final product as a brown-orange powder after lyophilization. The powder was characterized by 1H NMR, UV-vis spectroscopy, SAXS, and TEM.
Synthesis of 0.9 nm TMAT-AuNPs. The same procedure was used as for the 0.8 nm particles synthesis but the biphasic mixture was stirred rapidly at 60°C under N2 for 2 h until all colored NPs were transferred from organic to aqueous phase. After chromatography on a Sephadex 50 column with water, the final product was obtained as a brown powder after lyophilization. The powder was characterized by 1H NMR, UV-vis spectroscopy, SAXS, and TEM.
Synthesis of 1.3 nm TMAT-AuNPs. A solution of Au101(PPh3)21Cl5 (90 mg, 0.003 mmol) in 20 mL of DCM was added to a solution of thiocholine trifluoroacetate (82 mg, 0.3 mmol) in 25 mL of water. The biphasic reaction mixture was stirred rapidly at room temperature for 23 h. The reaction was deemed complete when the dark-colored NPs were transferred from the organic to the aqueous phase. The phases were then separated, and organic impurities were removed by washing the aqueous layer with DCM (30 mL × 3). Traces of organic solvents were removed under reduced pressure at room temperature. The crude material was purified by diafiltration using a 10 kDa membrane with 2000 mL (100 volumes) of nanopure water. After lyophilization, the dark brown powder was collected and characterized by 1H NMR, UV-vis spectroscopy, SAXS, and TEM.
Synthesis of 1.7nm TMAT-AuNPs. The same procedure was used as for the 1.3 nm particles synthesis using a 1.7 nm nanoparticle as the starting material.
Synthesis of 5.8 nm TMAT-AuNPs. The synthesis was performed in two steps. In the first step, TOAB-stabilized particles were synthesized following the literature procedure (Fink, Kiely, Bethell and Schiffrin, Citation1998). Briefly, HAuCl4 (118 mg, 0.29 mmol) was dissolved in 10 mL of water in a 150 mL round-bottom flask containing a magnetic stir bar. Upon the addition of TOAB (730 mg, 1.33 mmol) previously dissolved in 27 mL of toluene, the color transferred into the toluene phase and the solution turned deep orange during 5 min. NaBH4 (127 mg, 3.35 mmol), freshly dissolved in 10 mL of water, was rapidly added to the toluene solution causing the mixture to bubble vigorously, turn brown and, after about 1 min turn to a deep red color. The toluene layer was separated, washed with 30 mL × 4 of water and placed into a round bottom flask with a stir bar.
In the second step, TMAT-AuNPs were synthesized through a biphasic ligand exchange reaction of TOAB-stabilized particles in toluene with TMAT (Kearns Citation2007). TMAT (100 mg) was dissolved in 30 mL of water and neutralized by passing through a column of poly (4-vinylpyridine) before adding it to the toluene solution obtained from the first step. The biphasic reaction mixture was stirred rapidly at room temperature for 23 h. The reaction was deemed complete when the dark-colored NPs transferred from the organic to aqueous phase. The aqueous layer was isolated and extracted with 30 mL × 5 of DCM to remove remaining toluene. Traces of organic solvents remaining after the extractions were removed by rotary evaporation at room temperature. The crude material was purified by diafiltration using a 100 kDa membrane with 2000 mL (100 volumes) of nanopure water. After lyophilization, the powder was collected and characterized by 1H NMR, UV-vis spectroscopy, SAXS, and TEM.
Characterization of TMAT-AuNPs. 1H NMR, UV-vis spectroscopy, TEM, SAXS and Polyacrylamide Gel Electrophoresis (PAGE) were used to characterize the TMAT-AuNPs synthesized (Richman and Hutchison Citation2009).
1H NMR: The presence of free ligand, unwanted by-products, and excess reactants were detected using 1H NMR. Spectra were collected at 25 °C on Bruker 600 MHz NMR Spectrometers with Prodigy multinuclear broadband BBO CryoProbe (5 mm sample diameter) in D2O. Chemical shifts were obtained in ppm with the residual solvent peak (D2O, δ4.65) as the internal standard.
UV-vis: UV-vis spectra were used to monitor the stability of TMAT-AuNPs in water and in embryo medium over five days (the typical duration of toxicity tests). Embryo media consisted of 15 mM NaCl, 0.5 mM KCl,1 mM MgSO4, 0.15 mM KH2PO4, 0.05 mM Na2HPO4 and 0.7mM NaHCO3 (Westerfield Citation2007). Spectra were analyzed on a Hewlett-Packard 8453 diode array instrument with a fixed slit width of 1 nm using 1-cm quartz cuvettes.
Small angle x-ray scattering (SAXS): The core diameters of the TMAT-AuNPs were determined in solution using SAXS measured on an Anton Paar SAXSess instrument. Samples for SAXS were prepared at about 250–500 mg/L and exposed to X-rays from a Long Fine Focal spot (LFF) sealed X-rays tube (Cu 1.54 Å) powered by a generator at 2 kW, using in-line collimation mode, monochromatized and focused by multilayer optics, measured with a Roper CCD in a Kratky camera. An average of 50 scans of 50 s was used for these samples. Both the background and dark current were subtracted before desmearing using the beam profile generated by the transmitted beam in an Anton Paar SAXSQuant. The size distribution was determined by the desmeared data fitted in the IRENA package for IGOR Pro (Ilavsky and Jemian, Citation2009).
Transmission electron microscopy (TEM): TEM was used to confirm NP size and shape. Images were collected at 300 kV with an FEI Titan using Cs aberration corrector. NP samples were prepared on carboxyl-functionalized SMART grids by soaking the grid in a dilute NP solution (0.2 mg/mL) and then rinsing by soaking in nanopure water for 2 min each. The grid was then air dried. Particle size analysis from TEM images was performed using ImageJ software from the NIH Website (Woehrle et al. Citation2006).
Polyacrylamide gel electrophoresis (PAGE): Native PAGE was used to analyze the relative core sizes of the TMAT-AuNPs. Glass plates were cleaned using methanol saturated with KOH, rinsed with water and ethanol, and then positioned 0.75 mm apart. The gel was prepared by reacting 20% 19:1 acrylamide:bisacrylamide solution in 30 mM pH 9 bicine buffer with 0.1% (w/v) ammonium persulfate, and 0.01% (v/v) tetramethylethylenediamine for 2 h. The resultant gel was incubated in 30 mM pH 9 bicine running buffer, and 150 V (7V/cm) was applied for 15 min before adding the TMAT-AuNPs. Solutions containing 4 mg/mL TMAT-AuNPs were prepared by dissolving lyophilized particles in 30 mM pH 9 bicine buffer and 10% glycerol. After loading the samples, 150 V (7V/cm) was applied to the gel for 3 h, and the results were photographed. The TMAT-AuNPs remained the same color in the gel for days after electrophoretic resolution, indicating that they were stable during electrophoresis. In order to analyze these positively charged nanoparticles using a vertical gel, the positive bias was applied to the top of the apparatus, and the negative bias applied to the bottom. It should be noted that the type of buffer used during electrophoresis significantly affected the stability of the nanoparticles inside the gel (see supporting information).
Zebrafish
Husbandry and developmental toxicity testing
Adult Tropical 5D zebrafish were raised at Sinnhuber Aquatic Research Laboratory (SARL) at Oregon State University. The zebrafish were raised in standard laboratory conditions (28°C with 14 h light: 10 h dark photo cycle). Adult zebrafish are fed size appropriate Gemma Micro (Skretting Inc, Tooele, France) twice daily without supplementation of any live feed (Barton, Johnson and Tanguay Citation2016). For developmental toxicity testing, embryos were collected and staged according to Kimmel et al (Citation1995). All TMAT-AuNPs were suspended to 1000 µg/mL in ultrapure water (Invitrogen). Serial dilutions in ultrapure water were made from the nanoparticle suspensions. Individual wells of a 96-well plate were prefilled with test solutions with a final well concentration of 0, 0.5, 1.08, 2.32, 5, 10.8, 23.2, and 50 µg/mL. Embryos were dechorionated at 4 h post fertilization (hpf) using an automated dechorionator and 83 µL of 25.3 U/µL of pronase (Roche, Indianapolis, IN, USA) (Mandrell et al. Citation2012). At 6 hpf, embryos were manually placed in each well. A total of 8 concentrations were tested with 36 animals per concentration. The plates were sealed with parafilm, and wrapped in aluminum foil until 120 hpf. A total of 22 endpoints were evaluated at 24 and 120 hpf and stored in a laboratory information management system (ZAAP) (Truong, Harper and Tanguay Citation2011; Truong et al. Citation2014). Statistical significance was computed as described in Truong et al. (Truong et al. Citation2014) and Zhang et al. (2016). Adult care and reproductive techniques followed the Institutional Animal Care and Use Committee protocols at Oregon State University.
Body burden
Initial testing with equal particle numbers in the exposure medium for TMAT-AuNPs (6.71 × 10¹³ per mL) resulted in 100% mortality in embryos exposed to 5.8 nm TMAT-AuNP at 24 hpf. Therefore, for the body burden studies, we diluted the number of particles in the exposure medium by 50% and exposed embryos from 6 to 24 hpf to 3.35 × 10¹³ per mL AuNP-TMAT. Methods were used as described by Truong et al, with some modification in sample preparation (Truong et al. Citation2013). Exposed embryos were washed in the wells of a 96-well plate 10 times using a Rainin Liquidator, with an exchange volume of 100 µL ultrapure water. Each biological replicate (n = 3) was a 14-mL round bottom centrifuge tube consisting of three embryos, with all excess water removed and was stored at −80 °C until time for analysis. Samples were digested overnight using 98 µL of nitric acid. A Thermo X-series II Inductively Coupled Plasma – Mass Spectroscopy was used to quantify gold in the samples after digestion with nitric acid, and internal standards added (final concentration of 2 ppb Indium, Rhenium and Bismuth), and brought to a final volume of 5 mL. A 5-point standard curve was created using a purchased gold standard (0.01, 0.1, 1, 5, and 10 µg/L) and had an R2 value of 0.998. The mean ng of gold was averaged across the three biological samples and a one-way ANOVA was used to determine statistical significance. The uptake concentration was calculated by converting the number of ng of gold to moles, then to number of particles. An uptake ratio was calculated using –log10 (# of particles in embryo/number of particles in the exposure media (3.35 × 10¹³ per mL)).
Statistical modeling
All statistical analyses were carried out using R (R Core Team Citation2016).
Concentration-Response modeling
Sigmoidal curves are often fit to toxicological concentration-response data. Here, we used a Hill Model (specifically a four-parameter log-logistic function) that was fit to the average of all individuals at each concentration for each TMAT-AuNP. Each point the curve was fitted to represents the mean % of affected individuals for a given TMAT-AuNP at a specific property value. The Hill model is commonly used in toxicology. The four parameters in this model correspond to the lower limit, upper limit, EC50 (inflection point of the curve), and the ‘Hill’ slope.
All curves were fit with the drm() function in the drc package in R. The function used least squares estimation to fit the curves. Normalized Root Mean Square Error (NRMSE) and Akaike Information Criterion (AIC) were computed to assess the strength of each curve to explain the underlying data (goodness of fit).
Determining the toxic transition threshold
A toxic transition value was determined for each property. The placement of the toxic transition line is based on experimental data. It is placed on the x-axis at the location (1) directly to the left of the first two consecutive points that fall above a certain threshold on the y-axis or (2) directly to the left of the first point above the threshold if the fitted curve has already crossed over the threshold on the y-axis, whichever happens first. The threshold was determined as an increase from baseline (% affected in control) of 10% of the range of the data from baseline to highest affected percentage. This 10% value was chosen because it puts the threshold (0.179) beyond the upper limit of a 95% confidence interval (0.051, 0.127) around the mean proportion of affected fish in the control. This 10% value can be adjusted. This threshold was set to allow some individual variability at each property value so that the transition line is not placed too far to the left of the curve. It prevents a “toxic” call from being made before there is enough evidence of a toxic effect, making any call more robust and less likely to be a false positive.
Results and discussion
In previous studies, we observed that AuNP toxicity depends on the surface chemistry, type and number of ligands, and purity (Harper et al. Citation2011; Schaeublin et al. Citation2011; Truong et al. Citation2017). We found that positively charged TMAT-protected 0.8 nm and 1.5 nm particles were the most toxic when compared to negatively charged or neutral AuNPs (Harper et al. Citation2011; Truong et al. Citation2013). This structure–activity relationship led us to utilize TMAT-AuNPs to investigate the impact of core diameter on toxicity. We synthesized five specific sizes of gold nanoparticles in the sub 10 nanometer range to (a) investigate a greater number of core diameters than is currently available, and to (b) test the hypothesis posed by the community that <10 nm core diameter NPs are more toxic. The developmental zebrafish assay provided sensitive and timely readouts of NP structure–bioactivity relationships in small volume (100 µL) assays in only 5 days. Additionally, this powerful model can develop normally in water from 0 to 5 days, reducing confounding factors such as aggregation and interactions with solution ions.
Precision synthesis of gold nanoparticles to interrogate the influence of size on toxicity
Numerous investigations have produced conflicting results on whether nanoparticle toxicity is dependent on size, surface charge, surface coating and surface functionalization (Alkilany and Murphy Citation2010; Dykman and Khlebtsov Citation2012; Fratoddi et al. Citation2015, Jia et al. Citation2017; Johnston et al. Citation2010; Khlebtsov and Dykman Citation2011). Although it is accepted that nanoparticle toxicity is strongly dependent on core diameter, in most studies, size variance is accomplished by changing either the chemical composition, surface charge or ligand structure, obscuring the effect of size on toxicity. To specifically elucidate the role of nanoparticle core diameter on toxicity, we synthesized a series of gold nanoparticles with five core diameters (0.8, 0.9, 1.3, 1.7, 5.8 nm) (), functionalized with TMAT (), a toxic ligand with bioactivity apparently modulated by NP core diameter (Harper et al. Citation2011; Schaeublin et al. Citation2011).
Figure 1. Characterization of TMAT-AuNPs with varying core sizes. (A) Gel electrophoresis with relative core sizes diagram. Arrow illustrates particle movement in the electric field, where the smaller particles move faster. (B) N,N,N-trimethylammoniumethanethiol (TMAT) Ligand Structure (C) UV-Visible spectra at concentration 50 mg/L: 0.8 nm (purple); 0.9 nm (brown); 1.3 nm (blue); 1.7 nm (red); 5.8 nm (green).
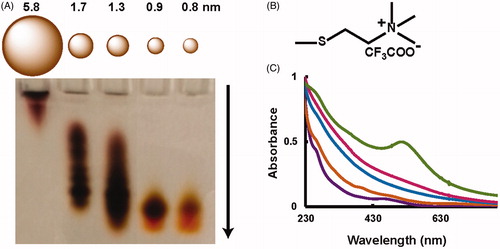
UV-Vis spectra for all particles are shown in . Each cluster size had a unique optical absorbance spectra corresponding to reported spectra for these clusters (Negishi, Nobusada and Tsukuda Citation2005; Woehrle, Brown and Hutchison Citation2005). The molar extinction coefficient (at 515 nm) increased as a function of increasing core diameter of the nanoparticles. TMAT-AuNP core diameters were determined with SAXS in ultrapure water (Figure S1B). TEM was used to further confirm the particle core diameter and shape (Figure S2). The core diameter results were in good agreement across methods. All TMAT-AuNPs had high purity as shown by proton NMR (Figure S3).
Figure 2. Developmental toxicity of varying core sizes based on mass concentration. Embryonic zebrafish were exposed to five AuNPs at varying mass per volume concentrations in the wells (the major x-axis is the log10 of the concentration in μg/mL); x minor axis shows the actual concentrations). The portion of animals exhibiting any endpoint is plotted on the y-axis. A total of 36 animals were exposed per concentration, with 22 morbidity and mortality endpoints assessed. A logistic regression model was fit to the log of each AuNP data (different color lines). The different colors corresponds to the difference core diameters..
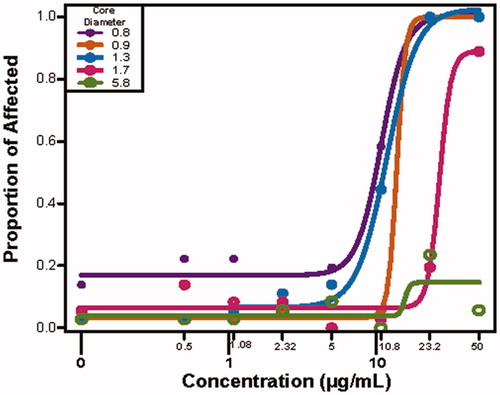
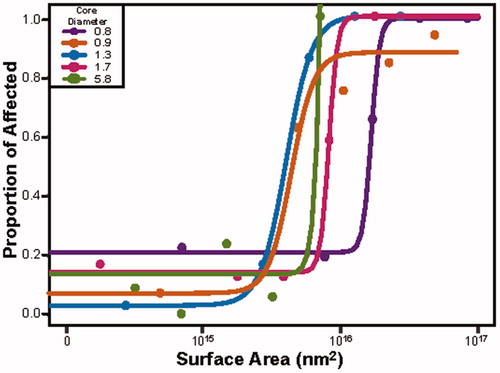
Figure 3. The developmental toxicity profile for the five narrowly spaced TMAT-AuNP when the exposure medium is expressed in surface area (nm2). The proportion of affected animals are plotted for each different core diameter and a curve of best fit is applied. The y-axis is the proportion of affected animals for any endpoint, and the x-axis the log10 transformed surface area of the different diameter AuNPs.
Additional analysis of the core diameter was carried out for the smallest sized AuNPs. The use of TEM to analyze the NP size distribution requires that the nanoparticles be differentiated from the background of each image during data analysis. This process is challenging for small gold clusters that have less contrast, thus requiring more image processing (Woehrle et al. Citation2006). Image thresholding techniques employed during TEM data analysis can bias the calculated core diameter for uniform nanoparticle samples (Cervera Gontard, Ozkaya and Dunin-Borkowski Citation2011; Woehrle et al. Citation2006), making it challenging to differentiate 0.8 nm (11 gold atoms) vs. 0.9 nm (25 gold atoms). The small difference in scattering cross-sections for 0.8 nm and 0.9 nm NPs also makes it challenging to differentiate these sizes using SAXS patterns. Therefore, we corroborated our SAXS and TEM data using polyacrylamide gel electrophoresis (PAGE) (Hanauer et al. Citation2007; Oh et al. Citation2010) to separate the highly colored, positively charged nanoparticles and visually determine their relative sizes. In previous studies that used PAGE to separate positively charged particles, the nanoparticles were converted to a negative charge by either ligand exchange (Xu et al. Citation2007) or coating with sodium dodecyl sulfate. In this work, we established a protocol to separate small positively charged nanoparticles without using surfactants or ligand exchange.
Using PAGE, we found the smallest TMAT-AuNPs, which should have the largest charge:mass ratio traveled the farthest through the gel. The largest diameter TMAT-AuNPs, which should have the smallest charge:mass ratio, traveled the least distance (). While each sample of TMAT-AuNPs contained a distribution of sizes, the most intense band in the gel corresponded to the color previously reported for that size of AuNPs. For example, the fastest moving band was predominantly bright orange, characteristic of smallest clusters (McKenzie, Zaikova and Hutchison, Citation2014), and the slowest moving band was red, characteristic of AuNPs larger than 2 nm (Fink et al. Citation1998; Frens, Citation1973). These differences in optical absorbance were also observed in UV-visible spectra (). PAGE confirmed that our samples represented distinct sizes of nanoparticles despite small differences in their mean diameters, and allowed us to obtain more precise information regarding the influence of core diameter on toxicity. Because three different analysis methods indicated that the 0.8 and 0.9 nm samples contained distinct populations of nanoparticles, we examined their toxicity separately.
With the PAGE, SAXS and TEM characterization data corroborating one another, we were confident that our syntheses had minimal core diameter variation from the targeted diameters. Prior to assessing the toxicity of the particles, the stabilities of all five TMAT-AuNPs were studied in ultrapure water under the zebrafish testing conditions using UV-Vis absorption spectroscopy. All particles in ultrapure water remained stable for the duration of the toxicity assessment experiments (Figure S1A). In addition to evaluating TMAT-AuNP stability in ultrapure water, we evaluated stability in standard zebrafish exposure medium (embryo medium) in which we found that all of the particles were stable except for the 5.8 nm TMAT-AuNPs (Figure S1C). The instability of 5.8 nm TMAT-AuNP in embryo medium suggested that similar efforts in another system with a more rigid requirement for higher ionic strength medium than ultrapure water, such as cell culture medium, would have precipitated this TMAT-AuNP, dramatically reducing its bioavailability.
Assessing the bioactivity of the five TMAT-AuNPs
During organogenesis, the embryonic zebrafish develops normally in ultrapure water through five days post-fertilization (Truong et al. Citation2012). The standard exposure metric uses mass per volume such as µg/mL to express the targeted concentration in the exposure medium. We exposed zebrafish embryos to eight mass per volume water concentrations: 0, 0.5, 1.08, 2.32, 5, 10.8, 23.2, and 50 µg/mL. For each exposure concentration, 36 zebrafish where exposed in individual wells of 96-well plates. The embryos were statically exposed from 6 to 120 h post fertilization (hpf) in 100 µL of water and kept in the dark throughout the study. At these concentrations, embryos were evaluated for presence/absence of abnormality in 22 endpoints at 24 and 120 hpf. For each measured endpoint, the lowest effect level (LEL) was calculated relative to the endpoint-matched control incidence. The TMAT-AuNPs with the smallest core diameter (0.8 nm) had a LEL of 10.8 µg/mL, while the largest core diameter (5.8 nm) did not significantly affect any individuals compared to the controls (Figure S4). Four of the five TMAT-AuNPs induced a concentration-response trend (). The smallest core diameter (0.8 nm) was the most bioactive, associated with adverse effects (abnormality in any of the 22 endpoints) in 100% of the exposed population. Smaller particles are typically more reactive owing to oxygen radical generation due to highly reactive undercoordinated metal sites and higher surface:volume ratio (Nel, Xia, Mädler and Li, Citation2006, Shang, Nienhaus and Nienhaus, Citation2014). Nanoparticles can distribute widely, however, as their diameter increases, their biodistribution can be hindered both in vitro and in vivo (Huang et al. Citation2012). Exposure to 0.9 and 1.3 nm TMAT-AuNPs resulted in similar concentration-response curves. Less bioactivity was associated with the 1.7 nm TMAT-AuNP relative to the smaller diameters, and no bioactivity was associated with the 5.8 nm TMAT-AuNP ().
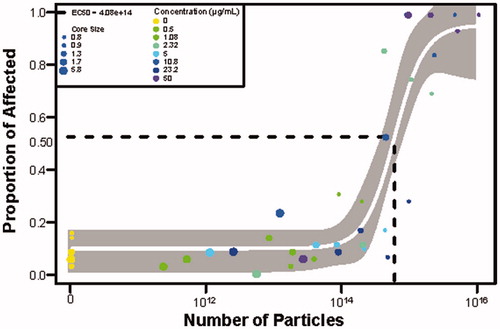
Figure 4. Toxicity evaluated amongst all core sizes based on the number of particles. A model is fit to all the TMAT-AuNP data with the varying color representing different mass concentrations. The size of the dot represents the core size of the particle. An effective concentration that resulted in 50% effect (EC50) is depicted with the dotted line. The 95% confidence interval of the fitted model is illustrated in gray, with the white line representing the predicated logistic model curve. The x-axis is the number of particles per mL, while the y-axis is the proportion of affected individuals when exposed to TMAT-AuNPs.
The TMAT-AuNP concentration-response trends we observed in the developmental zebrafish are consistent with the general consensus in the literature that smaller core diameter is more toxic in a range of sizes, regardless of the NP core composition and surface chemistry (Fratoddi et al. Citation2015; He et al. Citation2010; Jiang, Oberdörster and Biswas, Citation2009; Pan et al. Citation2007). Our results suggest that smaller particles are more toxic than the larger ones when using the common exposure metric (equal mass or mass/volume).
Modeling the influence of physicochemical properties on nanoparticle toxicity
Numerous material properties can be attributed to the surface properties of NPs. It may be more appropriate to use these properties to determine whether a size relationship exists (Pompa et al. Citation2011). We began by calculating the surface area for each core diameter. Next, we determined the total surface area for each size in the mass-based exposures (across the five exposure concentrations, , Supplemental Tables 1 and 2). For example, at 50 µg/mL, the 0.8 nm diameter had the largest total surface area of 8 × 10¹⁶ nm2, while the total surface area of 5.8 nm TMAT-AuNPs was 3 × 10¹⁵ nm2. Thus, at this concentration, there is a 26-fold increase in surface area in solutions containing the smallest versus the largest core diameters (, Supplemental Table 2). Evaluation of the toxicity profiles for the TMAT-AuNPs revealed different levels of bioactivity across the 22 endpoints. For all but the 5.8 nm TMAT-AuNP, as surface area increased, the proportion of affected animals also increased. As the surface area increases, there are more catalytic sites for reactions to occur (Teeguarden et al. Citation2007).
There are a number of possible hypotheses to explain how the surface area could play a role in the observed differential toxicity. One hypothesis is that there is a positive correlation between the surface area and the available surface for chemical/biological reactivity to occur, therefore leading to the generation of reactive oxygen species (ROS) that leads to toxicity. Overproduction of ROS can induce oxidative DNA damage, unregulated cell signaling, cytotoxicity and apoptosis (Fu et al. Citation2014; Manke, Wang and Rojanasakul Citation2013). For this suite of TMAT-AuNPs, no toxicity was observed at the largest core diameter, which is likely due to the number of catalytic sites (i.e. ligands) available on the TMAT-AuNP to interact with the biological system. For the smaller core diameters, it is possible that once a catalytic site is activated, there is a cascade effect, resulting in the activation of multiple other signaling cascades leading to ROS-mediate damage. This damage is then observed as a rapid onset of mortality at 24 hpf in the developing zebrafish. These findings confirm that toxicity observed when the exposure medium is expressed as surface area or the number of ligands on an NP are highly correlated with what is observed when the exposure metric is mass (data not shown). When the exposure metric was converted from mass/vol. concentration to number of particles, it revealed that in an exposure well, the number of particles ranges from 1011 to 1015/mL (Supplemental Table 2). shows that the number of affected individuals increases as the particle number increases. A Hill model estimated that the number of particles necessary to affect 50% of the animals, regardless of core diameter, (EC50) was 4.08 × 10¹⁴/mL. For particle numbers greater than 4.08 × 10¹⁴/mL, it is worth noting there is an increase in number of affected individuals, but also the core diameters of the particles were all under 1.3 nm. The three exposure metrics, concentration, surface area and number of particles, similarly suggested that particles <1.7 nm were developmentally toxic. Based on particle number alone in the exposure medium, only the 0.8 and 0.9 nm core diameters caused developmental toxicity in concentrations greater than 2.32 µg/mL while for the 1.3 nm core diameters, no toxicity was observed until 50 µg/mL. The use of different exposure metrics significantly changed the size-dependent toxicity relationship.
The utility of the gold nanoparticles for controlling particle number
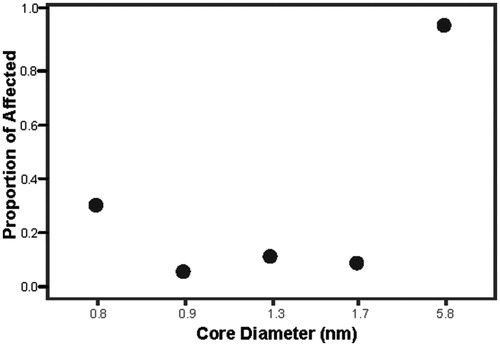
An advantage of synthesizing TMAT-AuNPs with high precision and in a narrow diameter range is that it becomes possible to precisely and deliberately control the number of NPs in the experiment. In this size range, it is possible to hold the particle number constant across the range of core diameters (by varying the mass concentration). To date, no other study has evaluated the same number of particles across core size ranges less than 10 nm. To achieve 6.71 × 10¹³ per mL of particles for each core diameter, embryos were exposed 161.9 µg/mL of the largest core diameter (5.8 nm; the highest exposure concentration) while the same number of particles in the 0.8 nm core exposures equaled 0.5 µg/mL. Under this regimen, the 5.8 nm core diameter was the most bioactive, with severe mortality at 24 hpf, while the remaining four smaller core diameter exposures did not cause significant morphological defects, which can be summarized by the proportion of affected individuals of any of the 22 endpoints where the largest core diameter has 100% of the population affected (highest bioactivity; ).
Figure 5. Toxicity profile at a constant number of particles, regardless of core size. Embryos were exposed to a constant number of TMAT-AuNPs (6.71 × 10¹³ per mL) for all five core sizes. These exposure scenarios were achieved by varying masses used per volume. For each core diameter, the proportion of affected individuals for any morphological endpoint is the y-axis. The data represents n = 32 for each TMAT-AuNP.
Differential body burdens did not govern TMAT-AuNP toxicity differences
To identify a possible explanation for the toxicity differences between the largest and the smallest cores when the number of particles in the exposure medium was held constant, we measured the amount of gold taken up by the exposed embryos. Exposure mass/volume concentration was reduced by 50% for each core diameter from the previous experiment to avoid embryonic mortality at the time of sample collection. Embryos at each core diameter were thus exposed from 6–24 hpf to a uniform 3.3 × 10¹³ particles per mL and gold content in the embryos () was measured at 24 hpf. For the particles with core diameters less than 1 nm (0.8, and 0.9 nm, respectively), the number of particles measured in the embryos was 2.7 ± 0.62 × 10¹⁰ and 1.6 ± 0.44 × 10¹⁰, respectively. While the other particles (1.3, 1.7 and 5.8 nm) had 2.1 ± 0.44, 4.7 ± 0.45, and 3.0 ± 0.35 x 10¹⁰ particles internally, respectively. There were no significant differences in resulting gold body burden when an uptake ratio was computed (normalized to number of particles in the embryos and in the exposure medium); the particle uptake ratio for core diameters was between 2.8 and 3.3. In previous uptake experiments, AuNPs functionalized with an uncharged ligand 2-(2-(2-mercaptoethoxy)ethoxy)ethanol (MEEE) were preferentially taken up by zebrafish compared to TMAT-AuNPs, even though exposure to TMAT-AuNP caused adverse effects, while the MEEE-AuNPs were not overtly toxic (Harper et al. Citation2011). In cells, Gu et al. observed exposure of 3.7 nm AuNP were not toxic even though the researchers observed the particles penetrating into the nucleus of the cell (Gu et al. Citation2009). Therefore, biological uptake is an important parameter, but alone is insufficient to understand particle toxicity.
Table 1. Number of particles measured in 24 hpf zebrafish embryos exposed to 3.3 × 10¹³ per mL AuNP for five core diameters.
Conclusions
By harnessing the power of precision core diameter particle synthesis, new characterization methods, and a multi-dimensional whole animal testing platform, we demonstrated that smaller core diameter at a given mass/volume concentration was not the sole toxicity driver. Instead, the toxic response correlated well with the nanoparticle surface area. Higher surface area in the exposure medium increases the catalytically active sites on the AuNPs and exposes more of the surface ligands. In this system, it is possible to conduct exposures for each size wherein the number of particles is held constant. For exposures for the same number of particles per volume, the largest diameter AuNPs were the most toxic.
These findings provide a new perspective on the importance of precision synthesis and characterization to accurately assess and fully understand nanomaterial structure-activity relationships. Although a constant mass metric is valuable for comparing toxicity in practical applications, a greater understanding of the impacts of nanomaterials is possible by considering the role of surface area and the toxicity on a per particle basis. Further, these results suggest the important role of the nanoparticle surface chemistry in generating a toxic response. In this regard, reduction of surface area and/or improved surface passivation may be useful strategies to reduce nanoparticle toxicity.
Acknowledgments
The authors would like to acknowledge the staff and Jane LaDu of the Sinnhuber Aquatic Research Laboratory for the zebrafish culture and technical assistance. We greatly acknowledge the CAMCOR facility (especially Josh Razink for TEM images), which is supported by grants from the W.M. Keck Foundation, the M.J. Murdock Charitable Trust, the Oregon Nanoscience and Microtechnologies Institute, and the University of Oregon
Disclosure statement
No potential conflict of interest was reported by the authors.
Additional information
Funding
References
- Albanese, A., P. S. Tang, and W. C. W. Chan. 2012. “The Effect of Nanoparticle Size, Shape, and Surface Chemistry on Biological Systems.” Annual Review of Biomedical Engineering 14 (1): 1–16. doi:10.1146/annurev-bioeng-071811-150124.
- Alkilany, A. M., and C. J. Murphy. 2010. “Toxicity and Cellular Uptake of Gold Nanoparticles: what we Have Learned so Far?.” Journal of Nanoparticle Research : An Interdisciplinary Forum for Nanoscale Science and Technology 12 (7): 2313–2333. doi:10.1007/s11051-010-9911-8.
- Auffan, M., J. Rose, J.-Y. Bottero, G. V. Lowry, J.-P. Jolivet, and M. R. Wiesner. 2009. “Towards a Definition of Inorganic Nanoparticles from an Environmental, Health and Safety Perspective.” Nature Nanotechnology 4 (10): 634. doi:10.1038/nnano.2009.242.
- Barton, C. L., E. W. Johnson, R. L. Tanguay. 2016. “Facility Design and Health Management Program at the Sinnhuber Aquatic Research Laboratory.” Zebrafish 13: S39–S43.
- Boisselier, E., and D. Astruc. 2009. “Gold Nanoparticles in Nanomedicine: preparations, Imaging, Diagnostics, Therapies and Toxicity.” Chemical Society Reviews 38 (6): 1759–1782. doi:10.1039/b806051g.
- Buzea, C., I. I. Pacheco, and K. Robbie. 2007. “Nanomaterials and Nanoparticles: Sources and Toxicity.” Biointerphases 2 (4): MR17–MR71.
- Cervera Gontard, L., D. Ozkaya, and R. E. Dunin-Borkowski. 2011. “A Simple Algorithm for Measuring Particle Size Distributions on an Uneven Background from TEM Images.” Ultramicroscopy 111 (2): 101–106. doi:10.1016/j.ultramic.2010.10.011.
- Chompoosor, A., K. Saha, P. S. Ghosh, D. J. Macarthy, O. R. Miranda, Z.-J. Zhu, K. F. Arcaro., V. M. Rotello. 2010. “The Role of Surface Functionality on Acute Cytotoxicity, ROS Generation and DNA Damage by Cationic Gold Nanoparticles.” Small (Weinheim an Der Bergstrasse, Germany) 6 (20): 2246–2249. doi:10.1002/smll.201000463.
- Dykman, L., and N. Khlebtsov. 2012. “Gold Nanoparticles in Biomedical Applications: Recent Advances and Perspectives.” Chemical Society Reviews 41 (6): 2256–2282. doi:10.1039/c1cs15166e.
- Fink, J., C. J. Kiely, D. Bethell, D. J. Schiffrin. 1998. “Self-Organization of Nanosized Gold Particles.” Chemistry of Materials 10: 922–926. doi:10.1021/cm970702w.
- Fratoddi, I., I. Venditti, C. Cametti, and M. V. Russo. 2015. “How Toxic Are Gold Nanoparticles? The State-of-the-Art.” Nano Research 8 (6): 1771–1799. doi:10.1007/s12274-014-0697-3.
- Frens, G. 1973. “Controlled Nucleation for the Regulation of the Particle Size in Monodisperse Gold Suspensions.” Nature Physical Science 241 (105): 20. doi:10.1038/physci241020a0.
- Fu, P. P., Q. Xia, H.-M. Hwang, P. C. Ray, and H. Yu. 2014. “Mechanisms of Nanotoxicity: generation of Reactive Oxygen Species.” Journal of Food and Drug Analysis 22 (1): 64–75. doi:10.1016/j.jfda.2014.01.005.
- Gu, Y. J., J. Cheng, C. C. Lin, Y. W. Lam, S. H. Cheng, and W.-T. Wong. 2009. “Nuclear Penetration of Surface Functionalized Gold Nanoparticles.” Toxicology and Applied Pharmacology 237 (2): 196–204. doi:10.1016/j.taap.2009.03.009.
- Hanauer, M., S. Pierrat, I. Zins, A. Lotz, and C. Sönnichsen. 2007. “Separation of Nanoparticles by Gel Electrophoresis according to Size and Shape.” Nano Letters 7 (9): 2881–2885. doi:10.1021/nl071615y.
- Harper, S. L., J. L. Carriere, J. M. Miller, J. E. Hutchison, B. L. S. Maddux, R. L. Tanguay. 2011. “Systematic Evaluation of Nanomaterial Toxicity: Utility of Standardized Materials and Rapid Assays.” ACS Nano 5: 4688–4697. doi:10.1021/nn200546k.
- He, C., Y. Hu, L. Yin, C. Tang, C. Yin. 2010. “Effects of Particle Size and Surface Charge on Cellular Uptake and Biodistribution of Polymeric Nanoparticles.” Biomaterials 31: 3657–3666. doi:10.1016/j.biomaterials.2010.01.065.
- Hirn, S., M. Semmler-Behnke, C. Schleh, A. Wenk, J. Lipka, M. Schäffler, S. Takenaka., W. Moller, G. Schmid, U. Simon, et al. 2011. “Particle Size-Dependent and Surface Charge-Dependent Biodistribution of Gold Nanoparticles after Intravenous Administration.” European Journal of Pharmaceutics and Biopharmaceutics : Official Journal of Arbeitsgemeinschaft Fur Pharmazeutische Verfahrenstechnik e.V 77 (3):407–416. doi:10.1016/j.ejpb.2010.12.029.
- Huang, K., H. Ma, J. Liu, S. Huo, A. Kumar, T. Wei, X. Zhang., S. Jin., Y. Gan., P.C. Wang., et al. 2012. “Size-Dependent Localization and Penetration of Ultrasmall Gold Nanoparticles in Cancer Cells, Multicellular Spheroids, and Tumors in Vivo.” ACS Nano 6 (5): 4483–4493. doi:10.1021/nn301282m.
- Ilavsky, J., and P. R. Jemian. 2009. “Irena: Tool Suite for Modeling and Analysis of Small-Angle Scattering.” Journal of Applied Crystallography 42 (2): 347–353. doi:10.1107/S0021889809002222.
- Jia, Y.-P., B-Y. Ma , X-W. Wei, Z-Y. Qian. 2017. “The in Vitro and in Vivo Toxicity of Gold Nanoparticles.” Chinese Chemical Letters. 28 (4): 691–702.
- Jiang, J.,. G. Oberdörster, and P. Biswas. 2009. “Characterization of Size, Surface Charge, and Agglomeration State of Nanoparticle Dispersions for Toxicological Studies.” Journal of Nanoparticle Research 11 (1): 77–89. doi:10.1007/s11051-008-9446-4.
- Johnston, H. J., G. Hutchison, F. M. Christensen, S. Peters, S. Hankin, and V. Stone. 2010. “A Review of the in Vivo and in Vitro Toxicity of Silver and Gold Particulates: particle Attributes and Biological Mechanisms Responsible for the Observed Toxicity.” Critical Reviews in Toxicology 40 (4):328–346. doi:10.3109/10408440903453074.
- Joris, F., B. B. Manshian, K. Peynshaert, S. C. De Smedt, K. Braeckmans, and S. J. Soenen. 2013. “Assessing Nanoparticle Toxicity in Cell-Based Assays: influence of Cell Culture Parameters and Optimized Models for Bridging the in Vitro–in Vivo Gap.” Chemical Society Reviews 42 (21): 8339–8359. doi:10.1039/c3cs60145e.
- Kearns, G. J. 2007. “Engineering Interfaces at the Micro-and Nanoscale for Biomolecular and Nanoparticle Self-Assembled Devices.” University of Oregon.
- Khan, I., S. Saeed, and I. Khan. 2017. “Nanoparticles: Properties, Applications and Toxicities.” Arabian Journal of Chemistry. https://doi.org/10.1016/j.arabjc.2017.05.011
- Khlebtsov, N., and L. Dykman. 2011. “Biodistribution and Toxicity of Engineered Gold Nanoparticles: A Review of in Vitro and in Vivo Studies.” Chemical Society Reviews 40 (3):1647–1671. doi:10.1039/c0cs00018c.
- Kim, K. T., and R. L. Tanguay. 2014. “The Role of Chorion on Toxicity of Silver Nanoparticles in the Embryonic Zebrafish Assay.” Environmental Health and Toxicology 29: e2014021. doi:10.5620/eht.e2014021.
- Kim, K. T., T. Zaikova, J. E. Hutchison, and R. L. Tanguay. 2013. “Gold Nanoparticles Disrupt Zebrafish Eye Development and Pigmentation.” Toxicological Sciences: An Official Journal of the Society of Toxicology 133 (2): 275–288. doi:10.1093/toxsci/kft081.
- Kimmel, C. B., W. W. Ballard, S. R. Kimmel, B. Ullmann, and T. F. Schilling. 1995. “Stages of Embryonic Development of the Zebrafish.” Developmental Dynamics 203 (3): 253–310. doi:10.1002/aja.1002030302.
- Kittler, S., C. Greulich, J. Diendorf, M. KöLler, and M. Epple. 2010. “Toxicity of Silver Nanoparticles Increases during Storage Because of Slow Dissolution under Release of Silver Ions.” Chemistry of Materials 22 (16): 4548–4554. doi:10.1021/cm100023p.
- Kunzmann, A., Andersson, B., Thurnherr, T., Krug, H, Scheynius, A, Fadeel, B. 2011. “Toxicology of Engineered Nanomaterials: focus on Biocompatibility, Biodistribution and Biodegradation.” Biochim Biophys Acta 1810: 361–373. doi:10.1016/j.bbagen.2010.04.007.
- Lai, D. Y. 2015. “Approach to Using Mechanism-Based Structure Activity Relationship (SAR) Analysis to Assess Human Health Hazard Potential of Nanomaterials.” Food and Chemical Toxicology 85: 120–126. doi:10.1016/j.fct.2015.06.008.
- Lewinski, N., V. Colvin, and R. Drezek. 2008. “Cytotoxicity of Nanoparticles.” Small (Weinheim an Der Bergstrasse, Germany) 4 (1): 26–49. doi:10.1002/smll.200700595.
- Mandrell, D., L. Truong, C. Jephson, M. R. Sarker, A. Moore, C. Lang, M. T. Simonich., R. L. Tanguay. 2012. “Automated Zebrafish Chorion Removal and Single Embryo Placement: Optimizing Throughput of Zebrafish Developmental Toxicity Screens.” Journal of Laboratory Automation 17 (1):66–74. doi:10.1177/2211068211432197.
- Manke, A., L. Wang, and Y. Rojanasakul. 2013. “Mechanisms of Nanoparticle-Induced Oxidative Stress and Toxicity.” Biomed Research International 2013: 942916. doi:10.1155/2013/942916.
- McKenzie, L. C., T. O. Zaikova, and J. E. Hutchison. 2014. “Structurally Similar Triphenylphosphine-Stabilized Undecagolds, Au11(PPh3)7Cl3 and [Au11(PPh3)8Cl2]Cl, Exhibit Distinct Ligand Exchange Pathways with Glutathione.” Journal of the American Chemical Society 136 (38): 13426–13435. doi:10.1021/ja5075689.
- Mu, Q., Jiang, G., Chen, L., Zhou, H., Fourches, D., Tropsha, A., and Yan, B. 2014. “Chemical Basis of Interactions between Engineered Nanoparticles and Biological Systems.” Chemical Reviews 114 (15): 7740–7781. doi:10.1021/cr400295a.
- Murph, S. E. H., G. K., Larsen, K. J. Coopersmith. 2017. Anisotropic and Shape-Selective Nanomaterials: Structure-Property Relationships. Springer: New York City, New York.
- Negishi, Y., K. Nobusada, and T. Tsukuda. 2005. “Glutathione-Protected Gold Clusters Revisited: Bridging the Gap between Gold (I)− Thiolate Complexes and Thiolate-Protected Gold Nanocrystals.” Journal of the American Chemical Society 127 (14): 5261–5270. doi:10.1021/ja042218h.
- Nel, A., T. Xia, L. Mädler, and N. Li. 2006. “Toxic Potential of Materials at the Nanolevel.” Science (New York, N.Y.) 311 (5761): 622–627. doi:10.1126/science.1114397.
- Oberdorster, G., A. Maynard, K. Donaldson, V. Castranova, J. Fitzpatrick, K. Ausman, J. Carter, B. Karn, W. Kreyling, D. Lai, et al. 2005. “Principles for Characterizing the Potential Human Health Effects from Exposure to Nanomaterials: Elements of a Screening Strategy.” Particle and Fibre Toxicology 2: 8.
- Oh, E., K. Susumu, R. Goswami, and H. Mattoussi. 2010. “One-Phase Synthesis of Water-Soluble Gold Nanoparticles with Control over Size and Surface Functionalities.” Langmuir 26 (10): 7604–7613. doi:10.1021/la904438s.
- Oksel, C., C. Y. Ma, J. J. Liu, T. Wilkins, and X. Z. Wang. 2015. “(Q) SAR Modelling of Nanomaterial Toxicity: A Critical Review.” Particuology 21: 1–19. doi:10.1016/j.partic.2014.12.001.
- Pan, Y., S. Neuss, A. Leifert, M. Fischler, F. Wen, U. Simon, G. Schmid., W. Brandau, W. Jahnen-Dechent. 2007. “Size-dependent cytotoxicity of gold nanoparticles.” Small (Weinheim an Der Bergstrasse, Germany) 3 (11): 1941–1949. doi:10.1002/smll.200700378.
- Pompa, P. P., G. Vecchio, A. Galeone, V. Brunetti, G. Maiorano, S. Sabella, R. Cingolani.. 2011. “Physical Assessment of Toxicology at Nanoscale: Nano Dose-Metrics and Toxicity Factor.” Nanoscale 3 (7): 2889–2897. doi:10.1039/c1nr10233h.
- R Core Team. 2016. R: A Language and Environment for Statistical Computing. Vienna, Austria: R Foundation for Statistical Computing.
- Ray, P. C., H. Yu, and P. P. Fu. 2009. “Toxicity and Environmental Risks of Nanomaterials: challenges and Future Needs.” Journal of Environmental Science and Health Part C Environmental Carcinogenesis and Ecotoxicology Reviews 27 (1): 1–35. doi:10.1080/10590500802708267.
- Richman, E. K., and J. E. Hutchison. 2009. “The Nanomaterial Characterization Bottleneck.” ACS Nano 3 (9): 2441–2446. doi:10.1021/nn901112p.
- Saha, K., S. S. Agasti, C. Kim, X. Li, and V. M. Rotello. 2012. “Gold Nanoparticles in Chemical and Biological Sensing.” Chemical Reviews 112 (5): 2739–2779. doi:10.1021/cr2001178.
- Saifi, M. A., W. Khan, and C. Godugu. 2018. “Cytotoxicity of Nanomaterials: Using Nanotoxicology to Address the Safety Concerns of Nanoparticles.” Pharmaceutical Nanotechnology 6 (1): 3–16. doi:10.2174/2211738505666171023152928.
- Schaeublin, N. M., L. K. Braydich-Stolle, A. M. Schrand, J. M. Miller, J. Hutchison, J. J. Schlager, S. M. Hussain., et al. 2011. “Surface Charge of Gold Nanoparticles Mediates Mechanism of Toxicity.” Nanoscale 3 (2): 410–420. doi:10.1039/c0nr00478b.
- Senut, M.-C., Y. Zhang, F. Liu, A. Sen, D. M. Ruden, and G. Mao. 2016. “Size‐Dependent Toxicity of Gold Nanoparticles on Human Embryonic Stem Cells and Their Neural Derivatives.” Small 12 (5): 631–646. doi:10.1002/smll.201502346.
- Shang, L., K. Nienhaus., G. U. Nienhaus. 2014. “Engineered Nanoparticles Interacting with Cells: size Matters.” Journal of Nanobiotechnology 12: 5. doi:10.1186/1477-3155-12-5.
- Sweeney, S. F., G. H. Woehrle, and J. E. Hutchison. 2006. “Rapid Purification and Size Separation of Gold Nanoparticles via Diafiltration.” Journal of the American Chemical Society 128 (10): 3190–3197. doi:10.1021/ja0558241.
- Tantra, R. 2016. Nanomaterial Characterization: An Introduction. New Jersey: John Wiley & Sons.
- Teeguarden, J. G., P. M. Hinderliter, G. Orr, B. D. Thrall, and J. G. Pounds. 2007. “Particokinetics in Vitro: dosimetry Considerations for in Vitro Nanoparticle Toxicity Assessments.” Toxicological Sciences 95 (2): 300–312. doi:10.1093/toxsci/kfl165.
- Truong, L., S. L. Harper, and R. L. Tanguay. 2011. “Evaluation of Embryotoxicity Using the Zebrafish Model.” In Drug Safety Evaluation: Methods and Protocols, edited by Jean-Charles Gautier, 271–279. Totowa, NJ: Springer.
- Truong, L., D. M. Reif, L. St Mary, M. C. Geier, H. D. Truong, and R. L. Tanguay. 2014. “Multidimensional in Vivo Hazard Assessment Using Zebrafish.” Toxicological Sciences : An Official Journal of the Society of Toxicology 137 (1):212–233. doi:10.1093/toxsci/kft235.
- Truong, L., S. C. Tilton, T. Zaikova, E. Richman, K. M. Waters, J. E. Hutchison, R. L. Tanguay. 2013. “Surface Functionalities of Gold Nanoparticles Impact Embryonic Gene Expression Responses.” Nanotoxicology 7 (2): 192–201. doi:10.3109/17435390.2011.648225.
- Truong, L., T. Zaikova, E. K. Richman, J. E. Hutchison, and R. L. Tanguay. 2012. “Media Ionic Strength Impacts Embryonic Responses to Engineered Nanoparticle Exposure.” Nanotoxicology 6 (7): 691–699. doi:10.3109/17435390.2011.604440.
- Truong, L., T. Zaikova, N. M. Schaeublin, K. Kim, S. M. Hussain, J. E. Hutchison, R. L. Tanguay. 2017. “Residual Weakly Bound Ligands Influence Biological Compatibility of Mixed Ligand Shell, Thiol-Stabilized Gold Nanoparticles.” Environmental Science: Nano 4: 1634–1646. doi:10.1039/C7EN00363C.
- Warner, M. G., and J. E. Hutchison. 2003. “Linear Assemblies of Nanoparticles Electrostatically Organized on DNA Scaffolds.” Nature Materials 2: 272–277. doi:10.1038/nmat853.
- Westerfield, M. 2007. The Zebrafish Book. A Guide for the Laboratory Use of Zebrafish (Danio rerio). Eugene, Oregon: University of Oregon Press.
- Woehrle, G. H., L. O. Brown, J. E. Hutchison. 2005. “Thiol-Functionalized, 1.5-nm Gold Nanoparticles through Ligand Exchange Reactions: scope and Mechanism of Ligand Exchange.” Journal of the American Chemical Society 127:2172–2183. doi:10.1021/ja0457718.
- Woehrle, G. H., J. E. Hutchison, S. Ozkar, R. G. Finke. 2006. “Analysis of Nanoparticle Transmission Electron Microscopy Data Using a Public- and Domain Image-Processing Program, Image.” Turkish Journal of Chemistry 30: 1–13.
- Xu, X., K. K. Caswell, E. Tucker, S. Kabisatpathy, K. L. Brodhacker, and W. A. Scrivens. 2007. “Size and Shape Separation of Gold Nanoparticles with Preparative Gel Electrophoresis.” Journal of Chromatography A 1167 (1): 35–41. doi:10.1016/j.chroma.2007.07.056.
- Yen, H. J., S. H. Hsu, and C. L. Tsai. 2009. “Cytotoxicity and Immunological Response of Gold and Silver Nanoparticles of Different Sizes.” Small 5: 1553–1561. doi:10.1002/smll.200900126.
- Zhang G., et al.. 2016. Aggregate entropy scoring for quantifying activity across endpoints with irregular correlation structure. Reprod Toxicol 62:92–99.