
Abstract
Nanoparticle-induced genotoxicity can arise through different mechanisms, and generally, primary and secondary genotoxicity can be distinguished where the secondary is driven by an inflammatory response. It is, however, yet unclear how a secondary genotoxicity can be detected using in vitro methods. The aim of this study was to investigate inflammation and genotoxicity caused by agglomerated nickel (Ni) and nickel oxide (NiO) nanoparticles and, furthermore, to explore the possibility to test secondary (inflammation-driven) genotoxicity in vitro. As a benchmark particle to compare with, we used crystalline silica (quartz). A proteome profiler antibody array was used to screen for changes in release of 105 different cytokines and the results showed an increased secretion of various cytokines including vascular endothelial growth factor (VEGF) following exposure of macrophages (differentiated THP-1 cells). Both Ni and NiO caused DNA damage (comet assay) following exposure of human bronchial epithelial cells (HBEC) and interestingly conditioned media (CM) from exposed macrophages also resulted in DNA damage (2- and 3-fold increase for Ni and NiO, respectively). Similar results were also found when using a co-culture system of macrophages and epithelial cells. In conclusion, this study shows that it is possible to detect a secondary genotoxicity in lung epithelial cells by using in vitro methods based on conditioned media or co-cultures. Further investigation is needed in order to find out what factors that are causing this secondary genotoxicity and whether such effects are caused by numerous nanoparticles.
Introduction
The commercial production and use of nanoparticles (NPs) is constantly increasing leading to a need to evaluate toxicity and health risks (Kessler Citation2011). One endpoint of high importance to assess due to the link to cancer is genotoxicity. Nanoparticle-induced genotoxicity can arise through different mechanisms, and generally, primary and secondary genotoxicities can be distinguished where the secondary is driven by an inflammatory response (Knaapen et al. Citation2004; Magdolenova et al. Citation2014). Primary genotoxicity means that the nanoparticles (and/or released species from these) have an inherent property to damage DNA, either through direct interaction with DNA or indirectly (e.g. via oxidative stress). Secondary genotoxicity, on the other hand, is caused by immune cells such as macrophages and neutrophils. These immune cells are recruited to clear the tissue from foreign particles and this can result in an event known as oxidative burst leading to release of reactive oxygen species (ROS) (Forman and Torres Citation2002; Evans et al. Citation2017). Cytokines and chemokines activate and recruit immune cells to sites of inflammation and are involved in the progression of inflammatory events (Feghali and Wright Citation1997). Furthermore, generation of ROS can trigger release of pro-inflammatory cytokines via activation of redox sensitive signaling pathways such as MAPK and NF-κB which are in control of transcription of inflammatory genes e.g. IL-1β, IL-8, and TNF-α (Thannickal and Fanburg Citation2000). Cytokines including IL-1β and TNF-α may furthermore lead to the assembly of nitric oxide synthase within epithelial cells (Green et al. Citation1994) generating intracellular nitric oxide (NO) that could be involved in causing DNA damage. Thus, the most likely mechanisms involved in secondary genotoxicity relate to ROS production via the oxidative burst or to intracellular NO production as a consequence of cytokine release, but additional yet unknown mechanisms may be of importance.
For some particles and fibers, such as crystalline silica (Borm, Fowler, and Kirkland Citation2018) and certain carbon nanotubes (Catalán et al. Citation2016), a secondary genotoxicity appears to be the most important genotoxicity mechanism as suggested by more pronounced DNA damage observed in vivo compared to in vitro assays when using monocultures. Although several studies have assessed either genotoxicity or inflammation by using in vitro assays, there is a lack of studies investigating secondary (inflammatory-driven) genotoxicity. Indeed, a significant knowledge gap relates to which in vitro system that might be appropriate for assessing inflammatory-driven genotoxicity (OECD Citation2014). Recently, Evans et al. (Citation2019) reported a secondary genotoxicity of superparamagnetic iron oxide nanoparticles (SPIONS) as detected by using both a conditioned media (CM) approach, i.e. exposing THP-1 derived macrophages and then transfer the medium (CM) to bronchial cells, as well as a co-culture model.
We assessed recently primary genotoxicity of nickel (Ni) and nickel oxide (NiO) NPs by using a range of assays including comet assay, micronucleus assay, analysis of chromosome aberration and a set of reporter cells (Akerlund et al. Citation2017; Di Bucchianico et al. Citation2018). In these studies, we showed an ability of these NPs to cause DNA damage in lung cells, results in line with other studies (Latvala et al. Citation2016; M'Bemba-Meka, Lemieux, and Chakrabarti Citation2005). Furthermore, inflammatory effects of NiO NPs have been shown both in vitro (Capasso, Camatini, and Gualtieri Citation2014) and in vivo (Nishi et al. Citation2009; Gillespie et al. Citation2010; Morimoto et al. Citation2010; Cao et al. Citation2016; Bai et al. Citation2017). Yet, no studies have elucidated whether NiO NP-induced inflammation can cause genotoxicity.
In this study, we tested the hypothesis that NiO NPs can cause both primary and secondary genotoxicity. To understand possible differences between the oxidic and metallic form, Ni NPs were also included in the study. Indeed, IARC has classified ‘nickel compounds’ (including NiO) as carcinogenic to humans (group 1) (IARC Citation2012) whereas Ni metal particles as possibly carcinogenic to human (group 2B) (IARC Citation1990), thus suggesting different hazards. The aim of this study was thus to investigate inflammation and genotoxicity caused by Ni and NiO NPs and furthermore to explore the possibility to test secondary (inflammation-driven) genotoxicity in vitro. As a benchmark particle to compare with, we used crystalline silica since the carcinogenic properties of this material is suggested to be inflammatory driven (Borm, Fowler, and Kirkland Citation2018). To test secondary genotoxicity, we used a similar approach as Evans et al. (Citation2019) and, thus, employed a conditioned media approach as well as a co-culture model. In the conditioned media approach, we first exposed THP-1 derived macrophages to the particles. Next the particles were removed by centrifugation, and the medium (the conditioned medium) was then transferred to epithelial lung cells in which we studied genotoxic effects. Previous studies have used conditioned media approaches to study the effects of e.g. carbon nanotubes (Murphy et al. Citation2012), diesel exhaust particles (Shaw et al. Citation2011), and carbon black nanoparticles (Barlow et al. Citation2005), but studies focused on genotoxicity are rare.
Material and methods
Ni and NiO nanoparticles
Ni (<100 nm diameter, purity >99%, Cat#: 577995-5 G, 93397KJ) and NiO (<50 nm diameter, >99.8% purity, Cat# 637130-25 G, 17198PJ) NPs were purchased from Sigma-Aldrich (St. Louis, MO). Crystalline silica particles (Min-U-Sil 5) were purchased from U.S. SILICA Company (Katy, TX). All particles were dispersed in a 1:1 mixture between supplemented (see below) LHC-9 (Laboratory of Human Carcinogenesis-9) and RPMI 1640 (Roswell Park Memorial Institute 1640, Sigma-Aldrich, St. Louis, MO) at a total Ni concentration of 1 mg/ml (or 1 mg/ml silica) followed by sonication in a water bath (15 min, 20 °C, Elma, Transonic Digital, at power-level 5). The particle suspensions were then further diluted and added to the cells. The Ni and NiO NPs were carefully characterized in our previous studies and summarizes their BET-area, primary particle size, size in RPMI/LHC-9 medium and Ni-release in RPMI/LHC‐9 medium. The NiO were smaller than Ni, but both NPs were heavily agglomerated (>5 μm) in the serum-free cell culture medium used.
Table 1. Summary of NP characteristics; BET-area, primary particle size, size in RPMI/LHC-9 medium, and Ni-release in RPMI/LHC‐9 medium.
Cell culture
HBEC3-kt cells, originally from ATCC, were cultured at serum free conditions in 50% LHC-9 (Laboratory of Human Carcinogenesis-9) medium (Gibco, Carlsbad, CA) supplemented with 1% PEST and 50% RPMI (Roswell Park Memorial Institute, Buffalo, NY) medium (Sigma Aldrich, St. Louis, MO), supplemented with 1% l-glutamine (Gibco, Buffalo, NY; Thermo Fisher Scientific Inc., Waltham, MA) and 1% PEST (penicillin–streptomycin, Gibco, Buffalo, NY). The cells were cultured in a standard humidified incubator at 5% CO2, 37 °C, in T75 flasks pre-coated with 0.01% collagen (Type I, PureCol®, Advanced BioMatrix, Carlsbad, CA) and were sub cultured at 80–90% confluency.
Tamm-Horsfall Protein-1 (THP-1) cells were obtained from the ATCC (Manassas, VA) and were maintained in RPMI-1640 medium supplemented with 10% fetal bovine serum (FBS), 1% PEST and 1% l-glutamine. The cells were cultured in cell culture T75 cm2 flasks in a standard humidified incubator at 5% CO2 and 37 °C and sub cultured every 2–3 d. THP-1 cells were differentiated into macrophages (denoted THP-1*) with 5 ng/ml Phorbol 12-myristate 13-acetate (PMA) (Sigma, St. Louis, MO) for 48 h and were then washed twice with PBS before each experiment.
Conditioned media
THP-1 cells were seeded in cell culture medium containing PMA at a density of 2.5 × 10⁵ cells/1.2 ml (per well) in 12 well plates and left 48 h differentiation. THP-1* cells were then exposed to Ni, NiO, and SiO2 at a concentration of 50 µg/ml (15.8 μg Ni/cm2) (corresponding to total Ni concentration) for 3 or 18 h. Cell medium from unexposed cells was used as a negative control. Next, supernatants were collected and centrifuged at 13,400 rpm for 5 min. Supernatants were then used as conditioned medium (CM) to expose the HBEC cells for 3 and 18 h.
Transwell co-culture
THP-1 cells were seeded in cell culture medium containing PMA at a density of 1 × 10⁵ cells and a volume of 0.5 ml/well in the ThinCert (Greiner bio-one, Monroe, NC) insert (a pore size of 0.4 µm) placed in a 12-well plate and left 48 h for differentiation. HBEC cells were seeded in a density of 2.5 × 10⁵ cells in a volume of 1.2 ml/well in 12-well plates and left over night. Prior to exposure, the THP-1* cells were washed twice with PBS and the inserts were placed on top of the HBEC cells. THP-1* cells were then exposed to Ni, NiO and SiO2 at a concentration of 50 µg/ml (13.2 μg Ni/cm2) for 3 and 18 h. Unexposed cells were used as a negative control. The HBEC cells were then preceded for the comet assay.
Alamar blue assay
HBEC cells were seeded at a density of 1.0 × 10⁴ cells/well and THP-1* cells were seeded at a density of 2 × 10⁴ cells/well in 96 well plates in triplicates. Both cell types were exposed to Ni and NiO NPs corresponding to total Ni concentration of 5, 10, 25, and 50 µg/ml (1.6, 3.1, 7.8, and 15.6 μg Ni/cm2) for 3 h and 24 h in HBEC cell culture media. Cell culture medium was used as a negative control and Triton X-100 1% (Sigma-Aldrich, St. Louis, MO) was used as a positive control. After exposure, the suspensions were removed and the cells were incubated with 10% Alamar Blue (Invitrogen, Carlsbad, CA) for 2 h at 37 °C. A microplate reader (Tecan, San Jose CA, Infinite F 200, Software: Magellan 7.2) was used to read the fluorescence at 560 nm excitation and 590 nm emission. Background values (10% Alamar blue in cell culture medium) were subtracted from each well and the average fluorescent intensity for the triplicates was calculated and negative control was normalized to 100%. Experiments were repeated three times.
Proteome profiler antibody array
The presence of various pro inflammatory cytokines (3 h and 18 h exposure) and chemokines (3 h exposure) in CM was analyzed by using the Proteome Profiler™ Antibody Arrays. Samples from tree independent experiments were pooled for the analysis. Human XL Cytokine Array Kit (Catalog number: ARY022B, R&D Systems®, Inc., Minneapolis, MN) was used for cytokine analysis and Human Chemokine Array Kit (Catalog number: ARY017, R&D Systems®, Inc., Minneapolis, MN) and assays were performed according to the manufacturer’s protocol. Detection was performed using the chemiluminescent signal by using BIO-RAD’s ChemiDOC™ MP System (Hercules, CA). The mean pixel density of each point was calculated with ImageJ software (Bethesda, MD).
Multiplex assay
To confirm the increase of two selected cytokines, IL-1β and VEGF, Bio-Plex Pro Assays kit (Bio-Rad, Hercules, CA) was used with CM from 3 and 18 h exposure. The assay was performed according to the manufacturer’s instruction and analyzed by a Luminex® 100/200™ System (Luminex Corporation, Austin, TX). Samples from three independent experiments were analyzed.
Comet assay
The alkaline single cell comet assay was used to assess DNA damage in HBEC cells as previously described (Di Bucchianico et al. Citation2017). Cell culture medium was used as a negative control and 20 µM hydrogen peroxide (H2O2, Sigma-Aldrich, St. Louis, MO), 5 min exposure on ice, was used as a positive control. Cells were exposed to the (nano)particles or, in a control experiment to the ‘released fraction’ from NiO. This fraction was produced similar as the CM (18 h) but in the absence of cells in order to control for the role of Ni ions. HBEC cells were embedded into 0.75% agarose (Sigma-Aldrich, St. Louis, MO) and pipetted onto microscopic slides (pre-coated with 0.3% agarose). The slides were then placed in lysis buffer containing Triton X-100 (1%) on ice for 1 h to lyse the cells. Slides were thereafter placed in electrophoresis buffer for 40 min, to unwind DNA, and electrophoresis was then performed at 29 V for 30 min. The slides were neutralized, dried overnight, fixed (5 min in methanol) and then stained with a 1:10,000 dilution of SYBR Green (Life Technologies™, Carlsbad, CA) in Tris-acetate-EDTA (TAE) buffer at least 1 h before scoring. Scoring was blindly performed using a fluorescence microscope (Leica DMLB, Wetzlar, Germany) with the Comet Assay IV software (GraphPad Software, La Jolla, CA). 100 comets were scored from each sample. The DNA damage was measured as % of DNA in the tail. Experiments were repeated three times.
DCFH-DA assay
The 2′,7′-dichloro-rofluorescein diacetate (DCFH-DA) assay was used to measure both extracellular and total intracellular ROS production. To measure extracellular ROS production, 0.01 M sodium hydroxide (NaOH, Sigma-Aldrich, St. Louis, MO) was added to 25 µM DCFH-DA (Life Technoligies™, Carlsbad, CA) and incubated at 37 °C for 30 min to cleave the DA from DCFH-DA. After 30 minutes, to neutralize the reaction, Hanks Buffered Salt Solution (HBSS, Gibco® by Life Technoligies™, Renfrew, UK) was added. CM was then added to the solution. H2O2 was used as a positive control and HBEC cell medium used as background. To measure intracellular ROS production, 1 × 10⁴ HBEC cells were seeded per well in black and clear bottom 96-well plates (Corning Incorporated, Corning, NY) in triplicates for each exposure. HBEC cells were allowed to adhere for 24 h. Cells were then washed with 1x HBSS buffer and incubated with 25 µM DCFH-DA for 30 min at 37 °C in the dark. Cells were then exposed to CM (from Ni, NiO or SiO2 exposed macrophages) for 3 h. Cell culture medium was used as negative control and H2O2 was used as a positive control. For both intra- and extracellular ROS analysis, fluorescence was recorded every 5 min over 30 min by using a microplate reader (Tecan, San Jose CA, Infinite F 200, Software: Magellan 7.2) at 485 nm excitation and 535 nm emission at 37 °C. The average fluorescent intensity for the triplicate was calculated by subtracting background values. Experiments were repeated three times.
ICP-MS
The amount of released metals in CM was evaluated by inductively coupled plasma mass spectrometry (ICP-MS). NPs were separated using centrifugation at 13,400 rpm for 5 min. About 600 µl of the supernatant was digested using 900 µl of 67% HNO3 for at least 24 h. The digested supernatant was then further diluted in 1% HNO3 (final dilution 20). 58Ni and 60Ni isotopes were quantified using KED mode. Calibration standards at 1, 5, 10, 50, 100, and 500 ppb of Ni were prepared from a 1000 ppm stock in 1% HNO3. As an internal standard, all samples were spiked with 4.99 ppb indium (999 ± 5 µg/ml; Lot: F2-IN01094, Spectrascan, Teknolab AS, Norway) with a range of recovery between 100% and 108%. The mean values of isotopes were used and results were expressed as % of Ni release form initial concentration.
Statistical analysis
The data is presented as the mean ± standard error mean (SEM) of at least three independent experiments (n = 3). Statistical analyses were performed in GraphPad Prism 7 (GraphPad Software, La Jolla, CA) by one-way analysis of variance (ANOVA) with Dunnett’s test (compared all samples versus negative control). The level of statistical significant was indicated with asterisks (***p < 0.001, **p < 0.01, *p < 0.05) when p value is lower than 0.05.
Results
Exposure to agglomerated Ni and NiO NPs cause no or minor cytotoxicity in HBEC and THP-1* cells
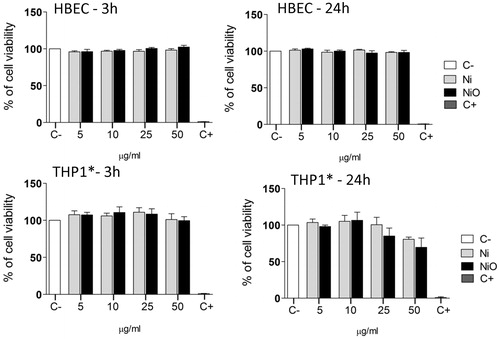
To initially test cytotoxicity in order to enable selection of proper concentrations, Alamar blue assay was employed. HBEC and THP-1* cells were exposed to Ni and NiO at different concentrations (5, 10, 25, and 50 µg/ml; 1.6, 3.1, 7.8, and 15.6 μg Ni/cm2) for 3 and 24 h, respectively. No distinct effect of cytotoxicity was observed for Ni and NiO NPs following exposure of HBEC cells (). For THP-1* cells, a slight decrease in cell viability (approx. 80% and 70% viability for Ni and NiO, respectively) was observed in the highest concentration (50 µg/ml) after 24 h, although the decrease was not statistically significant. The quartz (SiO2), used as a benchmark particle, caused no cytotoxicity in the HBEC cells but a statistically significant decreased cell viability (50% viability) was observed in the highest concentration (50 µg/ml) in the THP-1* cells (Supplementary Figure S1).
Figure 1. Cytotoxicity of Ni and NiO NPs following exposure of HBEC or THP1* cells for 3 or 24 h. Both cell types were exposed to Ni and NiO NPs corresponding to total Ni concentration of 5, 10, 25 and 50 µg/ml (1.6, 3.1, 7.8, and 15.6 μg Ni/cm2) for 3 h and 24 h in HBEC cell culture media. The bars show mean ± SEM.
Exposure to agglomerated Ni and NiO NPs induce cytokine release in THP-1* cells
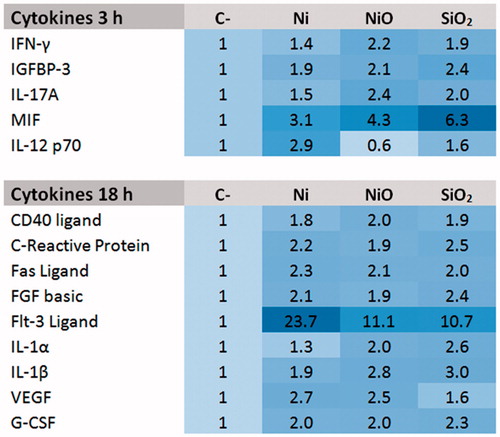
Next, we used a proteome profiler antibody array to screen for changes in release of 105 different cytokines (after 3 and 18 h) and 31 chemokines (after 3 h) following exposure of THP-1* cells to 50 µg/ml Ni and NiO. Quartz (SiO2, 50 µg/ml) was included as a benchmark particle. The figure heat map () shows the cytokines that were present in the CM at 2-fold higher concentration, or more, compared to the control in either Ni or NiO NPs CM. It should be noted that smaller changes (not reaching the 2-fold cut off) could be of importance and the whole data set is shown in Supplement Figure S2. The results show that Ni and NiO NPs increased the release of the following cytokines after 3 h exposure; MIF, IFN-γ, IGFBP-3, IL-17A, and IL-12p70. No increased release (based on 2-fold cut-off) was observed for the chemokines except from ENA-78 following NiO NPs exposure (see Supplementary material Figure S2). After 18 h exposure, the release of the following cytokines was increased: CD40 Ligand, C-Reactive Protein, Fas Ligand, FGF basic, Flt-3 Ligand, IL-1α, IL-1β, VEGF, and G-CSF. In general, the trend was similar for Ni and NiO as well as for the SiO2 benchmark particle. One exception was VEGF showing an increase for Ni and NiO but not for SiO2. Furthermore, some cytokines were specific for SiO2 including IL-17A, IP10, and MCP1 (see Supplementary material Figure S3).
Figure 2. Cytokine release following 3 h or 24 h exposure of THP1* cells to 50 µg/ml (corresponding to total Ni concentration, 15.8 μg Ni/cm2) Ni NPs, NiO NPs or SiO2 (quartz).
Increased release of VEGF was confirmed by Luminex
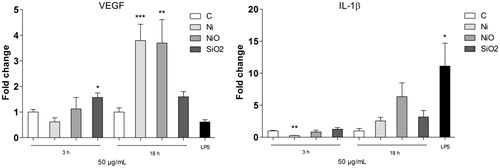
The secretion of two cytokines, VEGF and IL1β, as shown to be higher in the proteome profiler assay was next investigated by using Luminex. As shown in the screening assay, both Ni and NiO, but not SiO2, caused an increased secretion of VEGF after 18 h exposure of THP1* cells (). For IL-1β, showing an up-regulation in all the samples in the proteome profiler assay, a small but non-statistically significant increase was observed ().
Figure 3. Secretion of VEGF (left) or IL-1β following 18 h exposure of THP1* cells to 50 µg/ml (15.8 μg Ni/cm2) Ni NPs, NiO NPs or SiO2 (quartz). The bars show mean ± SEM and significant differences compared to the control are marked with asterisks (* for p-value < 0.05, ** for p-value < 0.01, *** for p-value < 0.001).
Conditioned media from THP1* cells exposed to agglomerated Ni and NiO NPs cause genotoxicity in HBEC cells
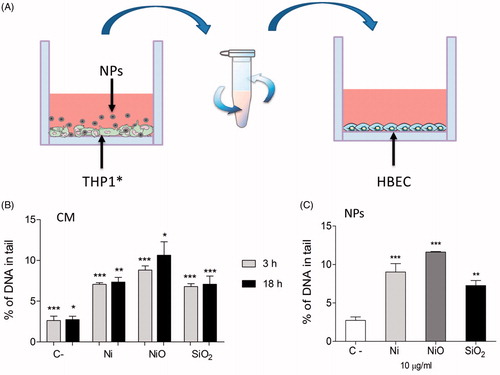
In order to investigate whether factors released from exposed macrophages can cause genotoxicity, the ability of CM to cause DNA damage was investigated by the alkaline comet assay. HBEC cells were exposed for 3 h to CM produced by exposure of THP-1* cells to 50 µg/ml of Ni, NiO and SiO2 NPs for 3 or 18 h, see . In addition, the genotoxic effect directly caused by the agglomerated NPs (Ni, NiO) and SiO2 was tested (10 µg/ml, 3 h), as well as the combined exposure NPs + CM. The results showed that both CM and the NPs induced statistically significant DNA damage compared to control (2.6% DNA in tail) (). CM from 3 h exposed macrophages resulted in 7.0% and 8.8% DNA in tail for Ni and NiO, respectively. These levels were similar as those from 18 h exposed macrophages. Similar levels were also observed when HBEC cells were directly exposed to a lower concentration of agglomerated NPs (10 µg/ml). No additive effects were, however, noted when HBEC cells were exposed to both NPs and CM (see Supplementary Figure S4). Control experiments performed on the ‘released fraction’ from NiO (produced by incubating NiO in medium similar as the CM but without cells) showed a small increase (1% DNA in tail) in DNA strand breaks compared to the control (Supplementary Figure S4).
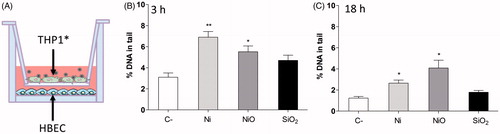
Figure 4. DNA damage caused by conditioned media. (A) Conditioned media was generated by exposing THP1* cells to 50 µg/ml (15.8 μg Ni/cm2) for 3 or 18 h. Next, the media was removed and centrifuged in order to remove remaining particles. HBEC cells were then exposed to the NP-free CM. (B) CM from THP1* cells caused DNA damage in HBEC cells following 3 h exposure. (C) A lower concentration (10 µg/ml) of direct exposure to the particles caused similar extent of damage. The bars show mean ± SEM and significant differences compared to the control are marked with asterisks (* for p-value < 0.05, ** for p-value < 0.01, *** for p-value < 0.001).
THP1* macrophages exposed to Ni and NiO cause DNA damage in unexposed HBEC in a co-culture system
THP-1* and HBEC cells were cultured in a co-culture system in which THP-1*, cultured in a transwell unit, were exposed to NPs (50 μg/ml) for 3 or 18 h. HBEC cells, cultured in the lower compartment beneath the transwell, were then processed for the comet assay (see ). After both 3 and 18 h exposure, THP1* exposed to Ni and NiO NPs, led to a significant increase in DNA damage in HBEC cells. The DNA damage in control cells at 3 h was 3% and for Ni and NiO NPs the levels were increased to 6.9% and 5.5%, respectively. For 18 h the levels were 1.2%, 2.6%, and 4% for control, Ni, and NiO NPs, respectively. THP-1* exposure to SiO2 resulted in only a small non-significant increase for both time points.
Figure 5. DNA damage observed in a co-culture system. (A) THP1* cells cultured in a transwell were exposed to 50 µg/ml (13.2 Ni/cm2) for 3 or 18 h and DNA damage was analyzed in HBEC cells cultured beneath the transwell. DNA damage was observed in HBEC cells following 3 h exposure (B) and 18 h exposure (C). The bars show mean ± SEM and significant differences compared to the control are marked with asterisks (* for p-value < 0.05, ** for p-value < 0.01, *** for p-value < 0.001).
Conditioned media – Ni ion release and ROS formation
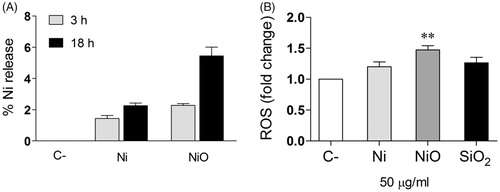
In order to measure the presence of Ni and ROS in the conditioned media, ICP-MS and the DCFH-DA assays were used. Thus, the amount of released Ni present in CM from Ni and NiO NPs exposed THP-1* for 3 h and 18 h in comparison to the total amount of added Ni and NiO NPs (50 µg/ml) was analyzed. The results showed that the percentage of Ni released after 3 h from Ni and NiO NPs were 1.4% and 2.3%, respectively (). This increased to approximately the double after 18 h (2.3% and 5.5%, respectively). By using the DCFH-DA assay we were not able to measure any increased ROS in the CM (data not shown), but an increase (1.5) in intracellular ROS was observed following exposure of HBEC cells to the CM from NiO NPs ().
Figure 6. Conditioned media – Ni ion release and ROS formation. (A) The amount of Ni release (% of added) was analyzed in the CM by using ICP-MS. (B) HBEC cells were exposed to the CM and ROS formation (fold change compared to control) was analyzed by the DCFH-DA assay. The bars show mean ± SEM and significant differences compared to the control are marked with asterisks (* for p-value < 0.05, ** for p-value < 0.01, *** for p-value < 0.001).
Discussion
The aim of this study is to investigate inflammatory effects after macrophage exposure to Ni and NiO NPs and furthermore to explore the possibility to test secondary (inflammation-driven) genotoxicity in vitro. To study this, an approach using conditioned media as well as a co-culture model was employed. For the macrophage exposure, two different time points were tested in order to detect possible acute effects (following 3 h exposure) as well as effects observed after a longer exposure (18 h) presumably allowing a more pronounced cytokine secretion. For cytotoxicity, the time point 24 h was used in order to enable comparisons to our previous studies on Ni and NiO nanoparticles using different cells (reporter cell lines, BEAS-2B cells, see Akerlund et al. Citation2017; Di Bucchianico et al. Citation2018). The concentration used for the macrophages (50 µg/ml; 15.8 µg/cm2) can be regarded as high although in line with concentrations generally used when testing particles in vitro. It should also be noted that the concentration used caused some cytotoxicity (significantly only for the benchmark particle SiO2) that may affect the data. To put this concentration in perspective using several assumptions, this may represent the lung dose after several years exposure (over 1000 working days) at an air concentration of 0.5 mg/m3 (limit value for insoluble Ni) assuming no clearance. These assumptions (see also e.g. Paur et al. Citation2011; Wang et al. Citation2014) were the following: the ventilation rate of a healthy human adult in a working situation is 20 L/min (=9.6 m3/8-h-day), the deposition fraction is 30%, the total lung surface is 100 m2 and a factor of ×10 is used to account for uneven deposition (total deposition in mg: 0.5 × 0.3 × 9.6 × 1000 = 1440; expressed as µg/per cm2 in lung and using a factor ×10 for uneven deposition = 14.4 µg/cm2). Cell uptake of the Ni and NiO nanoparticles was not confirmed in this study, but was clearly shown in our recent study on BEAS-2B cells (Di Bucchianico et al. Citation2018). Finally, genotoxicity in cultured bronchial cells was analyzed due to the fact that most lung cancers start in the lining of the bronchi and the comet assay was used due to its high sensitivity.
The proteome profiler assay was employed to screen for the release of various cytokines after macrophage exposure and an increase in several cytokines () was noted. After 3 h exposure, the levels of IFN-γ and IL-17A were elevated, a result interestingly in line with changes noted in BAL following exposure of rats to NiO NPs (Cho et al. Citation2012). The increases in IFN-γ and IL-17A, typically produced by natural killer (NK) cells and T helper 17 cells, respectively, are classical markers of a delayed type hypersensitivity. The proteome profiler assay also indicated an increase in MIF (migration inhibitory factor), an inflammatory cytokine that also has been seen as a pro-tumorigenic factor (Mitchell Citation2004). It has also been suggested that MIF promotes tumor growth and viability by supporting tumor-associated angiogenesis and modulating immune responses (Chesney et al. Citation1999; White et al. Citation2001). Following 18 h exposure, we noted increased IL-1α and IL-1β, in line with some previous studies. One study demonstrated, for example, that NiO NP exposure induced pulmonary inflammation by activating the NLRP3 inflammasome (in vivo and in vitro) and an increased secretion of IL-1β and IL-18 was observed (Cao et al. Citation2016). In another study the expression of cytokines in the lung tissue and BALF was analyzed following intratracheal instillation of NiO NPs in rats. The results showed a persistent increase of MIP-1α expression and a transient increase of IL-1α, IL-1β, and MCP-1 (Morimoto et al. Citation2010). In yet another study where mice were exposed via inhalation to Ni(OH)2 NP, an upregulation of IL-1α, TNF-α, Mip-2, and CCL2 mRNA expression was observed in lung tissue (Gillespie et al. Citation2010). Both in vitro (Capasso, Camatini, and Gualtieri Citation2014) and in vivo (Bai et al. Citation2017) studies have shown an increased in IL-6 and IL-8, which was in contrast to our study (Supplementary materials).
Interestingly, we found an increased secretion of VEGF by both Ni and NiO NPs by using the proteome profiler assay (), and this result was also confirmed by using Luminex (). VEGF is a cytokine that regulates angiogenesis during processes such as embryogenesis, skeletal growth, and reproductive functions but also plays a role in pathological angiogenesis associated with tumors (Ferrara, Gerber, and LeCouter Citation2003). VEGF has also previously been shown to activate NF-κB (Marumo, Schini-Kerth, and Busse Citation1999; Kim et al. Citation2001). In one study in which mice inhaled Ni NPs, no significant increase in plasma VEGF was observed (Liberda et al. Citation2010). On the other hand, our finding appears to be in line with results from several other in vitro studies on various Ni-containing exposures. Skin cells exposed to NiCl2, Ni3S2, or NiS resulted in VEGF induction in a dose and time dependent manner (Ouyang et al. Citation2005) and another study demonstrated that NiCl2 and Ni3S2 induced an increase in VEGF promoter-driven luciferase activity (Li et al. Citation2004). Furthermore, nickel exposure resulted in a significant, dose-dependent increase in VEGF mRNA expression in osteoblastic cells (Steinbrech et al. Citation2000) and nickel (Ni2+) ion doped nano-hydroxyapatites induced cellular VEGF expression in a human osteoblast cell line (Priya et al. Citation2015). No previous in vitro studies on VEGF and Ni and NiO NPs were found, but some other studies have shown increased expression of VEGF following exposure to silver NPs (Kang et al. Citation2011) and a powder mixtures of tungsten carbide and metallic cobalt (WC-Co) NPs (Liu et al. Citation2015). The master transcription factor HIF1α (hypoxia inducible factor) can activate gene expression of both VEGF (Shweiki et al. Citation1992) and MIF (Winner et al. Citation2007) and Ni and NiO NPs have earlier been found to induce the HIF1α pathway (Pietruska et al. Citation2011).
Following the analysis of inflammation, our next aim is to assess whether the inflammation could result in genotoxicity and furthermore whether this effect could be detected using an in vitro assay. Both Ni and NiO caused DNA damage following exposure of HBEC (10 μg/mL) for 3 h, in line with our previous results on 24 h (Akerlund et al. Citation2017). Interestingly, the CM from exposed macrophages also caused DNA damage (), thus suggesting an inflammatory-driven genotoxicity. An increase in DNA damage was also observed for the benchmark particle crystalline silica (quartz). Similar results were also found when using a co-culture system (), although in this case the silica material did no show a statistical significant increase. By culturing the macrophages and epithelial cells in different compartments we may underestimate effects that are dependent on cell–cell contact. On the other hand, a previous study showed that the presence of macrophages provided protection against quartz-induced oxidative DNA damage in A549 cells in a co-culture model where the cells had direct contact, while quartz alone induced significant DNA damage. The same study demonstrated that oxidative DNA damage induced by quartz in A549 cells co-cultured with neutrophils was NADPH oxidase dependent (van Berlo et al. Citation2010).
The content of ionic Ni in the CM was analyzed and the results showed that a few percent of the original mass had dissolved in the medium, in line with previous results of dissolution in cell media (). We have previously shown lack of DNA strand break induction by ionic Ni in HBEC cells (Akerlund et al. Citation2017) and, thus, it appeared as unlikely that the genotoxicity observed would be due to the dissolved Ni. When we tested the ability of the ‘released Ni fraction’ from NiO (18 h in cell medium without macrophages), we could however detect a minor increase in DNA breaks. Thus, DNA damage caused by ionic Ni cannot totally be excluded but is unlikely to explain the whole genotoxic effect observed for the CM. Furthermore, we could not detect any increased ROS in the CM by using the DCFH-DA assay (data not shown), although the assay might need to be further optimized for detecting extracellular ROS. Macrophage cytokine release could be a possible explanation for the DNA damage as some pro-inflammatory cytokines such as TNFα and IL-1β may cause assembly of nitric oxide synthase within epithelial cells, which could result in intracellular production of NO (Green et al. Citation1994). Furthermore, VEGF shown here to be present in the CM may also play a role since treatment of endothelial cells with VEGF led to an increased intracellular ROS production (Monaghan-Benson and Burridge 2009) and we found increased ROS in the HBEC cells following exposure to CM from NiO (). A recent study highlighted the role of oxidative stress since pretreatment of cells with NAC (N-acetyl-cystein) protected from secondary genotoxicity caused by Fe2O3 and Fe3O4 NPs (SPIONS) (Evans et al. Citation2019). Taken together, we have shown that Ni and NiO appear to cause both primary and secondary (inflammation-driven) genotoxicity. The exact mechanism for the secondary genotoxicity is currently not known and future studies exploring this using e.g. ROS scavengers, chelators, iNOS, as well as NADPD oxidase inhibitors and inhibitors of cell uptake would be valuable.
Secondary genotoxicity is suggested to be a main mechanism of genotoxicity in vivo. Today, most of the standard in vitro models assess primary genotoxicity based on single cell systems, which are not always representable for the in vivo situation (Catalán, Stockmann-Juvala, and Norppa Citation2017; Evans et al. Citation2017). Hence, more studies on in vitro systems which also can detect secondary genotoxicity are needed. It is clearly of importance to develop such in vitro systems to attend to the three R:s i.e. replacement, reduction and refinement of animal experiments. The use of a conditioned media approach and a co-culture model was an attempt to better mimic an in vivo situation, in a simplified version, to study secondary genotoxicity. However, more expensive advanced systems such as 3D cultures and micro tissues could also be used to study the same endpoint (Evans et al. Citation2017).
In conclusion, we have demonstrated that Ni and NiO NPs cause a release of inflammatory cytokines from exposed macrophages and furthermore that it is possible to detect a secondary genotoxicity in lung epithelial cells by using in vitro methods based on conditioned media or co-cultures. Further investigation is needed in order to find out what factors that are causing this secondary genotoxicity and whether such effects are caused by numerous NPs.
TNAN-2018-OR-0360-File008.docx
Download MS Word (991.2 KB)Disclosure statement
No potential conflict of interest was reported by the authors.
Additional information
Funding
References
- Akerlund, E., F. Cappellini, S. Di Bucchianico, S. Islam, S. Skoglund, R. Derr, I. Odnevall Wallinder, G. Hendriks, and H. L. Karlsson. 2017. “Genotoxic and Mutagenic Properties of Ni and NiO Nanoparticles Investigated by Comet Assay, gamma-H2AX Staining, Hprt Mutation Assay and ToxTracker Reporter Cell Lines.” Environmental and Molecular Mutagenesis 59 (3): 211–222. doi:10.1002/em.22163.
- Bai, K. J., K. J. Chuang, J. K. Chen, H. E. Hua, Y. L. Shen, W. N. Liao, C. H. Lee, et al. 2017. “Investigation into the Pulmonary Inflammopathology of Exposure to Nickel Oxide Nanoparticles in Mice.” Nanomedicine 14 (7): 2329–2339. doi:10.1016/j.nano.2017.10.003.
- Barlow, P. G., A. Clouter-Baker, K. Donaldson, J. Maccallum, and V. Stone. 2005. “Carbon Black Nanoparticles Induce Type II Epithelial Cells to Release Chemotaxins for Alveolar Macrophages.” Particle and Fibre Toxicology 2 (1): 11. doi:10.1186/1743-8977-2-11.
- Borm, P. J. A., P. Fowler, and D. Kirkland. 2018. “An Updated Review of the Genotoxicity of Respirable Crystalline Silica.” Particle and Fibre Toxicology 15 (1): 23. doi:10.1186/s12989-018-0259-z.
- Cao, Z. W., Y. L. Fang, Y. H. Lu, F. H. Qian, Q. L. Ma, M. D. He, H. F. Pi, Z. P. Yu, and Z. Zhou. 2016. “Exposure to Nickel Oxide Nanoparticles Induces Pulmonary Inflammation through NLRP3 Inflammasome Activation in Rats.” International Journal of Nanomedicine 11: 3331–3346. doi:10.2147/IJN.S106912.
- Capasso, L., M. Camatini, and M. Gualtieri. 2014. “Nickel Oxide Nanoparticles Induce Inflammation and Genotoxic Effect in Lung Epithelial Cells.” Toxicology Letters 226 (1): 28–34. doi:10.1016/j.toxlet.2014.01.040.
- Catalán, J., K. M. Siivola, P. Nymark, H. Lindberg, S. Suhonen, H. Järventaus, A. J. Koivisto, et al. 2016. “In Vitro and in Vivo Genotoxic Effects of Straight versus Tangled Multi-Walled Carbon Nanotubes.” Nanotoxicology 10 (6): 794–806. doi:10.3109/17435390.2015.1132345.
- Catalán, J., H. Stockmann-Juvala, and H. Norppa. 2017. “A Theoretical Approach for a Weighted Assessment of the Mutagenic Potential of Nanomaterials.” Nanotoxicology 11 (8): 964–977. doi:10.1080/17435390.2017.1382601.
- Chesney, J., C. Metz, M. Bacher, T. Peng, A. Meinhardt, and R. Bucala. 1999. “An Essential Role for Macrophage Migration Inhibitory Factor (MIF) in Angiogenesis and the Growth of a Murine Lymphoma.” Molecular Medicine 5 (3): 181–191.
- Cho, W. S., R. Duffin, M. Bradley, I. L. Megson, W. Macnee, S. E. Howie, and K. Donaldson. 2012. “NiO and Co3O4 Nanoparticles Induce Lung DTH-like Responses and Alveolar Lipoproteinosis”. The European Respiratory Journal 39 (3): 546–557. doi:10.1183/09031936.00047111.
- Di Bucchianico, S., F. Cappellini, F. Le Bihanic, Y. N. Zhang, K. Dreij, and H. L. Karlsson. 2017. “Genotoxicity of TiO2 Nanoparticles Assessed by Mini-Gel Comet Assay and Micronucleus Scoring with Flow Cytometry.” Mutagenesis 32 (1): 127–137. doi:10.1093/mutage/gew030.
- Di Bucchianico, S., A. R. Gliga, E. Akerlund, S. Skoglund, I. O. Wallinder, B. Fadeel, and H. L. Karlsson. 2018. “ Calcium-dependent Cyto- and Genotoxicity of Nickel Metal and Nickel Oxide Nanoparticles in Human Lung Cells .” Particle and Fibre Toxicology 15 (1): 32.doi:10.1186/s12989-018-0268-y.
- Evans, S. J., M. J. Clift, N. Singh, J. de Oliveira Mallia, M. Burgum, J. W. Wills, T. S. Wilkinson, G. J. Jenkins, and S. H. Doak. 2017. “Critical Review of the Current and Future Challenges Associated with Advanced in Vitro Systems towards the Study of Nanoparticle (Secondary) Genotoxicity.” Mutagenesis 32 (1): 233–241. doi:10.1093/mutage/gew054.
- Evans, S. J., M. J. Clift, N. Singh, J. W. Wills, N. Hondow, T. S. Wilkinson, M. J. Burgum, A. P. Brown, G. J. Jenkins, and S. H. Doak. 2019. “In Vitro Detection of in Vitro Secondary Mechanisms of Genotoxicity Induced by Engineered Nanomaterials.” Particle and Fibre Toxicology 16 (1): 8. doi:10.1186/s12989-019-0291-7.
- Feghali, C. A., and T. M. Wright. 1997. “Cytokines in Acute and Chronic Inflammation.” Frontiers in Bioscience: A Journal and Virtual Library 2: d12–d26.
- Ferrara, N., H. P. Gerber, and J. LeCouter. 2003. “The Biology of VEGF and Its Receptors.” Nature Medicine 9 (6): 669–676. doi:10.1038/nm0603-669.
- Forman, H. J., and M. Torres. 2002. “Reactive Oxygen Species and Cell Signaling: Respiratory Burst in Macrophage Signaling.” American Journal of Respiratory and Critical Care Medicine 166 (Supplement_1): S4–S8. doi:10.1164/rccm.2206007.
- Gillespie, P. A., G. S. Kang, A. Elder, R. Gelein, L. Chen, A. L. Moreira, J. Koberstein, K. M. Tchou-Wong, T. Gordon, and L. C. Chen. 2010. “Pulmonary Response after Exposure to Inhaled Nickel Hydroxide Nanoparticles: Short and Long-Term Studies in Mice.” Nanotoxicology 4 (1): 106–119. doi:10.3109/17435390903470101.
- Green, S. J., L. F. Scheller, M. A. Marletta, M. C. Seguin, F. W. Klotz, M. Slayter, B. J. Nelson, and C. A. Nacy. 1994. “Nitric-Oxide – Cytokine-Regulation of Nitric-Oxide in Host-Resistance to Intracellular Pathogens.” Immunology Letters 43 (1–2): 87–94. doi:10.1016/0165-2478(94)00158-8.
- IARC. 1990. IARC monographs on the evaluation of carcinogenic risks to humans.
- IARC. 2012. “IARC monographs on nickel and nickel compounds”. 100C.
- Kain, J., H. L. Karlsson, and L. Moller. 2012. “DNA Damage Induced by Micro- and Nanoparticles–Interaction with FPG Influences the Detection of DNA Oxidation in the Comet Assay.” Mutagenesis 27 (4): 491–500. doi:10.1093/mutage/ges010.
- Kang, K., D. H. Lim, I. H. Choi, T. Kang, K. Lee, E. Y. Moon, Y. Yang, M. S. Lee, and J. S. Lim. 2011. “Vascular Tube Formation and Angiogenesis Induced by Polyvinylpyrrolidone-Coated Silver Nanoparticles.” Toxicology Letters 205 (3): 227–234. doi:10.1016/j.toxlet.2011.05.1033.
- Kessler, R. 2011. “Engineered Nanoparticles in Consumer Products: Understanding a New Ingredient.” Environmental Health Perspectives 119 (3): a120–a125. doi:10.1289/ehp.119-a120.
- Kim, I., S. O. Moon, S. H. Kim, H. J. Kim, Y. S. Koh, and G. Y. Koh. 2001. “Vascular Endothelial Growth Factor Expression of Intercellular Adhesion Molecule 1 (ICAM-1), Vascular Cell Adhesion Molecule 1 (VCAM-1), and E-Selectin through Nuclear Factor-Kappa B Activation in Endothelial Cells.” Journal of Biological Chemistry 276 (10): 7614–7620. doi:10.1074/jbc.M009705200.
- Knaapen, A. M., P. J. Borm, C. Albrecht, and R. P. Schins. 2004. “Inhaled Particles and Lung Cancer. Part A: Mechanisms.” International Journal of Cancer 109 (6): 799–809. doi:10.1002/ijc.11708.
- Latvala, S., J. Hedberg, S. Di Bucchianico, L. Moller, I. Odnevall Wallinder, K. Elihn, and H. L. Karlsson. 2016. “Nickel Release, ROS Generation and Toxicity of Ni and NiO Micro- and Nanoparticles.” PLoS One 11 (7): e0159684. doi:10.1371/journal.pone.0159684.
- Li, J. X., G. Davidson, Y. Huang, B. H. Jiang, X. L. Shi, M. Costa, and C. S. Huang. 2004. “Nickel Compounds Act through Phosphatidylinositol-3-Kinase/Akt-Dependent, p70(S6k)-Independent Pathway to Induce Hypoxia Inducible Factor Transactivation and Cap43 Expression in Mouse Epidermal Cl41 Cells.” Cancer Research 64 (1): 94–101. doi:10.1158/0008-5472.CAN-03-0737.
- Liberda, E. N., A. K. Cuevas, P. A. Gillespie, G. Grunig, Q. Qu, and L. C. Chen. 2010. “Exposure to Inhaled Nickel Nanoparticles Causes a Reduction in Number and Function of Bone Marrow Endothelial Progenitor Cells.” Inhalation Toxicology 22 (Sup2): 95–99. doi:10.3109/08958378.2010.515269.
- Liu, L. Z., M. Ding, J. Z. Zheng, Y. X. Zhu, B. A. Fenderson, B. Y. Li, J. J. Yu, and B. H. Jiang. 2015. “Tungsten Carbide-Cobalt Nanoparticles Induce Reactive Oxygen Species, AKT, ERK, AP-1, NF-Kappa B, VEGF, and Angiogenesis.” Biological Trace Element Research 166 (1): 57–65. doi:10.1007/s12011-015-0331-6.
- Magdolenova, Z., A. Collins, A. Kumar, A. Dhawan, V. Stone, and M. Dusinska. 2014. “Mechanisms of Genotoxicity. A Review of in Vitro and in Vivo Studies with Engineered Nanoparticles.” Nanotoxicology 8 (3): 233–278. doi:10.3109/17435390.2013.773464.
- Marumo, T., V. B. Schini-Kerth, and R. Busse. 1999. “Vascular Endothelial Growth Factor Activates Nuclear Factor-kappaB and Induces Monocyte Chemoattractant Protein-1 in Bovine Retinal Endothelial Cells.” Diabetes 48 (5): 1131–1137. doi:10.2337/diabetes.48.5.1131.
- M'Bemba-Meka, P., N. Lemieux, and S. K. Chakrabarti. 2005. “Nickel Compound-Induced DNA Single-Strand Breaks in Chromosomal and Nuclear Chromatin in Human Blood Lymphocytes in Vitro: Role of Oxidative Stress and Intracellular Calcium.” Mutation Research – Genetic Toxicology and Environmental Mutagenesis 586: 124–137. doi:10.1016/j.mrgentox.2005.06.001.
- Mitchell, R. A. 2004. “Mechanisms and Effectors of MIF-Dependent Promotion of Tumourigenesis.” Cellular Signalling 16 (1): 13–19. doi:10.1016/j.cellsig.2003.07.002.
- Monaghan-Benson, E., and K. Burridge. 2009. “The Regulation of Vascular Endothelial Growth Factor-Induced Microvascular Permeability Requires Rac and Reactive Oxygen Species.” Journal of Biological Chemistry 284 (38): 25602–25611. doi:10.1074/jbc.M109.009894.
- Morimoto, Y., A. Ogami, M. Todoroki, M. Yamamoto, M. Murakami, M. Hirohashi, T. Oyabu, et al. 2010. “Expression of Inflammation-Related Cytokines following Intratracheal Instillation of Nickel Oxide Nanoparticles.” Nanotoxicology 4 (2): 161–176. doi:10.3109/17435390903518479.
- Murphy, F. A., A. Schinwald, C. A. Poland, and K. Donaldson. 2012. “The Mechanism of Pleural Inflammation by Long Carbon Nanotubes: Interaction of Long Fibres with Macrophages Stimulates Them to Amplify Pro-Inflammatory Responses in Mesothelial Cells.” Particle and Fibre Toxicology 9: 8. doi:10.1186/1743-8977-9-8.
- Nishi, K., Y. Morimoto, A. Ogami, M. Murakami, T. Myojo, T. Oyabu, C. Kadoya, et al. 2009. “Expression of Cytokine-Induced Neutrophil Chemoattractant in Rat Lungs by Intratracheal Instillation of Nickel Oxide Nanoparticles.” Inhalation Toxicology 21 (12): 1030–1039. doi:10.1080/08958370802716722.
- OECD. 2014. “Genotoxicity of Manufactured Nanomaterials: Report of the OECD Expert Meeting. Series on the Safety of Manufactured Nanomaterials. No. 43”.
- Ouyang, W., J. X. Li, X. L. Shi, M. Costa, and C. S. Huang. 2005. “Essential Role of PI-3K, ERKs and Calcium Signal Pathways in Nickel-Induced VEGF Expression.” Molecular and Cellular Biochemistry 279 (1–2): 35–43. doi:10.1007/s11010-005-8214-3.
- Paur, H. F., F. R. Cassee, J. Teeguarden, H. Fissan, S. Diabate, M. Aufderheide, W. Kreyling, et al. 2011. “In-Vitro Cell Exposure Studies for the Assessment of Nanoparticle Toxicity in the lung – A Dialog between Aerosol Science and Biology.” Journal of Aerosol Science 42 (10): 668–692. doi:10.1016/j.jaerosci.2011.06.005.
- Pietruska, J. R., X. Y. Liu, A. Smith, K. McNeil, P. Weston, A. Zhitkovich, R. Hurt, and A. B. Kane. 2011. “Bioavailability, Intracellular Mobilization of Nickel, and HIF-1 Alpha Activation in Human Lung Epithelial Cells Exposed to Metallic Nickel and Nickel Oxide Nanoparticles.” Toxicological Sciences 124 (1): 138–148. doi:10.1093/toxsci/kfr206.
- Priya, B. A., K. Senthilguru, T. Agarwal, S. N. Gautham Hari Narayana, S. Giri, K. Pramanik, K. Pal, I. Banerjee. 2015. “Nickel Doped Nanohydroxyapatite: Vascular Endothelial Growth Factor Inducing Biomaterial for Bone Tissue Engineering.” RSC Advances 5: 72515–72528. doi:10.1039/C5RA09560C.
- Shaw, C. A., S. Robertson, M. R. Miller, R. Duffin, C. M. Tabor, K. Donaldson, D. E. Newby, and P. Hadoke. 2011. “Diesel Exhaust Particulate-Exposed Macrophages Cause Marked Endothelial Cell Activation.” American Journal of Respiratory Cell and Molecular Biology 44 (6): 840–851. doi:10.1165/rcmb.2010-0011OC.
- Shweiki, D., A. Itin, D. Soffer, and E. Keshet. 1992. “Vascular Endothelial Growth-Factor Induced by Hypoxia May Mediate Hypoxia-Initiated Angiogenesis.” Nature 359 (6398): 843–845. doi:10.1038/359843a0.
- Steinbrech, D. S., B. J. Mehrara, P. B. Saadeh, J. A. Greenwald, J. A. Spector, G. K. Gittes, and M. T. Longaker. 2000. “VEGF Expression in an Osteoblast-like Cell Line Is Regulated by a Hypoxia Response Mechanism.” American Journal of Physiology. Cell Physiology 278 (4): C853–C860. doi:10.1152/ajpcell.2000.278.4.C853.
- Thannickal, V. J., and B. L. Fanburg. 2000. “Reactive Oxygen Species in Cell Signaling.” American Journal of Physiology-Lung Cellular and Molecular Physiology 279 (6): L1005–L1028. doi:10.1152/ajplung.2000.279.6.L1005.
- van Berlo, D., A. Wessels, A. W. Boots, V. Wilhelmi, A. M. Scherbart, K. Gerloff, F. J. van Schooten, C. Albrecht, and R. P. Schins. 2010. “Neutrophil-Derived ROS Contribute to Oxidative DNA Damage Induction by Quartz Particles.” Free Radical Biology & Medicine 49: 1685–1693. doi:10.1016/j.freeradbiomed.2010.08.031.
- Wang, X., Z. Ji, C. H. Chang, H. Zhang, M. Wang, Y. P. Liao, S. Lin, et al. 2014. “Use of Coated Silver Nanoparticles to Understand the Relationship of Particle Dissolution and Bioavailability to Cell and Lung Toxicological Potential.” Small 10 (2): 385–398. doi:10.1002/smll.201301597.
- White, E. S., S. R. B. Strom, N. L. Wys, and D. A. Arenberg. 2001. “Non-Small Cell Lung Cancer Cells Induce Monocytes to Increase Expression of Angiogenic Activity.” The Journal of Immunology 166 (12): 7549–7555. doi:10.4049/jimmunol.166.12.7549.
- Winner, M., A. C. Koong, B. E. Rendon, W. Zundel, and R. A. Mitchell. 2007. “Amplification of Tumor Hypoxic Responses by Macrophage Migration Inhibitory Factor-Dependent Hypoxia-Inducible Factor Stabilization.” Cancer Research 67 (1): 186–193. doi:10.1158/0008-5472.CAN-06-3292.