
Abstract
Nanomaterials, especially silver nanoparticles (AgNPs), are used in a broad range of products owing to their antimicrobial potential. Oral ingestion is considered as a main exposure route to AgNPs. This study aimed to investigate the impact of the biochemical conditions within the human digestive tract on the intestinal fate of AgNPs across an intestinal in vitro model of differentiated Caco-2/HT29-MTX cells. The co-culture model was exposed to different concentrations (250–2500 µg/L) of pristine and in vitro digested (IVD) AgNPs and silver nitrate for 24 h. ICP-MS and spICP-MS measurements were performed for quantification of total Ag and AgNPs. The AgNPs size distribution, dissolution, and particle concentration (mass- and number-based) were characterized in the cell fraction and in the apical and basolateral compartments of the monolayer cultures. A significant fraction of the AgNPs dissolved (86–92% and 48–70%) during the digestion. Cellular exposure to increasing concentrations of pristine or IVD AgNPs resulted in a concentration dependent increase of total Ag and AgNPs content in the cellular fractions. The cellular concentrations were significantly lower following exposure to IVD AgNPs compared to the pristine AgNPs. Transport of silver as either total Ag or AgNPs was limited (<0.1%) following exposure to pristine and IVD AgNPs. We conclude that the surface chemistry of AgNPs and their digestion influence their dissolution properties, uptake/association with the Caco-2/HT29-MTX monolayer. This highlights the need to take in vitro digestion into account when studying nanoparticle toxicokinetics and toxicodynamics in cellular in vitro model systems.
Introduction
Nanomaterials are used in a broad range of products and applications such as textiles, medical devices, water disinfection, personal hygiene and food products (Abdelkhaliq et al. Citation2018; Chaudhry et al. Citation2008; Imai et al. Citation2017; Lichtenstein et al. Citation2015). Because of the antimicrobial potential of silver nanoparticles (AgNPs), they are amongst the most frequently used nanoparticles (NPs) in food associated products (e.g. packaging and kitchen utensils) (Choi et al. Citation2018; Lichtenstein et al. Citation2015). Therefore, oral ingestion is considered as a main exposure route for humans to AgNPs. From a risk assessment perspective, understanding the fate, cellular interactions (i.e. cellular uptake) and bioavailability of AgNPs upon digestion is of key importance to assess their impact on health (Bouwmeester et al. Citation2011; Hsiao et al. Citation2016; Lichtenstein et al. Citation2015, Citation2017)
Upon oral ingestion of AgNPs, these particles pass through several compartments of the gastrointestinal tract (mouth, stomach and intestine), each with a specific pH and biochemical composition. These varying conditions can affect the AgNPs physicochemical properties (e.g. agglomeration and dissolution) and accordingly affect their bioavailability and toxicological properties (Böhmert et al. Citation2014; Lichtenstein et al. Citation2017; Murdock et al. Citation2008; Sieg et al. Citation2017). Upon reaching the intestine, the biological interactions (e.g. uptake and transport) of the AgNPs with the intestinal epithelial cells determine their bioavailability and possible subsequent systemic effects upon oral ingestion (McCracken et al. Citation2015). AgNPs size and surface chemistry play an important role in their stability, cellular internalization, and transport (Lichtenstein et al. Citation2017; Mwilu et al. Citation2013). Several in vitro models have been developed to represent the intestinal epithelial barrier (Lefebvre et al. Citation2015) which are exposed to NPs to simulate real-life human exposure conditions to NPs (Nel et al. Citation2006; Sieg et al. Citation2017). Among these model, the co-cultures of monolayers of Caco-2 intestinal cells and HT29-MTX mucus secreting cells are widely used as an in vitro intestinal epithelium model (Bailey, Bryla, and Malick Citation1996; Georgantzopoulou et al. Citation2015; Lefebvre et al. Citation2015; Stone, Johnston, and Schins Citation2009). These models however do not consider possible effects of digestion on toxicokinetics and toxicodynamics of NPs.
Detection, characterization, and quantification of (metal) nanoparticles are of importance in studying the fate of NPs. For this, several analytical methods have been developed (López-Serrano et al. Citation2014). Single particle-inductively coupled plasma mass spectrometry (spICP-MS) has shown high efficacy and sensitivity to detect NPs at low concentrations in addition to its ability to distinguish between metal ions and NPs (Abdolahpur Monikh et al. Citation2019; Ding et al. Citation2018; van der Zande et al. Citation2016; Weigel et al. Citation2017). In addition, spICP-MS provides information on the size, size distribution, and mass- and number-based NPs concentration (Hsiao et al. Citation2016; Laborda et al. Citation2011; Peters et al. Citation2015). To study the cellular uptake and internalization of AgNPs, however, additional techniques need to be used. For this we used confocal fluorescence microscopy exploiting the light scattering properties of AgNPs in combination with immunohistochemistry (Kittler et al. Citation2010; van der Zande et al. Citation2016). Here, we aimed to investigate the impact of in vitro digestion (IVD) on two 50 nm AgNPs with different surface chemistries, while silver nitrate (AgNO3) was used as an ionic control. An in vitro human digestion model was used to mimic the oral, gastric, and small intestinal conditions (Lichtenstein et al. Citation2015; Versantvoort et al. Citation2005; Walczak et al. Citation2012). The size, size distribution, dissolution, and particle concentration (mass- and number-based) of the AgNPs after in vitro digestion using spICP-MS and ICP-MS were measured and quantified.
Also, we investigated the impact of in vitro digestion on the uptake/association and transport of the AgNPs in or through the intestinal barrier using an in vitro Caco-2 and HT29-MTX co-culture transwell model.
Materials and methods
Nanoparticles and chemicals
Two 50 nm negatively charged AgNPs with different surface modifications were purchased from Nanocomposix Inc. (San diego, CA, USA); lipoic acid BioPure™ (pH 6.1) in milli-Q water and citrate BioPure™ (pH 7.4) in 2 mM citrate buffer, further referred to as (LA) and (Cit) AgNPs, respectively. The silver mass concentration in the stock suspensions of both AgNPs was 1 mg/mL. All the AgNPs suspensions were stored at 4 °C in the dark. Dilutions of the AgNPs were freshly prepared for every experiment in complete cell culture medium (DMEM+), prepared by supplementing Dulbecco’s Modified Eagle Medium (DMEM) culture medium (LONZA, Basel, Switzerland) with 10% (v/v) heat inactivated Fetal Bovine Serum (FBS) (Gibco®, Life technologies, USA), 1% (v/v) of Penicillin–Streptomycin 10 000 units penicillin, and 10 mg streptomycin/mL (Sigma-Aldrich, St Louis, MO, USA), and 1% (v/v) of MEM Non-Essential Amino Acids (NEAA) (Gibco®, life technologies, Langley, OK, USA). Silver nitrate (AgNO3) (Sigma, USA) was used as a control (source of Ag+ ions) in all the experiments. Dilutions of AgNO3 were freshly prepared for every experiment in DMEM+.
Physicochemical characterization of nanoparticles
Hydrodynamic diameters of AgNPs were determined using dynamic light scattering (DLS). Measurements were performed on samples containing 10 mg/L AgNPs suspended in nano-pure water using an ALV dynamic light scattering setup (ALV-Laser Vertriebsgesellschaft, Langen, Germany), consisting of a Thorn RFIB263KF photomultiplier detector, an ALV-SP/86 goniometer, an ALV 50/100/200/400/600 μm pinhole detection system, an ALV7002 external correlator, and a Cobolt Samba-300 DPSS laser. Measurements were performed at t = 0 h and at t = 24 h at room temperature, samples were incubated at 37 °C. For each condition, samples were analyzed in triplicate; each measurement consisted of 10 technical replicates measurements of 30 s each, at an angle of 90°. The results are expressed as the average hydrodynamic diameter (nm) ± standard deviation (SD) that was calculated using AfterALV® software (AfterALV 1.0d, Dullware, USA).
The AgNPs surface charges were determined by measuring the zeta-potential of 10 µg/mL AgNPs suspensions in nano-pure water using a Malvern Nanosizer (Malvern Instruments, UK). All samples were analyzed in triplicate.
The total silver content of pristine AgNPs suspensions and AgNO3 solution was analyzed using a NexION 350 D (PerkinElmer, Waltham, MA, USA) ICP-MS. Before analysis, samples were digested using an aqua-regia [1:3 (v/v), 70% HNO3: 37% HCl] acid digestion for 30 min at 60 °C and diluted with nano-pure water. Silver was measured using the selected element-monitoring mode with m/z values of 107 and 109. A matrix-matched calibration curve of an ionic Ag standard (AgNO3) (Merck, Darmstadt, Germany) ranging from 0.1 to 50 µg/L was included. Rhodium (Merck, Germany) was used as an internal standard. The limit of detection (LODconc) and limit of quantification (LOQconc) were 4 and 13.5 ng/L respectively and they were calculated by the measurement of blank samples as mass concentration in the blank + 3 × SD and 10 × SD respectively. All samples were analyzed in triplicate.
The particle size, size distribution, mass- and number-based particle concentration of pristine AgNPs suspensions and AgNO3 solution were quantified using spICP-MS. The method for the spICP-MS measurements was described previously (Peters et al. Citation2015). Briefly, the sample flow rate to the nebulizer was determined before the start of each series of measurements. The dwell time was set at 3 ms and the total acquisition time was set at 60 s. A diluted suspension of 60 nm gold NPs (Nanocomposix, USA) with a mass concentration of 50 ng/L was used before each analysis to verify the performance of the ICP-MS and to determine the transport efficiency. A calibration curve of ionic silver (AgNO3) with a concentration range of 0.1–20 µg/L was used. The time scan data of the spICP-MS measurements were exported as .csv files, and the calculation of the particle size, size distribution, and mass- and number-based concentrations from the spICP-MS data were performed using a dedicated spreadsheet. Details about the spreadsheet have been described previously (Peters et al. Citation2015). The LODconc and LOQconc were estimated to be 22 and 75 ng/L respectively and they were calculated by the measurement of blank samples as mass concentration in the blank + 3 × SD and 10 × SD respectively. The NP size was calculated based on the particle mass, assuming spherical particles. The size detection limit (LODsize) was 20 nm and accordingly any silver particles with sizes below this limit were included in the ionic silver fraction.
In vitro digestion of AgNPs and AgNO3
The two AgNPs suspensions and the AgNO3 solution were digested using an in vitro human gastrointestinal digestion model with a pH gradient ranging from 7 (mouth), to 5 (stomach), to 7 (intestine). The pH of 5 in the stomach is meant to resemble the conditions upon food consumption which leads to a decrease of stomach acidity, opposed to a pH of ∼2 under fasted conditions (Minekus et al. Citation2014). Briefly, all digestive juices were freshly prepared and warmed to 37 °C before use as described in (Versantvoort et al. Citation2005; Walczak et al. Citation2012).
Table 1. Composition of the artificial digestion fluids of the in vitro digestion model (per 1000 mL) (Versantvoort et al. Citation2005; Walczak et al. Citation2012).
A volume of 1 mL, with a concentration of 500 mg/L of AgNPs suspensions or 95 mg/L AgNO3 solution, was mixed with 3 mL of saliva (pH 6.8 ± 0.1) and incubated (head-over-heals at 55 rpm) for 5 min at 37 °C to simulate the digestion in the mouth. Subsequently, 6 mL of gastric juice (pH 1.3 ± 0.1) was added to the mixture and the pH was checked and adjusted to 5 ± 0.5 with NaOH (5 M) to simulate the digestion in the stomach. The samples were further incubated while rotating at head-over-heals at 37 °C for 2 h. Lastly, 6 mL of duodenal juice (pH 8.1) and 3 mL of bile (pH 8.2) were added to the mixture and the pH was checked and adjusted to 6.5 ± 0.5 with NaOH (1 M) or HCl (37%) to simulate the digestion in the small intestine. Again, the samples were incubated while rotating head-over-heals at 37 °C for 2 h. The complete mixture of all the digestive juices is further referred to as chyme.
The total silver content of the IVD AgNPs suspensions and AgNO3 solution was analyzed using ICP-MS as described earlier. spICP-MS measurements were used to quantify the particle size, size distribution, and mass- and number-based concentrations of the IVD AgNPs suspensions and AgNO3 solution as described earlier. The silver ions calibration curves were prepared in a similar matrix as the samples of interest.
Cell culture
A co-culture of adherent human epithelial colorectal adenocarcinoma cells (Caco-2; ATCC® HTB-37™; USA) and human colon adenocarcinoma mucus secreting cells (HT29-MTX; ECACC, Ireland) was prepared of cells at passage numbers of 25–40 and 8–40, respectively. Both cell lines were cultured and separately maintained in 75 cm2 cell culture flasks (Corning®; Corning, NY, USA) at 37 °C in a humidified 5% CO2 atmosphere in DMEM+.
Cell viability
Cytotoxic effects of the pristine and IVD AgNPs and AgNO3 were determined using the WST-1 cell viability assay (Roche, Basel, Switserland). Each well was seeded with 100 µl of a 1 × 10⁵ cells/mL suspension with a 3:1 ratio Caco-2: HT29-MTX in DMEM+ in 96-well flat bottom plates (Grenier bio-one, Alphen aan den Rijn, The Netherlands). Plates were incubated at 37 °C, 5% CO2 for 24 h. The attached cells were then exposed to 100 µL/well of freshly prepared dilutions (100–100,000 µg/L) of pristine and (500–2500 µg/L) IVD AgNPs suspensions and/or (125–500 µg/L) AgNO3 solution. All the IVD AgNPs and AgNO3 dilutions had a 9:1 DMEM+: chyme ratio, to prevent toxicity of the chyme. After 24 h of exposure, the exposure medium was discarded, and the cells were washed once with 100 µL/well HBSS buffer before addition of 10 µL of WST-1 solution with 90 µL of DMEM+ (without phenol red) to each well. The plates were incubated for 4 h at 37 °C, 5% CO2 and absorbance was read at 490 and 630 nm on a plate reader (BioTek Synergy™ HT Multi-Mode Microplate reader, Winooski, VT, USA). The cell viability was expressed as % of control. DMEM+ was used as a negative control and Triton-X100 (0.25%) (Sigma) was used as a positive control.
In vitro intestinal monolayer barrier integrity assessment
The Caco-2 and HT29-MTX cells were grown in a ratio of 3:1 (Kleiveland Citation2015; Walczak, Kramer, Hendriksen, Helsdingen, et al. Citation2015a) at a density of 4 x 10⁴ cells/cm2 on the upper side of transwell polyester inserts (0.4 μm pore size, 1.12 cm2 surface area) (Corning, USA) for 21 days. The integrity of the monolayer was assessed before AgNPs exposure by measuring the transepithelial electrical resistance (TEER) values using a Millicell ERS-2 Epithelial Volt- Ohm Meter (Millipore, USA). On day 21, only inserts with TEER values above 200 Ω.cm2 before exposure were used. In addition, a maximum of 20% reduction in TEER values was accepted after exposure.
Additionally, the transport efficacy of each of three different integrity markers namely; lucifer yellow (LY) (Sigma, USA) and low (4 kDa) and high (10 kDa) molecular weights fluorescein isothiocyanate dextrans (FITC-D) (Sigma, USA) was evaluated in the presence and absence of EGTA (a tight-junction disruptor) (Sigma, USA) to assess the cell monolayer integrity. In the absence of EGTA, 500 µL/insert of 1 mg/mL in DMEM+ of the integrity markers were added apically. After 1 h incubation at 37 °C, the basolateral medium was collected, and the transport of the markers was determined by measuring the fluoresce at 485/530 nm using the fluorescence plate reader. For samples evaluated in the presence of EGTA, 500 µL of a solution of 2.5 mM EGTA/DMEM+ was added apically and basolaterally followed by incubation of the monolayers for 1 h at 37 °C. The wells were then refreshed with 2.5 mM EGTA/DMEM+ solution in the basolateral compartment while apically the integrity markers in DMEM+ were added at a concentration of 1 mg/mL. The cells were incubated for 1 h at 37 °C and the basolateral medium was collected and analyzed for the presence of the markers as described above.
Cellular uptake/association and transport of AgNPs and AgNO3
The cellular monolayer was exposed apically to 500 μL/insert of 250, 500, and 2500 µg/L of pristine or IVD AgNPs suspensions and to 250 µg/L of pristine or IVD AgNO3 solutions for 24 h at 37 °C, 5% CO2. Then, the media from the apical and basolateral compartments were collected and the cells were collected by trypsinzation and sonication (40 kHz for 15–20 min) to lyse the cells. The total silver content of all the samples was analyzed using ICP-MS as described earlier. spICP-MS was used to quantify the particle size, size distribution, and mass- and number-based concentrations of all samples as described above.
Confocal microscopy
For confocal imaging, Caco-2/HT29-MTX co-cultures were cultured in transwells and exposed to both pristine and IVD AgNPs suspensions and AgNO3 solution using similar conditions as used in the uptake/association and transport experiments. After exposure, the exposure medium was discarded, and the cells were fixed with 4% paraformaldehyde (Sigma, USA) for 15 min. The cells were washed 3 times with PBS for 5 min after discarding the fixation solution. The cells were permeabilized with 0.25% Triton X-100/PBS for 15 min. The cells were then washed again 3 times with PBS for 5 min before incubating them with the blocking buffer (1% BSA in PBS) for 30 min. After discarding the blocking buffer, Phalloidin – Alexa 488 (6 units) (Dyomics, Germany) was added to stain cellular actin and the cells were incubated for 30 min. Cells were washed three times with PBS before incubating the cells for 10 min with RedDot-2 (1:200) (Biotium, USA) to stain the nuclei. Finally, the cells were washed with PBS and stored in the dark until analysis. The cells were analyzed using a confocal laser scanning microscope (SP5X-SMD; Leica Microsystems, Germany). Samples were excited with 665 and 495 nm lasers and backscattered light was used to detect AgNPs using a 543 nm laser. All preparations steps have been done at room temperature.
Transmission electron microscopy energy-dispersive spectroscopy (TEM-EDS) analysis
Following the 24 h exposure of the Caco-2/HT29-MTX co-culture to pristine or IVD AgNPs or AgNO3, samples from the basolateral compartments were withdrawn. The samples were deposited on a holey carbon coated Cu TEM grid (Agar Scientific, UK) and dried at room temperature before examination using a TEM-EDS system. The grid examination was performed on a JEM‐2100 equipped with EDS system of OI Aztec 80 mm X‐max detector.
Statistical analysis
Each data point of all the experiments performed represents the average from three replicates (n = 3) and the results are shown as mean ± standard deviation after analysis by Prism® (v.8.0.1; GraphPad®, USA) software. Bonferroni’s post-test was used to test statistical significance upon performing a one-way analysis of variance (ANOVA). A p-value < 0.05 was considered significant.
Results
Physicochemical characterization of the pristine AgNPs suspensions and AgNO3 solution
Two differently coated AgNPs were used in this study: lipoic acid-coated (LA) AgNPs and citrate-coated (Cit) AgNPs. The nominal sizes provided by the supplier of the (LA) and (Cit) AgNPs measured by transmission electron microscopy (TEM) were 51 ± 5 and 52 ± 6 nm, respectively. The hydrodynamic sizes and the ζ – potential of both AgNPs, measured in nano-pure water after 0 and 24 h incubation at 37 °C, are listed in . There were no significant differences in the hydrodynamic diameters or the charges of both AgNPs over time.
Table 2. Physicochemical characteristics of AgNPs.
The suspensions of both AgNPs and AgNO3 were analyzed as pristine suspensions and after in vitro digestion (IVD suspensions) to quantify the total silver content and silver in particulate form (AgNPs) using ICP-MS and spICP-MS, respectively ().
Figure 1. Silver content in pristine and in vitro digested (IVD) AgNPs suspensions and AgNO3 solution. (a) Silver content measured as total Ag using ICP-MS. (b) Silver content measured as AgNPs using spICP-MS. Concentrations are given as the mean ± SD (n = 3). *Significant difference between the pristine and IVD suspension of the same AgNPs (p < 0.05).
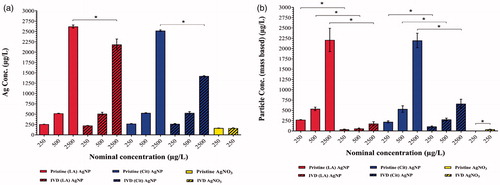
The AgNPs content in the pristine suspensions of both types of AgNPs was equal to the total Ag content and corresponded to the theoretical (nominal) concentration. The pristine solution of AgNO3 did not contain detectable levels of AgNPs.
Upon IVD, the total Ag content of both AgNPs suspensions and the AgNO3 solution remained unchanged (compared to the pristine suspension) except the highest concentration of AgNPs (). The AgNPs content of both types of AgNPs was significantly reduced upon digestion at all concentrations tested. The IVD (LA) AgNPs suspension showed a reduction in particulate silver (mass-based) between 86 and 92% while the IVD (Cit) AgNPs suspension showed a reduction between 48 and 70% in particulate silver (mass-based), compared to the pristine suspensions. Interestingly, a low but significantly elevated concentration of newly formed silver particulates (de novo) was observed in the AgNO3 solution upon digestion ().
Assessment of AgNPs and AgNO3 cytotoxicity
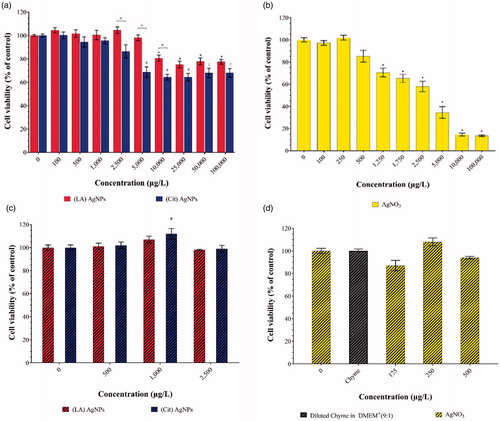
The viability of the Caco-2/HT29 co-culture was assessed using the WST-1 assay (cellular mitochondrial activity determination) upon 24 h exposure to increasing concentrations of pristine or IVD AgNPs suspensions and AgNO3 solution (). The pristine AgNO3 induced concentration dependent cytotoxicity. The cell viability of all the concentrations used in the subsequent experiments of pristine or IVD AgNPs suspensions (up to 2500 µg/L) and AgNO3 solution (up to 500 µg/L) was higher than 85%.
Figure 2. Cell viability of a Caco-2/HT29-MTX co-culture after 24 h exposure to a concentration range of pristine: (a) (LA) and (Cit) AgNPs and (b) AgNO3, and IVD; (c) (LA) and (Cit) AgNPs and (d) AgNO3 using the WST-1 viability assay. Viability is given as a percentage of the control (mean ± SD; n = 3). ×Significant difference between AgNPs at the same concentration (p < 0.05). *,#Significant difference between any concentration and the control within the same treatment (p < 0.05).
Cellular barrier integrity assessment
For the transport studies, monolayers of Caco-2/HT29-MTX coculture were grown for 21 days in transwells to allow cells to form a tight junction and differentiated monolayer. Only monolayers that had TEER values > 200 Ω.cm2 were used for subsequent cellular uptake/association and transport studies. The monolayer integrity was also confirmed by assessing the transport of lucifer yellow (LY), and 4 kDa and 10 kDa FITC-dextrans in the presence or absence of a tight junction disruptor (EGTA). The transport of the three markers was very limited (< 0.5%) in the absence of the EGTA, while upon addition of EGTA the transport increased significantly (up to 20- to 140-fold) (Supplementary Material, Figure S1).
Cellular uptake/association of AgNPs and AgNO3 by monolayers of intestinal epithelial cells
Monolayers of 21 days old Caco-2/HT29-MTX coculture were exposed for 24 h to increasing concentrations of either pristine or IVD AgNPs suspensions or AgNO3 solution. The resulting cellular uptake/association of Ag was quantified and expressed as total Ag and AgNPs ().
Figure 3. Silver uptake/adhesion of (LA) and (Cit) AgNPs and AgNO3 in differentiated Caco-2/HT29-MTX cells after 24 h exposure, measured and expressed as total Ag after (a) exposure to pristine AgNPs and AgNO3; (c) exposure to in vitro digested AgNPs and AgNO3. Also expressed as AgNPs after (b) exposure to pristine AgNPs and AgNO3; (d) exposure to in vitro digested AgNPs and AgNO3. Concentrations are given as the mean ± SD (n = 3). Values with different letters are significantly different at the same concentration (p < 0.05).
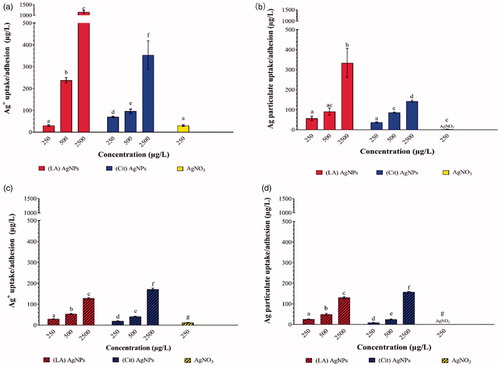
The total Ag and AgNPs content in the cell fraction increased in a concentration-dependent manner for both AgNPs irrespective of their treatment (pristine or IVD) (). Upon the pristine AgNPs exposure, the total Ag contents in the cellular fraction of (LA) AgNPs samples were significantly higher than that in the (Cit) AgNPs samples (). While the cellular fraction content of AgNPs exposed to (LA) AgNPs was significantly higher at the highest concentration compared to (Cit) AgNPs samples (). After IVD, comparable levels of Ag and AgNPs were detected in the (LA) and (Cit) AgNPs samples except for the highest concentration where the (Cit) AgNPs samples had a significant higher Ag and AgNPs concentrations than the (LA) AgNPs samples ().
In the cell fraction samples upon exposure to both pristine and IVD AgNO3, mainly total Ag was detected, but after IVD a limited number of AgNPs was detected.
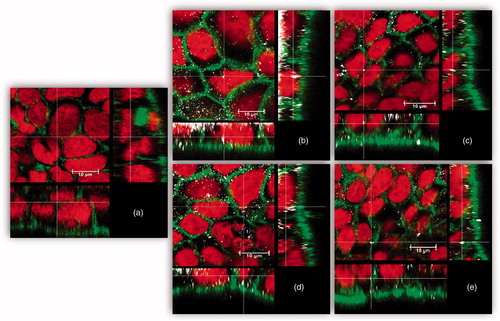
In general, the cellular silver contents as total Ag or AgNPs upon exposure to IVD AgNPs was significantly lower compared to exposure to pristine AgNPs. Confocal microscopy was applied to evaluate cellular internalization of both AgNPs (pristine or IVD). Various planes through the cells were assessed showing that clusters of silver or AgNPs were mainly localized in the cytoplasm and to some extent in the nucleus ().
Figure 4. Uptake/adhesion of AgNPs after 24 h exposure. Confocal microscopy images of 21-day-old Caco-2/HT29-MTX cells. (a) without exposure to AgNPs (negative control), after exposure to 2500 μg/L, (b) pristine (LA) AgNPs, (c) pristine (Cit) AgNPs, (d) IVD (LA) AgNPs, and (E) IVD (Cit) AgNPs. Nuclei were stained in red (RedDot-2), actin was stained in green (Alexa-488 Phalloidin) and AgNPs are shown in white (back scatter).
Transport of AgNPs and AgNO3 across monolayers of intestinal epithelial cells
The transport of either pristine or IVD AgNPs and AgNO3 through the Caco-2/HT29-MTX monolayers was minimal (<0.1%) either as total Ag or AgNPs. Also, using TEM-EDS no AgNPs could be detected in samples from the basolateral compartments in any of the exposure groups. Only in small areas of the examined grids, an increased number of silver counts were found, but they were not visible in a particulate form (data not shown).
spICP-MS size distribution in pristine and IVD suspensions
The spICP-MS measurements were transformed into size distribution plots depicting the number of particles corresponding to each AgNPs diameter cluster (5 nm) on y- and x-axis, respectively (). The number of particles measured in the AgNPs suspensions and AgNO3 solution are presented in Supplementary Material, Table S1. There was no apparent difference in the size distributions of the pristine suspensions of both AgNPs, with a median size of 50 nm (). No AgNPs could be detected in the pristine solution of AgNO3 ().
Figure 5. Number-weighted size distributions generated by spICP-MS measurements in exposure suspensions. (a) 500 µg/L pristine (LA) AgNPs, (b) 500 µg/L pristine (Cit) AgNPs, (c) 250 µg/L pristine AgNO3, (d) (LA) 500 µg/L IVD AgNPs, (e) 500 µg/L IVD (Cit) AgNPs, and (f) 250 µg/L IVD AgNO3.
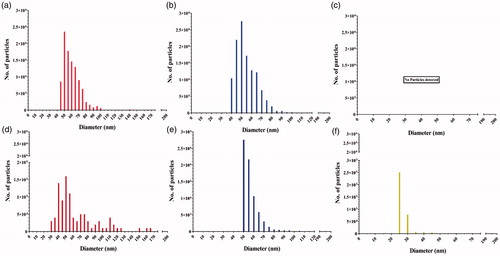
In vitro digestion affected the size and size distribution of (LA) AgNPs, as the mass–concentration were reduced (∼90% lower) compared to the pristine samples (; also reflected in ). In addition, the size distribution curves of the IVD suspensions showed broadened distributions, indicating the presence of both smaller and larger particles. The size distribution of the (Cit) AgNPs was less affected by in vitro digestion, where the majority of both the pristine and IVD (Cit) AgNPs had a median size of 50 nm (). The total number of particles was reduced (∼38% lower) compared to the pristine particles. Upon in vitro digestion, newly formed silver particulates (de novo) were found in the AgNO3 solution with a median size of 25 nm (). All the size distributions of the three concentrations of AgNPs were following similar trend, accordingly all the size distributions reported in are only for of 500 µg/L of AgNPs and 250 µg/L AgNO3 for simplicity and clarity purposes.
spICP-MS size distribution in cellular fraction
The size distributions () and number of particles (Supplementary Material, Table S1) of both AgNPs measured in the cellular fraction were different depending on the surface chemistry of the AgNPs and on whether they were pristine or IVD. Following exposure to pristine (LA) AgNPs, a broad size distribution was observed without a clear peak (). This distribution was highly different from the size distribution in the pristine suspension (). For the pristine (Cit) AgNPs, the cellular fraction has AgNPs with a median size of 35 nm and the size distribution () was comparable to that of the pristine (Cit) AgNPs suspension (). Among pristine AgNPs, the number of NPs in the cell fraction exposed to (LA) AgNPs (3.1 × 10⁵ ± 4.6 × 10⁴) was significantly lower than the number of particles detected in the cells exposed to (Cit) AgNPs (2.6 × 10⁶ ± 1.7 × 10⁵).
Figure 6. Number-weighted size distributions generated by spICP-MS measurement of Caco-2/HT29-MTX cellular silver content after 24 h exposure to (a) 500 µg/L pristine (LA) AgNPs, (b) 500 µg/L pristine 50 nm (Cit) AgNPs, (c) 250 µg/L pristine AgNO3, (d) 500 µg/L IVD (LA) AgNPs, (e) 500 µg/L IVD (Cit) AgNPs, and (f) 250 µg/L IVD AgNO3.
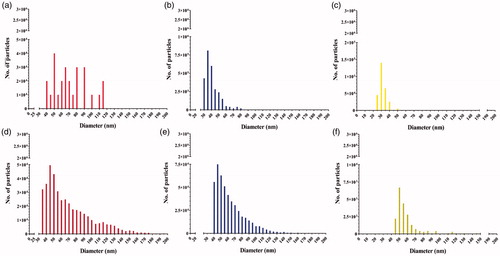
The size distribution of IVD (LA) AgNPs in the cell fraction – compared to the IVD suspension distribution of these AgNPs () – was right skewed with a median size of 45 nm (). The broadening of the size distribution and longer tail showed the appearance of bigger particles (aggregates) up to 200 nm. The size distribution of IVD (Cit) AgNPs in the cell fraction () also showed a longer tail compared to the IVD (Cit) AgNPs suspension (), showing bigger particles (aggregates) up to 200 nm with a median size of 50 nm. Among IVD AgNPs, the number of NPs in the cell fraction exposed to (LA) AgNPs (4.2 × 10⁵ ± 3.6 × 10⁴) was comparable to the number of particles detected in the cells exposed to (Cit) AgNPs (4.4 × 10⁵ ± 6 × 10⁴).
The cellular fraction exposed to pristine AgNO3 contained particulate Ag with a median size of 30 nm (), while the pristine AgNO3 solution did not contain particles (). Upon exposure to IVD AgNO3 solution, the cellular fraction contained silver particulates with a median size of 50 nm ( and ). The number of particles measured in the cellular fraction upon exposure to AgNPs and AgNO3 are presented in Supplementary Material, Table S1. All the size distributions of the three concentrations of AgNPs were following similar trend, accordingly all the size distributions reported in are only for of 500 µg/L of AgNPs and 250 µg/L AgNO3 for simplicity and clarity purposes.
Discussion
This study aimed to investigate the impact of the different biochemical conditions within the human digestive tract – mimicked in in vitro incubations – on the intestinal fate and subsequent cellular uptake/association and passage across a monolayer of differentiated Caco-2/HT29-MTX intestinal cells. We observed that a significant fraction of the AgNPs dissolved after the in vitro digestion. Exposure of the monolayers of intestinal cells to increasing concentrations of pristine AgNPs resulted in a concentration dependent increase of total Ag and AgNPs contents in the cellular fractions. These concentrations were significantly lower following the exposure to the IVD AgNPs. Finally, passage of silver as total Ag or AgNPs was not detectable following the exposure to either pristine or IVD AgNPs.
The in vitro digestion model used here was adopted from the model described by Versantvoort et al. (Versantvoort et al. Citation2005; Walczak et al. Citation2012). The pH in the gastric digestion phase was set at 5 ± 0.5 to simulate the gastric environment upon ingestion of a meal (Gardner, Ciociola, and Robinson Citation2002; Minekus et al. Citation2014; Richardson and Feldman Citation1986). While this is the most realistic exposure scenario, it might underestimate the dissolution of AgNPs if consumed in fasted (empty stomach) conditions, where the stomach pH is lower (pH 2) (Liu et al. Citation2012). Before in vitro digestion (i.e. the pristine suspensions), both AgNPs suspensions contained similar masses of total Ag and AgNPs, indicating that before in vitro digestion, the silver was present mainly in particulate form. In addition, the spICP-MS derived size distributions of both AgNPs suspensions were highly comparable.
Upon completion of all three digestion phases (oral, gastric and intestinal), the total Ag content in both of the IVD AgNPs suspensions and the AgNO3 solution was similar to that of the corresponding pristine suspensions and solution, except for the highest concentration of both AgNPs, with the total Ag content being ∼10% and ∼40% lower for (LA) and (Cit) AgNPs, respectively. The reduction in total Ag content of samples taken from the highest concentrations could be due to a lower (analytical) recovery due to adsorption of AgNPs to the digestion matrix and tubing, and/or to the short centrifugation step applied to the AgNPs samples after digestion to spin down large protein precipitates before ICP-MS measurement (Versantvoort et al. Citation2005) to which the AgNPs could potentially adsorbed (Noireaux et al. Citation2019). This centrifugation set is required to avoid the presence of large proteins that destabilize the plasma of the ICP-MS (Noireaux et al. Citation2019). On the other hand, a significant reduction in the mass- and number-based AgNPs content was observed for both AgNPs upon completion of all digestion phases, demonstrating that the in vitro digestion could induce dissolution, aggregation, or protein binding of the AgNPs (Böhmert et al. Citation2014). Significantly more of the (Cit) AgNPs endured the digestion conditions than the (LA) AgNPs, which is most likely due to the differences in surface chemistry of the AgNPs which is influencing the adsorption and agglomeration characteristics of the AgNPs. For example, the dissolution of (Cit) AgNPs in fresh river water was reported by Li and Lenhart to be much slower than that of tween coated AgNPs, where (Cit) AgNPs needed an incubation of 15 days to dissolve to the same extent as the tween coated AgNPs within 6 hours (Li and Lenhart Citation2012). Besides, in cell culture medium, (Cit) AgNPs have been shown to dissolve much slower compared to 5-kDa PEG-thiol-coated AgNPs (Zook et al. Citation2011). Dissolution of (LA) coated AgNPs, reported in the present study, has not been studied before.
Interestingly, a significant number of silver particles was detected in the AgNO3 solution after in vitro digestion, whereas in its pristine solution no particles were detected. The digestive juices have a high ionic strength including a high concentration of chloride, which is known to form particulate complexes with silver ions or the de novo formed AgNPs (Huynh and Chen Citation2011; Zook et al. Citation2011). This could explain the higher amount detected of cellular de novo formed AgNPs upon exposure to pristine AgNO3 than exposure to IVD AgNO3. Formation of de novo complexes of silver ions with chloride, sulfur or thiocyanate has been described before both in vitro (Kästner, Lampen, and Thünemann Citation2018; Walczak et al. Citation2012; Wildt et al. Citation2016) and in vivo (Levard et al. Citation2011; Loeschner et al. Citation2011).
In the present study, we used monolayers of differentiated Caco-2/HT29-MTX cells. The presence of mucus producing cells increases the physiological relevance of the model compared to using Caco-2 cells alone (Georgantzopoulou et al. Citation2015; Hilgendorf et al. Citation2000; Mahler, Shuler, and Glahn Citation2009; Yuan et al. Citation2013). Non-cytotoxic concentrations of AgNPs (and ionic controls) were used in our study. As chyme from the in vitro digestion model results in cytotoxic responses, the chyme was diluted in a 1:9 ratio with cell culture medium as described previously to avoid any cytotoxic effects (Böhmert et al. Citation2014; Lichtenstein et al. Citation2015; Walczak, Kramer, Hendriksen, Helsdingen, et al. Citation2015a).
After 24 hours of exposure to suspension of three concentrations of either pristine or IVD AgNPs, the total Ag and AgNPs contents of the cellular fraction increased in a concentration dependent manner. Both the total Ag and AgNPs contents in the cellular fractions were significantly lower following exposure to IVD AgNPs compared to the exposure to similar concentrations of pristine suspensions of AgNPs. Similar observations were reported for a differentiated Caco-2 cell model exposed to pristine and IVD AgNPs, although in that study only the total Ag content was measured (Lichtenstein et al. Citation2015). Furthermore, cellular uptake of total and partiulate silver or titanium was also shown to be concentration dependent after 24 hours exposure in Neuro-2a cells (Hsiao et al. Citation2016).
The total Ag concentration found in the cellular fraction was in general higher than the AgNPs concentration, whereas upon digestion, the total Ag and AgNPs levels in the cellular fractions were highly comparable. As AgNPs tends to dissolve intracellularly (Singh and Ramarao Citation2012) and form protein corona upon IVD (Walczak, Kramer, Hendriksen, Helsdingen, et al. Citation2015a), it is likely that the in vitro digestion is protecting the AgNPs from dissolving inside the cells. In general, the AgNPs content in the cellular fraction appeared to be higher in the (LA) AgNPs samples than in the (Cit) AgNPs samples, following exposure to pristine AgNPs. The difference in the cellular total Ag content between (LA) and (Cit) AgNPs could be explained by possible formation of different types of protein coronas on the AgNPs due to their differences in surface chemistry, as previously described for AgNPs and other NPs (Abdelkhaliq et al. Citation2018; Lesniak et al. Citation2012; Monteiro-Riviere et al. Citation2013; Tenzer et al. Citation2013). Another factor influencing the interaction of AgNPs with cells could be the stability of the coating which might be affected by the ionic strength, protein content, or pH of the medium (Sharma et al. Citation2014).
Although spICP-MS is a very sensitive technique to quantify total Ag and AgNPs concentrations, it does not provide insights in the (sub)cellular localization of the Ag. Here, the confocal imaging showed that a fraction of the AgNPs was internalized in the cells.
Following exposure of the monolayers to AgNO3 (pristine and IVD), AgNPs were detected in the cell fraction which suggests the de novo formation of AgNPs. However, the sizes of these AgNPs differed with a peak shift from 30 nm in the pristine samples to 50 nm in the digested samples. The de novo AgNPs are most likely to be firstly formed as silver salt complexes following the in vitro digestion and upon cellular exposure and internalization, these complexes may further interact with other cellular molecules rich in sulfur (i.e. cysteine and glutathione) and grow forming de novo nanoparticles in situ (Loeschner et al. Citation2011; Maurer et al. Citation2014; Wildt et al. Citation2016).
Lastly, we assessed the passage of total Ag and AgNPs across the monolayers of Caco-2/HT29-MTX cells. We performed all our experiments in transwells, and sampled the basolateral compartment following an exposure to both pristine and IVD AgNPs suspensions; the transport of silver as either total Ag or AgNPs was < 0.1%. From an analytical perpective, the sensitivity and power of the methods used for detection and quantification of Ag and AgNPs (ICP-MS and spICP-MS respectively) were high compared to other methods that have been used before. That explains, why we could use low exposure concentrations (i.e. 250 µg/L), and still were able to detect total Ag and AgNPs in the cellular fractions. Other studies reported that the silver content in the cellular fractions after a higher exposure concentration (i.e. 1000 µg/L) of either pristine or IVD AgNO3 solutions for the same exposure time was lower than the LOQ (20 µg/cm2) (Lichtenstein et al. Citation2015).
In addition, the basolateral samples were screened for AgNPs using TEM-EDS, but again no particles were detected. Previously, we have shown minimal passage (less than 1%) of smaller (20 nm) AgNPs across a monolayer of Caco-2/M-cells exposed for 4 h (Bouwmeester et al. Citation2011). For larger AgNPs it can be expected that the passage/transport is lower, in addition, we currently used membranes with a smaller pore size that might hinder the transport of the AgNPs (Cartwright et al. Citation2012). However, in vivo studies indicate that silver can reach the systemic circulation, as oral feeding studies with rodents have reported low oral bioavailability of silver after exposure to AgNPs of different sizes (Loeschner et al. Citation2011; van der Zande et al. Citation2012).
The Caco-2/HT29-MTX intestinal model shows potential for screening AgNPs. Addition of M-cells to the model is not of added value in the current case, as it was reported before to reduce the transport of NPs to a similar level of transport through Caco-2 monolayer where no mucus is present (Walczak, Kramer, Hendriksen, Tromp, et al. Citation2015b). In another study, AgNPs transport via a Caco-2/M-cell intestinal model could be detected (Bouwmeester et al. Citation2011) but the AgNPs used were of smaller size and in pristine status which might facilitate the possibility of detection. Applying longer exposure periods or higher nontoxic concentrations of AgNPs might increase the chance of detecting and quantifying transported AgNPs, owing to the limitation of the AgNPs stock concentration and the necessity to high dilution upon the digestion to avoid chyme toxicity. The broad spectrum of AgNPs with diverse physicochemical characteristics might exhibit different behaviors upon in vitro digestion and intestinal uptake and transport which highlight the importance of detailed characterization of AgNPs studied and the difficulty to group the AgNPs.
Conclusions
The surface chemistry of AgNPs had a significant influence on their dissolution and on their biological interactions with the Caco-2/HT29-MTX intestinal model. The (LA) AgNPs dissolved to a significantly higher extent during the digestion process compared to (Cit) AgNPs. Cellular uptake/association was in general higher for the (LA) AgNPs, although this difference disappeared after digestion. Upon in vitro digestion, the cellular uptake/association of both AgNPs decreased compared to the cellular uptake/association of pristine AgNPs. Transport of AgNPs across the monolayers of intestinal cells was < 0.1%. De novo formation of AgNPs was shown in the suspensions and in the cellular fractions upon digestion and cellular exposure of cells to AgNPs and AgNO3.
The combination of in vitro digestion and intestinal barrier models used here confirms the interference and the influence of the digestion process on the biological interaction of the AgNPs upon oral ingestion. This highlights the need to take in vitro digestion into account when studying nanoparticle toxicokinetics and toxicodynamics in cellular in vitro model systems. Additionally, this combination is of added value to the safer-by-design NP development by identifying the physicochemical property (here the surface chemistry) that affects the uptake/association and cellular internalization.
TNAN-2019-OR-0184-File002.docx
Download MS Word (124.6 KB)Acknowledgments
The authors would like to thank Kerstin Jurkschat (Oxford University, UK) for TEM-EDS analysis.
Disclosure statement
The authors declare that they have no competing interests.
Correction Statement
This article has been republished with minor changes. These changes do not impact the academic content of the article.
Additional information
Funding
References
- Abdelkhaliq, A.,. M. van der Zande, A. Punt, R. Helsdingen, S. Boeren, J. J. M. Vervoort, I. M. C. M. Rietjens, and H. Bouwmeester. 2018. “Impact of Nanoparticle Surface Functionalization on the Protein Corona and Cellular Adhesion, Uptake and Transport.” Journal of Nanobiotechnology 16(1): 70. doi:10.1186/s12951-018-0394-6.
- Abdolahpur Monikh, F., L. Chupani, E. Zusková, R. Peters, M. Vancová, M. G. Vijver, P. Porcal, and W. J. G. M. Peijnenburg. 2019. “Method for Extraction and Quantification of Metal-Based Nanoparticles in Biological Media: Number-Based Biodistribution and Bioconcentration.” Environmental Science & Technology 53: 946–953. doi:10.1021/acs.est.8b03715.
- Bailey, C. A., P. Bryla, and A. W. Malick. 1996. “The Use of the Intestinal Epithelial Cell Culture Model, Caco-2, in Pharmaceutical Development.” Advanced Drug Delivery Reviews 22: 85–103. doi:10.1016/S0169-409X(96)00416-4.
- Böhmert, L., M. Girod, U. Hansen, R. Maul, P. Knappe, B. Niemann, S. M. Weidner, A. F. Thünemann, and A. Lampen. 2014. “Analytically Monitored Digestion of Silver Nanoparticles and Their Toxicity on Human Intestinal Cells.” Nanotoxicology 8(6): 631–642. doi:10.3109/17435390.2013.815284.
- Bouwmeester, H., J. Poortman, R. J. Peters, E. Wijma, E. Kramer, S. Makama, K. Puspitaninganindita, H. J. P. Marvin, A. A. C. M. Peijnenburg, and P. J. M. Hendriksen. 2011. “Characterization of Translocation of Silver Nanoparticles and Effects on Whole-Genome Gene Expression Using an In Vitro Intestinal Epithelium Coculture Model.” ACS Nano 5(5): 4091. doi:10.1021/nn2007145.
- Cartwright, L., M. S. Poulsen, H. M. Nielsen, G. Pojana, L. E. Knudsen, M. Saunders, and E. Rytting. 2012. “In Vitro Placental Model Optimization for Nanoparticle Transport studies.” International Journal of Nanomedicine 7: 497–510. doi:10.2147/IJN.S26601.
- Chaudhry, Q., M. Scotter, J. Blackburn, B. Ross, A. Boxall, L. Castle, R. Aitken, and R. Watkins. 2008. “Applications and Implications of Nanotechnologies for the Food Sector.” Food Additives & Contaminants: Part A 25: 241–258. doi:10.1080/02652030701744538.
- Choi, J. I., S. J. Chae, J. M. Kim, J. C. Choi, S. J. Park, H. J. Choi, H. Bae, and H. J. Park. 2018. “Potential Silver Nanoparticles Migration from Commercially Available Polymeric Baby Products into Food Simulants.” Food Additives & Contaminants: Part A 35: 996–1005. doi:10.1080/19440049.2017.1411611.
- Ding, R., P. Yang, Y. Yang, Z. Yang, L. Luo, H. Li, and Q. Wang. 2018. “Characterisation of Silver Release from Nanoparticle-Treated Baby Products.” Food Additives & Contaminants: Part A 35: 2052–2061. doi:10.1080/19440049.2018.1480064.
- Gardner, J. D., A. A. Ciociola, and M. Robinson. 2002. “Measurement of Meal-Stimulated Gastric Acid Secretion by In Vivo Gastric Autotitration.” Journal of Applied Physiology 92(2): 427–434. doi:10.1152/japplphysiol.00956.2001.
- Georgantzopoulou, A., T. Serchi, S. Cambier, C. C. Leclercq, J. Renaut, J. Shao, M. Kruszewski, E. Lentzen, P. Grysan, S. Eswara, et al. 2015. “Effects of Silver Nanoparticles and Ions on a co-Culture Model for the Gastrointestinal Epithelium.” Particle and Fibre Toxicology 13(1): 9. doi:10.1186/s12989-016-0117-9.
- Hilgendorf, C., H. Spahn-Langguth, C. G. Regårdh, E. Lipka, G. L. Amidon, and P. Langguth. 2000. “Caco-2 Versus Caco-2/HT29-MTX co-Cultured Cell Lines: Permeabilities via Diffusion, Inside- and Outside-Directed Carrier-Mediated Transport.” Journal of Pharmaceutical Sciences 89(1): 63–75. doi:10.1002/(SICI)1520-6017(200001)89:1 < 63::AID-JPS7 > 3.0.CO;2-6.
- Hsiao, I. -L., F. S. Bierkandt, P. Reichardt, A. Luch, Y-J. Huang, N. Jakubowski, J. Tentschert, and A. Haase. 2016. “Quantification and Visualization of Cellular Uptake of TiO2 and Ag Nanoparticles: Comparison of Different ICP-MS Techniques.” Journal of Nanobiotechnology 14(1): 50. doi:10.1186/s12951-016-0203-z.
- Huynh, K. A., and K. L. Chen. 2011. “Aggregation Kinetics of Citrate and Polyvinylpyrrolidone Coated Silver Nanoparticles in Monovalent and Divalent Electrolyte Solutions.” Environmental Science & Technology 45: 5564–5571. doi:10.1021/es200157h.
- Imai, S., Y. Morishita, T. Hata, M. Kondoh, K. Yagi, J. -Q. Gao, K. Nagano, K. Higashisaka, Y. Yoshioka, and Y. Tsutsumi. 2017. “Cellular Internalization, Transcellular Transport, and Cellular Effects of Silver Nanoparticles in Polarized Caco-2 Cells Following Apical or Basolateral Exposure.” Biochemical and Biophysical Research Communications 484(3): 543–549. doi:10.1016/j.bbrc.2017.01.114.
- Kästner, C., A. Lampen, and A. F. Thünemann. 2018. “What Happens to the Silver Ions? – Silver Thiocyanate Nanoparticle Formation in an Artificial Digestion.” Nanoscale 10(8): 3650–3653. doi:10.1039/C7NR08851E.
- Kittler, S., C. Greulich, J. Diendorf, M. Köller, and M. Epple. 2010. “Toxicity of Silver Nanoparticles Increases During Storage Because of Slow Dissolution under Release of Silver Ions.” Chemistry of Materials 22(16): 4548–4554. doi:10.1021/cm100023p.
- Kleiveland, C. R. 2015. “Co-Cultivation of Caco-2 and HT-29MTX.” In The Impact of Food Bioactives on Health: In Vitro and Ex Vivo Models, edited by K Verhoeckx, P Cotter, I López-Expósito, C Kleiveland, T Lea, A Mackie, T Requena, D Swiatecka, H Wichers, 135–140. Cham: Springer International Publishing.
- Laborda, F., J. Jimenez-Lamana, E. Bolea, and J. R. Castillo. 2011. “Selective Identification, Characterization and Determination of Dissolved Silver(i) and Silver Nanoparticles Based on Single Particle Detection by Inductively Coupled Plasma Mass Spectrometry.” Journal of Analytical Atomic Spectrometry 26(7): 1362–1371. doi:10.1039/c0ja00098a.
- Lefebvre, D. E., K. Venema, L. Gombau, L. G. Valerio, J. Raju, G. S. Bondy, H. Bouwmeester, R. P. Singh, A. J. Clippinger, E-M. Collnot, et al. 2015. “Utility of Models of the Gastrointestinal Tract for Assessment of the Digestion and Absorption of Engineered Nanomaterials Released from Food Matrices.” Nanotoxicology 9(4): 523–542. doi:10.3109/17435390.2014.948091.
- Lesniak, A., F. Fenaroli, M. P. Monopoli, C. Åberg, K. A. Dawson, and A. Salvati. 2012. “Effects of the Presence or Absence of a Protein Corona on Silica Nanoparticle Uptake and Impact on Cells.” ACS Nano 6(7): 5845–5857. doi:10.1021/nn300223w.
- Levard, C., B. C. Reinsch, F. M. Michel, C. Oumahi, G. V. Lowry, and G. E. Brown. 2011. “Sulfidation Processes of PVP-Coated Silver Nanoparticles in Aqueous Solution: Impact on Dissolution Rate.” Environmental Science & Technology 45: 5260–5266. doi:10.1021/es2007758.
- Li, X., and J. J. Lenhart. 2012. “Aggregation and Dissolution of Silver Nanoparticles in Natural Surface Water.” Environmental Science & Technology 46: 5378–5386. doi:10.1021/es204531y.
- Lichtenstein, D., J. Ebmeyer, P. Knappe, S. Juling, L. Böhmert, S. Selve, B. Niemann, A. Braeuning, A. F. Thünemann, and A. Lampen. 2015. “Impact of Food Components During In Vitro Digestion of Silver Nanoparticles on Cellular Uptake and Cytotoxicity in Intestinal Cells.” Biological Chemistry 396(11): 1255. doi:10.1515/hsz-2015-0145.
- Lichtenstein, D., J. Ebmeyer, T. Meyer, A. -C. Behr, C. Kästner, L. Böhmert, S. Juling, B. Niemann, C. Fahrenson, S. Selve, et al. 2017. “It Takes More than a Coating to Get Nanoparticles Through the Intestinal Barrier In Vitro.” European Journal of Pharmaceutics and Biopharmaceutics 118: 21–29. doi:10.1016/j.ejpb.2016.12.004.
- Liu, J., Z. Wang, F. D. Liu, A. B. Kane, and R. H. Hurt. 2012. “Chemical Transformations of Nanosilver in Biological Environments.” ACS Nano 6(11): 9887–9899. doi:10.1021/nn303449n.
- Loeschner, K., N. Hadrup, K. Qvortrup, A. Larsen, X. Gao, U. Vogel, A. Mortensen, H. R. Lam, and E. H. Larsen. 2011. “Distribution of Silver in Rats following 28 Days of Repeated Oral Exposure to Silver Nanoparticles or Silver Acetate.” Particle and Fibre Toxicology 8(1): 18. doi:10.1186/1743-8977-8-18.
- López-Serrano, A., R. M. Olivas, J. S. Landaluze, and C. Cámara. 2014. “Nanoparticles: A Global Vision. Characterization, Separation, and Quantification Methods. Potential Environmental and Health Impact.” Analytical Methods 6(1): 38–56. doi:10.1039/C3AY40517F.
- Mahler, G. J., M. L. Shuler, and R. P. Glahn. 2009. “Characterization of Caco-2 and HT29-MTX Cocultures in an In Vitro Digestion/Cell Culture Model Used to Predict Iron Bioavailability.” Journal of Nutritional Biochemistry 20(7): 494–502. doi:10.1016/j.jnutbio.2008.05.006.
- Maurer, E. I., M. Sharma, J. J. Schlager, and S. M. Hussain. 2014. “Systematic Analysis of Silver Nanoparticle Ionic Dissolution by Tangential Flow Filtration: Toxicological Implications.” Nanotoxicology 8: 718–727. doi:10.3109/17435390.2013.824127.
- McCracken, C.,. A. Zane, D. A. Knight, E. Hommel, P. K. Dutta, and W. J. Waldman. 2015. “Oxidative Stress-Mediated Inhibition of Intestinal Epithelial Cell Proliferation by Silver Nanoparticles.” Toxicology In Vitro 29(7): 1793–1808. doi:10.1016/j.tiv.2015.07.017.
- Minekus, M.,. M. Alminger, P. Alvito, S. Ballance, T. Bohn, C. Bourlieu, F. Carrière, R. Boutrou, M. Corredig, D. Dupont, et al. 2014. “A Standardised Static In Vitro Digestion Method Suitable for Food – An International Consensus.” Food & Function 5: 1113–1124. doi:10.1039/C3FO60702J.
- Monteiro-Riviere, N. A., M. E. Samberg, S. J. Oldenburg, and J. E. Riviere. 2013. “Protein Binding Modulates the Cellular Uptake of Silver Nanoparticles into Human Cells: Implications for In Vitro to In Vivo Extrapolations?” Toxicology Letters 220(3): 286–293. doi:10.1016/j.toxlet.2013.04.022.
- Murdock, R. C., L. Braydich-Stolle, A. M. Schrand, J. J. Schlager, and S. M. Hussain. 2008. “Characterization of Nanomaterial Dispersion in Solution Prior to In Vitro Exposure Using Dynamic Light Scattering Technique.” Toxicological Sciences 101(2): 239–253. doi:10.1093/toxsci/kfm240.
- Mwilu, S. K., A. M. El Badawy, K. Bradham, C. Nelson, D. Thomas, K. G. Scheckel, T. Tolaymat, L. Ma, and K. R. Rogers. 2013. “Changes in Silver Nanoparticles Exposed to Human Synthetic Stomach Fluid: Effects of Particle Size and Surface Chemistry.” Science of the Total Environment 447: 90–98. doi:10.1016/j.scitotenv.2012.12.036.
- Nel, A., T. Xia, L. Mädler, and N. Li. 2006. “Toxic Potential of Materials at the Nanolevel.” Science 311(5761): 622–627. doi:10.1126/science.1114397.
- Noireaux, J., R. Grall, M. Hullo, S. Chevillard, C. Oster, E. Brun, C. Sicard-Roselli, K. Loeschner, and P. Fisicaro. 2019. “Gold Nanoparticle Uptake in Tumor Cells: Quantification and Size Distribution by sp-ICPMS.” Separations 6(1): 3. doi:10.3390/separations6010003.
- Peters, R., Z. Herrera-Rivera, A. Undas, M. van der Lee, H. Marvin, H. Bouwmeester, and S. Weigel. 2015. “Single Particle ICP-MS Combined with a Data Evaluation Tool as a Routine Technique for the Analysis of Nanoparticles in Complex Matrices.” Journal of Analytical Atomic Spectrometry 30(6): 1274–1285. doi:10.1039/C4JA00357H.
- Richardson, C. T., and M. Feldman. 1986. “Salivary Response to Food in Humans and Its Effect on Gastric Acid Secretion.” American Journal of Physiology-Gastrointestinal and Liver Physiology 250(1): G85–G91. doi:10.1152/ajpgi.1986.250.1.G85.
- Sharma, V. K., K. M. Siskova, R. Zboril, and J. L. Gardea-Torresdey. 2014. “Organic-Coated Silver Nanoparticles in Biological and Environmental Conditions: Fate, Stability and Toxicity.” Advances in Colloid and Interface Science 204: 15–34. doi:10.1016/j.cis.2013.12.002.
- Sieg, H., C. Kästner, B. Krause, T. Meyer, A. Burel, L. Böhmert, D. Lichtenstein, H. Jungnickel, J. Tentschert, P. Laux., et al. 2017. “Impact of an Artificial Digestion Procedure on Aluminum-Containing Nanomaterials.” Langmuir 33(40): 10726–10735. doi:10.1021/acs.langmuir.7b02729.
- Singh, R. P., and P. Ramarao. 2012. “Cellular Uptake, Intracellular Trafficking and Cytotoxicity of Silver Nanoparticles.” Toxicology Letters 213(2): 249–259. doi:10.1016/j.toxlet.2012.07.009.
- Stone, V., H. Johnston, and R. P. F. Schins. 2009. “Development of In Vitro Systems for Nanotoxicology: Methodological Considerations.” Critical Reviews in Toxicology 39(7): 613–626. doi:10.1080/10408440903120975.
- Tenzer, S., D. Docter, J. Kuharev, A. Musyanovych, V. Fetz, R. Hecht, F. Schlenk, D. Fischer, K. Kiouptsi, C. Reinhardt, et al. 2013. “Rapid Formation of Plasma Protein Corona Critically Affects Nanoparticle Pathophysiology.” Nature Nanotechnology 8(10): 772–781.
- van der Zande, M., A. K. Undas, E. Kramer, M. P. Monopoli, R. J. Peters, D. Garry, E. C. Antunes Fernandes, P. J. Hendriksen, H. J. P. Marvin, A. A. Peijnenburg, et al. 2016. “Different Responses of Caco-2 and MCF-7 Cells to Silver Nanoparticles Are Based on Highly Similar Mechanisms of Action.” Nanotoxicology 10(10): 1431–1441. doi:10.1080/17435390.2016.1225132.
- van der Zande, M., R. J. Vandebriel, E. Van Doren, E. Kramer, Z. Herrera Rivera, C. S. Serrano-Rojero, E. R. Gremmer, J. Mast, R. J. B. Peters, P. C. H. Hollman., et al. 2012. “Distribution, Elimination, and Toxicity of Silver Nanoparticles and Silver Ions in Rats after 28-Day Oral Exposure.” ACS Nano 6(8): 7427–7442. doi:10.1021/nn302649p.
- Versantvoort, C. H. M., A. G. Oomen, E. Van de Kamp, C. J. M. Rompelberg, and A. J. A. M. Sips. 2005. “Applicability of an In Vitro Digestion Model in Assessing the Bioaccessibility of Mycotoxins from Food.” Food and Chemical Toxicology 43(1): 31–40. doi:10.1016/j.fct.2004.08.007.
- Walczak, A. P., R. Fokkink, R. Peters, P. Tromp, Z. E. Herrera Rivera, I. M.C.M. Rietjens, P. J.M. Hendriksen, and H. Bouwmeester. 2012. “Behaviour of Silver Nanoparticles and Silver Ions in an In Vitro Human Gastrointestinal Digestion Model.” Nanotoxicology 7(7): 1198–1210. doi:10.3109/17435390.2012.726382.
- Walczak, A. P., E. Kramer, P. J. M. Hendriksen, R. Helsdingen, M. van der Zande, I. M. C. M. Rietjens, and H. Bouwmeester. 2015. “In Vitro Gastrointestinal Digestion Increases the Translocation of Polystyrene Nanoparticles in an In Vitro Intestinal Co-Culture Model.” Nanotoxicology 9(7): 886–894. doi:10.3109/17435390.2014.988664.
- Walczak, A. P., E. Kramer, P. J. M. Hendriksen, P. Tromp, J. P. F. G. Helsper, M. van der Zande, I. M. C. M. Rietjens, and H. Bouwmeester. 2015. “Translocation of Differently Sized and Charged Polystyrene Nanoparticles in In Vitro Intestinal Cell Models of Increasing Complexity.” Nanotoxicology 9(4): 453–461. doi:10.3109/17435390.2014.944599.
- Weigel, S., R. Peters, K. Loeschner, R. Grombe, and T. P. J. Linsinger. 2017. “Results of an Interlaboratory Method Performance Study for the Size Determination and Quantification of Silver Nanoparticles in Chicken Meat by Single-Particle Inductively Coupled Plasma Mass Spectrometry (sp-ICP-MS).” Analytical and Bioanalytical Chemistry 409(20): 4839–4848. doi:10.1007/s00216-017-0427-2.
- Wildt, B. E., A. Celedon, E. I. Maurer, B. J. Casey, A. M. Nagy, S. M. Hussain, and P. L. Goering. 2016. “Intracellular Accumulation and Dissolution of Silver Nanoparticles in L-929 Fibroblast Cells Using Live Cell Time-Lapse Microscopy.” Nanotoxicology 10(6): 710–719. doi:10.3109/17435390.2015.1113321.
- Yuan, H., C. Chen, G. Chai, Y. Du, and F. Hu. 2013. “Improved Transport and Absorption through Gastrointestinal Tract by PEGylated Solid Lipid Nanoparticles.” Molecular Pharmaceutics 10(5): 1865–1873.
- Zook, J. M., S. E. Long, D. Cleveland, C. L. A. Geronimo, and R. I. MacCuspie. 2011. “Measuring Silver Nanoparticle Dissolution in Complex Biological and Environmental Matrices Using UV–Visible Absorbance.” Analytical and Bioanalytical Chemistry 401(6): 1993. doi:10.1007/s00216-011-5266-y.