
Abstract
Silicon dioxide (silica, SiO2, SAS) and titanium dioxide (TiO2) are produced in high volumes and applied in many consumer and food products. As a consequence, there is a potential human exposure and subsequent systemic uptake of these particles. In this study we show the characterization and quantification of both total silicon (Si) and titanium (Ti), and particulate SiO2 and TiO2 in postmortem tissue samples from 15 deceased persons. Included tissues are liver, spleen, kidney and the intestinal tissues jejunum and ileum. Low-level analysis was enabled by the use of fully validated sample digestion methods combined with (single particle) inductively coupled plasma high resolution mass spectrometry techniques (spICP-HRMS). The results show a total-Si concentration ranging from <2 to 191 mg Si/kg (median values of 5.8 (liver), 9.5 (spleen), 7.7 (kidney), 6.8 (jejunum), 7.6 (ileum) mg Si/kg) while the particulate SiO2 ranged from <0.2 to 25 mg Si/kg (median values of 0.4 (liver), 1.0 (spleen), 0.4 (kidney), 0.7 (jejunum, 0.6 (ileum) mg Si/kg), explaining about 10% of the total-Si concentration. Particle sizes ranged from 150 to 850 nm with a mode of 270 nm. For total-Ti the results show concentrations ranging from <0.01 to 2.0 mg Ti/kg (median values of 0.02 (liver), 0.04 (spleen), 0.05 (kidney), 0.13 (jejunum), 0.26 (ileum) mg Ti/kg) while particulate TiO2 concentrations ranged from 0.01 to 1.8 mg Ti/kg (median values of 0.02 (liver), 0.02 (spleen), 0.03 (kidney), 0.08 (jejunum), 0.25 (ileum) mg Ti/kg). In general, the particulate TiO2 explained 80% of the total-Ti concentration. This indicates that most Ti in these organ tissues is particulate material. The detected particles comprise primary particles, aggregates and agglomerates, and were in the range of 50–500 nm with a mode in the range of 100–160 nm. About 17% of the detected TiO2 particles had a size <100 nm. The presence of SiO2 and TiO2 particles in liver tissue was confirmed by scanning electron microscopy with energy dispersive X-ray spectrometry.
Introduction
Synthetic amorphous silica (SAS, SiO2) and titanium dioxide (TiO2), the latter as a white pigment, are industrially produced in high volumes. SAS is used as a food additive, is manufactured by several production processes, and consists mainly of nanosized primary particles that form small aggregates and larger agglomerates (Sepeur et al. Citation2008; Peters et al. Citation2012). TiO2 as a white pigment is used as a food additive, in personal care products (e.g. toothpaste) and in many other consumer products. It contains a fraction of nanosized primary particles (<100 nm) (Peters, Van Bemmel et al. Citation2014; Weir et al. Citation2012). As a consequence, human exposure and subsequent systemic uptake of these particles becomes likely. However, only limited data are available on the presence of SiO2 and TiO2 particles in human organs. We reported only recently on the presence of TiO2 particles in liver and spleen (Heringa et al. Citation2018). In this study, the focus was originally on the determination of SiO2 particles in liver, spleen, kidney and intestinal samples, however, to strengthen the results of the previous study, TiO2 particles were also measured in these new samples. Since the 1960s, SiO2 as an anti-caking agent and TiO2 as a white pigment are authorized food additives (i.e. in the EU as E171 and E551, respectively (EU Official Journal of the European Union Citation2008a; EU Official Journal of the European Union Citation2008b), and in the US as a food color additive (TiO2) and food contact substance in food packaging) and also applied in consumer and medical products (Peters et al. Citation2012; Weir et al. Citation2012; Lim et al. Citation2015; European Commission Citation1994). Sodium, calcium, and magnesium silicates and hydrated silica, SiO2. nH2O, contain naturally present inorganic Si. The latter may form small particles in the size range of 1–5 nm and can be found in natural waters, including drinking and mineral waters (Bergna Citation2006; Mojsiewicz-Pienkowska and Lukasiak Citation2003). There are limited data on the presence of TiO2 particles in the environment or in untreated food products such as raw milk, vegetables, and meat (Sugibayashi, Todo, and Kimura Citation2008; Peters, Van Bemmel, et al. Citation2018).
During the life cycle of products, release of SiO2 and TiO2 particles occurs, resulting in direct (oral, lung, and dermal) and indirect (via the environment) human exposure (Mueller and Nowack Citation2008; Maynard et al. Citation2006; Bouwmeester et al. Citation2011). Although human tissue levels of the element Ti and particulate TiO2 have been reported (Heringa et al. Citation2018; Frisken et al. Citation2002; Crosera et al. Citation2015), no data are available on human tissue concentrations of the element Si and particulate SiO2 (Sarmiento-Gonzalez et al. Citation2009; National Research Council Citation2005; WHO Citation1974). While no human data on the systemic uptake of SiO2 particles are available (Napierska et al. Citation2010; Fruijtier-Polloth Citation2012), a study with rodents implied limited oral uptake of silica at realistic consumer exposure levels (van der Zande et al. Citation2014). Uptake of TiO2 particles by the gut has been studied in animals, but rarely in humans (Jovanovic Citation2015). The only human volunteer studies conducted with single dose administration suggest that the oral bioavailability of TiO2 is low (Pele et al. Citation2015; Böckmann et al. Citation2000; Jones et al. Citation2015). It should be noted that low oral uptake of nanomaterials can still lead to high organ burdens when there is long-term, frequent exposure in combination with low excretion or high persistence.
In the current study, the presence of SiO2 and TiO2 particles in postmortem liver, spleen, kidney, jejunum, and ileum from 15 deceased persons was determined, enabled by the latest developments in analytical detection methods. Liver and spleen were included in this study because nanomaterials are generally taken up by the mononuclear phagocyte system (MPS) and thereby typically distribute to the liver and spleen, as well as to the kidney (Hardy et al. Citation2018). Information on the presence of SiO2 and TiO2 particles in intestinal tissues is also considered relevant because of the reported uptake of particles by M-cells in Peyer’s patches, which are mainly found in the jejunum and ileum (Hardy et al. Citation2018). Total-Si and total-Ti concentrations were measured using inductively coupled plasma high-resolution mass spectrometry (ICP-HRMS) while SiO2 and TiO2 particles were measured using single-particle ICP-MS (spICP-MS) on, respectively, a triple quadrupole ICP-MSMS and a ICP-HRMS and instrument. The tissues were further studied with high resolution scanning electron microscopy with energy dispersive X-ray spectrometry (SEM-EDX) to confirm the presence and size of SiO2 and TiO2 particles.
Methods
A full description of the applied methods can be found in the Supplementary information.
Samples and sample preparation
Five types of post mortem human samples were analyzed: liver, spleen, kidney, and parts of the jejunum and ileum. These were obtained from 15 subjects (of which only 12 kidneys, jejunum and ileum were obtained). The complete and intact organs and tissue related to the beginning of the jejunum and the end of the ileum parts of the small intestine were obtained from bodies that were donated to the Department of Anatomy of the University Medical Center Utrecht for educational and research purposes. The bodies, 7 men and 8 women who died at the age of 64–98 years, had been fixed in 4% formaldehyde. During sample preparation, each organ was cut into small pieces and ground to a size range of 0.5–1 mm diameter. All sample handling and sample preparation were carried out in a laminar flow cabinet. To determine potential sample contamination, all materials that have been in contact with the organs were collected. The total-Si and -Ti concentrations in these materials or released by these materials were determined. The sum of the blank contributions of each of these materials was equal to (total-Si) or lower than (total-Si) the limit of detection (LOD) of the chemical analysis method for the tissues.
Determination of total-Si and -Ti concentration
A subsample of the ground organ was digested in a microwave system using a mixture of nitric acid and hydrofluoric acid (Peters, Undas et al. Citation2018). The diluted digests were analyzed with ICP-HRMS as described in the next section. Quantification was based on Si and Ti standards diluted in the same acidic matrix as the samples. The method was validated over a period of several days. The repeatability and recovery of the total-Si and -Ti method was determined by spiking samples at 10 and 0.1 mg/kg with NM-202 and NM-104 (a SiO2 and a TiO2 nano-material, respectively) and analyzing these on different days. The repeatability for both parameters is <15% and the recovery >90%. The LOD of the methods is 2 mg total-Si/kg and 0.01 mg total-Ti/kg. Method blanks were determined by performing the complete procedure, however, without the addition of a sample. The total-Si and -Ti concentrations in the blanks were below the LOD.
Determination of SiO2 and TiO2 particles
For the determination of SiO2 and TiO2 particles, a two-step digestion procedure was followed to liberate the particles, as was previously analytically validated (Peters, Undas et al. Citation2018). In the first step, the tissue in the formaldehyde-fixed sample was depolymerized while in the second step a standard enzymatic digestion was performed. A subsample of 200 mg was collected from the grinded subsamples and the digestion buffer (containing glycine) was added, vortexed for 1 min and heated for 3 h at 100 °C to depolymerize the formaldehyde-fixed tissue. In the second step, and after cooling to room temperature, proteinase K, and digestion buffer were added and the tube was incubated for 16 h at 37 °C. After cooling to room temperature, the digest was diluted 1000 times with Milli-Q water and analyzed using spICP-MS.
Instrumental analysis with ICP-MS
spICP-MS is a method for the detection and characterization of (nano-)particles (Peters, Undas et al. Citation2018; Peters, Rivera, et al. Citation2014; Laborda, Bolea, and Jimenez-Lamana Citation2014; Peters et al. Citation2015). A triple quadrupole ICP-MSMS was used to measure SiO2 particles in single-particle mode while a sector-field high-resolution ICP-HRMS was used to measure total-Si and total-Ti in standard mode, and TiO2 particles in single-particle mode. To minimize any background resulting from Si emissions, all quartz parts in the ICP-MS instruments were replaced by other materials. In addition, the collision cell was used to remove polyatomic interferences from 14N14N and 12C16O. Isotopes monitored for Si were m/z 28 and 29 in standard mode and m/z 28 in single-particle mode. The ICP-HRMS was operated in medium resolution mode with Ti measured at m/z 46.95 to avoid interferences from 36Ar12C, 32S16O, and 48Ca. Finally, single-particle data were processed in a dedicated spreadsheet for the calculation of particle sizes, particle size distributions, and particle number and mass concentrations (Peters et al. Citation2015). As for the total analysis methods, the particle analysis method was validated over a period of several days. The repeatability and the recovery of the SiO2 and TiO2 particles were determined by spiking samples at 1 and 0.1 mg/kg with NM-202 and NM-104 and analyzing these in sevenfold on three different days. The recovery was found to be 70 and 76%, respectively, and the repeatability was <35% for both parameters. This recovery of TiO2 particles was much better than in the previous determination of these particles (Heringa et al. Citation2018; Peters, Undas et al. Citation2018). The LOD for SiO2 and TiO2 particles is 0.2 mg Si/kg and 0.01 mg Ti/kg, respectively. The size detection limits are 50 nm for TiO2 particles using spICP-HRMS and 100 nm for SiO2 using spICP-MSMS with H2 as the collision gas. While upper size detection limits were not determined they are expected to be at least 1000 nm based on earlier research (Peters et al. Citation2015). The mass-based SiO2 and TiO2 particle concentrations in method blanks were below the LOD.
Confirmation of SiO2 and TiO2 particles wit SEM-EDX
Samples were studied using scanning electron microscopy with energy dispersive X-ray detection (SEM-EDX) to confirm the presence of SiO2 and TiO2 particles in human liver. Typically, subsamples of >100 tissue grains were collected on a sampling stub and dried to remove water. These subsamples were analyzed with a high-resolution field emission gun scanning electron microscopy in combination with energy dispersive X-ray analysis (FEG-SEM/EDX). Approximately 500 images for each sample were viewed at different magnifications (5000–100,000×) and the surface of the sample grains was systematically searched for SiO2 and TiO2 particles using the backscattered electron imaging mode. After the detection of particles in a field of view, X-ray spectra from the detected particle and surrounding matrix were acquired to determine the identity.
Results
Total-Si and -Ti concentration in human organ tissues
Postmortem human liver, spleen, kidney, jejunum and ileum samples were analyzed from 15 human subjects, 7 male and 8 female, who died at the age of 64–98 years. From these persons, written informed consent was obtained during life that allowed the use of their entire bodies for educational and research purposes. While there is no information about their diets, it is known that all persons involved are of Caucasian ethnicity. All have lived in the Netherlands and it is therefore expected that most followed a normal Dutch diet (Van Rossem et al. Citation2011). It is unknown whether any of the subjects received Ti implants during their lifetime. Individual data can be found in the Supplementary Information (Table S1). The total-Si concentration in the human post mortem livers ranged from 2.7 to 191 mg Si/kg tissue with an average value of 12 mg Si/kg tissue and a standard deviation of 23 mg Si/kg tissue indicating large differences between subjects. The total-Si concentrations in the individual organs are presented in while they are graphically presented in the box plot in . In general, total-Si concentrations are comparable between the organs and if the total-Si concentration is high in a subject it is high in all the organs of that subject. The total-Ti concentration in the organs ranged from 0.01 to 2.0 mg Ti/kg tissue with an average value of 0.17 mg Ti/kg tissue and a standard deviation of 0.33 mg Ti/kg tissue indicating large differences between subjects and organs. The total-Ti concentrations in the individual organs are presented in . Within a subject, there are also large differences between the concentrations in different organs. The box plots in show that the total-Ti concentration in the jejunum and ileum are substantially higher than in liver, spleen and kidney. Individual data are presented in the Supplementary Information (Table S1). Special care was taken to include blank samples of all materials involved in organ collection, tissue processing, and analyses. This includes the formaldehyde used to fix the body tissues, scalpels and knives, and materials and utensils to process and homogenize the organs. The sum of the contributions of these materials to the total-Ti concentration was lower than the LOD of the analytical method. Especially, the formaldehyde contributed to the total-Si concentration (about 2 times the LOD) and the total-Si results were corrected for this contribution.
Figure 1. Box and whisker plots of total-Si concentration in human (post mortem) liver, spleen, kidney, jejunum, and ileum. The boxes represent the upper 25% quartile (Q3), median (Q2), and lower 25% quartile (Q1) concentrations, respectively. The whiskers indicate 1.5IQR (Q3–Q1).
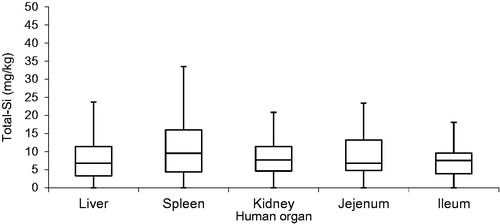
Figure 2. Box and whisker plots of total-Ti concentration in human (post mortem) liver, spleen, kidney, jejunum, and ileum. The boxes represent the upper 25% quartile (Q3), median (Q2), and lower 25% quartile (Q1) concentrations, respectively. The whiskers indicate 1.5IQR (Q3–Q1).
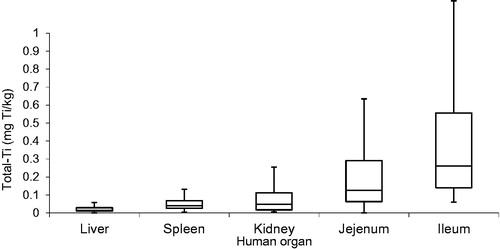
Table 1. Summary of total-Si and -Ti concentrations in the organs.
SiO2 and TiO2 particles in human organ tissues
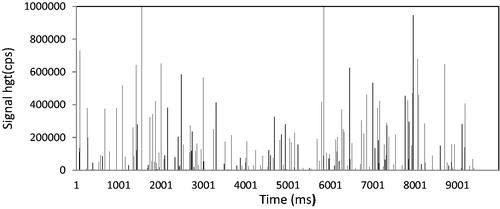
A combination of gentle chemical and enzymatic digestion combined with spICP-MS was used for the detection and characterization of SiO2 and TiO2 particles. The sample preparation is known not to affect the presence and size of particles (Peters, Rivera et al. Citation2014). This was determined in an extensive validation of the method which showed a recovery >70% for particle concentration and >90% for particle size. We found that all tissue samples contained particles containing Si and Ti and, as confirmed later by electron microscopy analysis, these are mainly SiO2 (and silicates) and TiO2 particles. Their particle nature is evident from the characteristic spikes in the time scans of the spICP-MS analysis of the tissue samples as shown in . The number of spikes in the time scan is directly proportional to the number of particles in the sample. The signal height of the peaks relates to the mass of the particle from which the particle size is calculated assuming a spherical particle shape and applying densities of 2.63 and 4.23 g/cm3 for SiO2 and TiO2. For SiO2 and TiO2 the size-limit of detection is 100 and 50 nm, respectively. The detected particles can consist of primary particles, aggregates or agglomerates. Confirmation analysis with SEM-EDX supported the presence of particles in postmortem human tissues. From the spICP-MS data, the particle size, particle size distribution, and particle concentrations were calculated (Peters et al. Citation2015).
Figure 3. TiO2 particles in human (post mortem) tissue. Time scan of the spICP-MS analyses of a human tissue sample.
The SiO2 particle mass concentrations in the tissues ranged from 0.2 to 25 mg Si/kg tissue with an average of 1.2 ± 3.1 mg Si/kg tissue. The results for the individual organs are presented in and graphically shown in the box plots in . Comparable with the total-Si concentration results, there are differences in the particulate Si mass concentration in the organs, although tissues containing high total-Si also contained high SiO2 particle concentrations. However, only 10% of the total-Si concentration is explained by the particle SiO2 concentrations. For SiO2 the number-based particle size distributions in the different tissue samples are also comparable and have a size range of 150–850 nm with the mode of the observed particle sizes being in the range of 250–400 nm (). Individual data for TiO2 and SiO2 particle mass concentrations are presented in the Supplementary Information (Table S1).
Figure 4. Box and whisker plots of the SiO2 particle concentration in human (post mortem) organs. The boxes represent the upper 25% quartile (Q3), median (Q2), and lower 25% quartile (Q1) concentrations respectively. The whiskers indicate 1.5IQR (Q3–Q1).
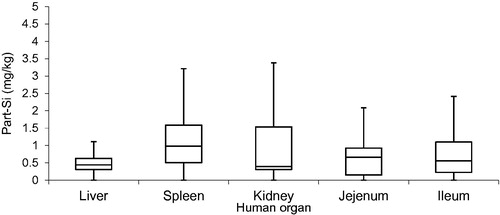
Figure 5. Number-based particle size distribution for SiO2 particles found in tissues of human organs. Particles can consist of primary particles, aggregates or agglomerates.
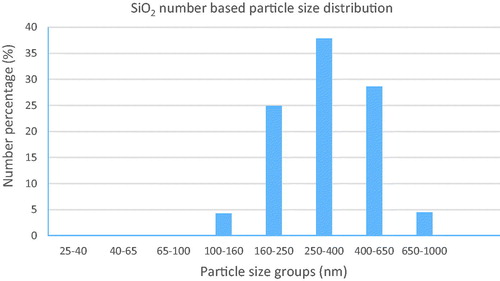
Table 2. Summary of particle SiO2 and TiO2 concentrations in the organs.
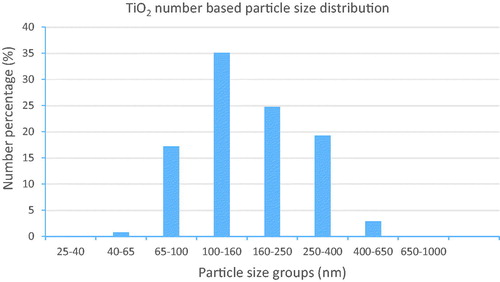
The TiO2 particle mass concentration in the organs ranged from 0.01 to 1.8 mg Ti/kg tissue with an average of 0.14 ± 0.30 mg Ti/kg tissue indicating large differences between individual results. lists the results for the individual organs and shows the box plot for TiO2 particles in the different organs. While particle concentrations in the liver, spleen, and kidney are comparable between individuals, the concentrations in the jejunum and ileum samples show a higher variability among different samples (as was observed for total-Ti). This may be a result of the fact that only parts of the jejunum and ileum were analyzed. In general, tissues with high total-Ti concentrations also contained high TiO2 particle concentrations. The TiO2 particle concentrations explain about 80% of the total-Ti concentrations showing that most of the Ti material in these organs consist of particulate material. This is in line with earlier findings (Heringa et al. Citation2018). The number-based TiO2 particle size distributions in the different tissue samples are comparable and have a size range of 50 to 500 nm with a mode of in the size bin of 100–160 nm as shown in . Seventeen percent of the TiO2 particles in the number-based size distribution is <100 nm.
Figure 6. Box and whisker plots of the TiO2 particle concentration in human (post mortem) organs. The boxes represent the upper 25% quartile (Q3), median (Q2), and lower 25% quartile (Q1) concentrations respectively. The whiskers indicate 1.5IQR (Q3–Q1).
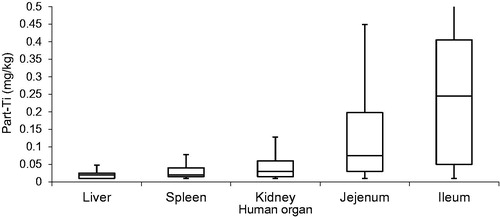
Figure 7. Number-based particle size distribution for TiO2 particles found in tissues of human organs. Particles can consist of primary particles, aggregates or agglomerates.
Confirmation of the presence of SiO2 and TiO2 particles using SEM-EDX
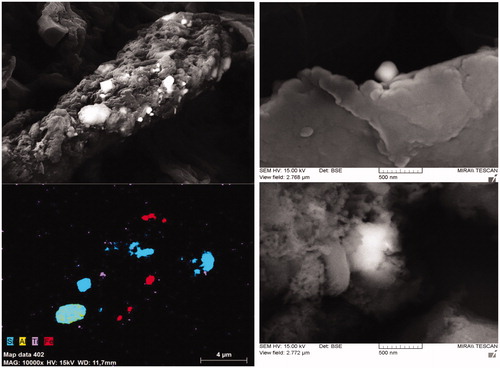
We used SEM-EDX as an independent technique for the confirmation of the presence of SiO2 and TiO2 particles in tissues. is an image of a liver sample that shows the presence of (large) SiO2 particles as well as smaller TiO2 particles. Element identification, including oxygen, was by EDX analysis (see color code for the other elements in ) which also revealed that the large Si-bearing particle in the image is, in fact, an aluminum silicate particle. Smaller SiO2 particles are also present. In addition, a number of iron-containing particles are visible. It should be remarked that the image in with so many particles is a hotspot, on the average only about 10 individual particles were detected in the 500 images. In general, TiO2 particles were found with diameters in the range of 50–200 nm. Small SiO2 particles were difficult to detect in backscattered electron mode because the density difference with the surrounding tissue is small, especially when particles are just below the surface. Therefore, tissue samples were plasma-ashed to remove the upper layer of the tissue resulting in a better contrast between particles and matrix. This revealed the presence of smaller SiO2 and TiO2 particles from which one of each is also shown in . The presence of micro-sized silica particles (and also iron particles) in human tissues is in agreement with recent findings by Locci et al. (Locci et al. Citation2019). They studied liver and kidney samples and found particles in virtually all samples with Si and Fe as the main metallic constituents.
Figure 8. SEM characterization of detected particles detected in a dried liver sample. In addition to the elements indicated in the picture, oxygen was also measured but not shown in the picture. The SEM image on the left shows TiO2 and SiO2 particles as well as aluminum silicate and iron particles. The images on the right show a TiO2 particle (top) and a SiO2 particle (bottom).
The presence of micro-sized Si particles may also help to understand why the SiO2 particles detected in the spICP-MS analysis explain no more than 10% of the total-Si concentration. If the measured total-Si concentration would consist of micro-sized particles, the number of SiO2 particles would be so few that it is unlikely that they will be observed in the spICP-MS scan resulting in an underestimation of the mass-based SiO2 particle concentration. The sub-sample collected for spICP-MS analysis is simply too small to be representative of the larger micro-sized SiO2 particles. Another explanation may be that in the plasma only a part of the micro-sized SiO2 particles is atomized and ionized. However, in previous research, we reported that SiO2 particles up to 2.5 µm are completely vaporized and ionized in the ICP-MS plasma (Peters et al. Citation2015). Therefore, the former explanation is most likely in explaining where the missing part of the particulate SiO2 is to be found, in the micro-sized SiO2 particles.
Discussion
Although SiO2 and TiO2 are authorized ingredients in food, and used in consumer and medical products, knowledge about their tissue concentrations in humans is very limited, and virtually absent with regard to particle content. Therefore, the data from this study are unique and highly useful for risk assessment. The presented concentrations represent the total organ burden of SiO2 and TiO2 particles. While it is assumed that most human subjects followed a western European diet, no historical data on specific exposure conditions of the human subjects are available and therefore we cannot establish a definite relation with the source of the SiO2 and TiO2 particles found in the human tissues. Consumer intake of SiO2 from food has been estimated at 9.4 mg Si/kg bw/day (Dekkers et al. Citation2011). Based on these and other data, Van Kesteren et al. developed a kinetic model and estimated steady state Si liver concentration in human tissues at 21–23 mg Si/kg (van Kesteren et al. Citation2015). Apart from that little is known about the total-Si concentrations in human tissues () and quantitative information on the presence of particles is absent. While uptake of Si or SiO2 in humans is unknown, recent studies with rodents imply limited oral uptake of silica at realistic consumer exposure levels, while also accumulation in time may occur (van der Zande et al. Citation2014; van Kesteren et al. Citation2015). Silica and silicic acid and its calcium, magnesium and aluminum salts occur ubiquitously in the environment and some have been used for many years medically, for example, against osteoporosis. As a consequence, small amounts of silica are normally present in our bodies and according to the WHO the silica concentration in human tissues varies from 10 to 200 mg/100 g on a dry weight basis which translates to 2 to 50 mg Si/kg tissue (Yukawa et al. Citation1980). The total-Si liver concentrations found in this study are in the range of 8 ± 8 mg Si/kg tissue and are about 50% of the estimated steady state Si liver concentration by Van Kesteren et al. and in the range of the literature data in . Human exposure by inhalation of silica dust is very common in both working and living environments with SiO2 air concentrations in the range of <0.1–0.5 mg/m3, resulting in an estimated maximum exposure of 5 mg/day (Morfeld et al. Citation2014; Chen et al. Citation2012), or 0.08 mg/kg bw/day for a person of 60 kg. While transport from the lungs into the circulatory system is possible and silica particles may also be cleared and transported from the lungs into the digestive tract, the contribution is limited. Dermal exposure to silica nanoparticles did not lead to any effects (Ryu et al. Citation2014) and, therefore, we conclude that penetration of SiO2 through the skin does not contribute. As for TiO2, oral exposure seems to be the most important source of SiO2 for humans in non-occupational settings, but in contrast to TiO2, other routes may also contribute substantially.
Table 3. Literature data of total-Si and -Ti concentrations in human liver and spleen.
The number-based particle size distribution, as determined by spICP-MS, for the detected SiO2 particles ranged from 150 to 850 nm. Particles consist of primary particles, aggregates and agglomerates. SEM-EDX analyses confirmed the presence of SiO2 aggregates/agglomerates in the liver but only for particle sizes from around 500 nm to several micrometers due to lower density difference with the surrounding tissue. Oral exposure is assumed to be the major exposure route for SiO2 in non-occupational situations.
Based on estimates from the Dutch food consumption surveys (Van Rossem et al. Citation2011), food may contribute 0.15–2.0 mg Ti/kg body weight/day and since TiO2 is highly stable, it is not likely degraded (dissolved) in the intestine and therefore mostly defecated (Weir et al. Citation2012; Rompelberg et al. Citation2016; Sohal et al. Citation2018). Human volunteer studies indicate that the oral bioavailability of TiO2 is low, but accumulation in tissues may occur in time (Pele et al. Citation2015; Böckmann et al. Citation2000). While inhalation may be the primary route for TiO2 exposure in the workplace, in non-occupational settings Ti concentrations in air are very low, in the range of 0.01–0.1 μg/m3, resulting in a maximum exposure through inhalation of only 1 μg Ti/day (WHO Citation1982). Most dermal exposure studies, whether in vitro, ex vivo or in vivo, report that TiO2 particles do not penetrate the (intact) skin (Crosera et al. Citation2015; Shi et al. Citation2013), or that only minor amounts of nano TiO2 are absorbed in humans (Pelclova et al. Citation2019). Medical implants have a strongly bound oxide layer which makes them inert, however, due to corrosion a Ti implant surface can be a potential source for the release of micro- and nano-sized particles (Frisken et al. Citation2002; Sarmiento-Gonzalez et al. Citation2009). On the other hand, in the previous study, 2 of the 15 human subjects had Ti implants but did not show increased total-Ti or particle TiO2 concentrations (Heringa et al. Citation2018). While it is unknown whether any of the human subjects in this study received Ti implants during their lifetime, TiO2 particles were found in all tissue samples. In conclusion, oral exposure, e.g. from food, toothpaste and medicines, seems to be the most important source for TiO2 in non-occupational settings (Rompelberg et al. Citation2016).
Total-Ti concentrations found in this study were in the range of 0.01–2.0 mg Ti/kg tissue. For liver and spleen, the total-Ti concentrations ranged from 0.01 to 0.25 mg Ti/kg which is comparable to the results in a previous study with tissues from 15 other deceased persons (Heringa et al. Citation2018). These concentrations are low compared to some other total-Ti concentrations reported in literature (). However, using gentle chemical and enzymatic digestion combined with spICP-MS analyses, a method completely independent from the total-element determination, comparable mass concentrations are found for the particle fraction of TiO2. In the spICP-MS analyses of TiO2 particles, primary particles, aggregates or agglomerates with an external size in the range of 50–500 nm are found with a mode in the range of 100–160 nm. SEM-EDX analysis confirmed the presence of partly spherical shaped TiO2 particles in liver tissues with primary particle sizes in the range of 50–200 nm, which is in agreement with the spICP-MS results. White pigment TiO2, as is among others used in food, toothpaste and many consumer products, has primary particle sizes in the range of 50–500 nm diameter, with 10–50% of these TiO2 primary particles having a size <100 nm3 (Weir et al. Citation2012; Younes et al. Citation2019). The TiO2 particles found in the present study are of similar size. Given the similarities in the size distribution and the low exposure from other exposure routes, we deem it plausible that the detected TiO2 particles in human organ tissues originate from oral exposure.
Conclusion
Methods were developed and successfully validated for the determination of total-Si and -Ti and particulate SiO2 and TiO2 in human tissues. The total-Si concentrations ranged from <2 to 191 mg Si/kg tissue while the particulate SiO2 concentration in the tissue samples ranged from 0.2 to 25 mg Si/kg tissue. Particulate SiO2 explained about 10% of the total-Si concentration, probably because micro-sized SiO2 particles that were present in the samples were not detected by the spICP-MS method. Total-Ti concentration in samples of human liver, spleen, kidney, jejunum, and ileum ranged from 0.01 to 2.0 Ti mg/kg tissue while the particulate TiO2 concentration ranged from 0.01 to 1.8 mg Ti/kg tissue, explaining 80% of the total-Ti concentration. These results confirm the findings of an earlier study of particulate TiO2 in the liver and spleen (Heringa et al. Citation2018). The presence of SiO2 and TiO2 particles in the liver was confirmed by SEM/EDX analyses. The sizes of the SiO2 and TiO2 particles detected with spICP-MS are in the range of 150–850 nm for SiO2 and 50–500 nm for TiO2. Oral exposure is assumed to be the major source of SiO2 and TiO2 particles in non-occupational settings. While oral exposure may partly result from natural background sources, we deem it plausible that at least a part of the detected SiO2 and TiO2 particles in human liver and spleen originate from food, toothpaste and/or medicines that are consumed.
Ethical approval
Written informed consent was obtained during life from the persons of which the organs were used in this study, that allowed the use of their entire bodies for educational and research purposes. All ethical regulations concerning the use of these organs were followed, and approval for this specific scientific use was obtained from the board of University Medical Center Utrecht.
TNAN-2019-OR-0317-File002.docx
Download MS Word (37.7 KB)Acknowledgments
Our deep respect goes to the 15 persons who donated their bodies to science postmortem and, thus, enabled these analyses. This research was commissioned and financed by The Netherlands Food and Consumer Product Safety Authority (NVWA-BuRO) and the Ministry of Infrastructure and Water Management. The authors thank J. Castenmiller of the NVWA-BuRO for her support and fruitful discussions. The authors thank P. Nobels and W. Schuurmans of Wageningen University Research for their assistance with the ICP-HRMS analysis and R. Breidenbach of Rijkswaterstaat for his assistance with the spICP-MSMS analysis.
Disclosure statement
The authors declare no competing financial interests.
References
- Austin, J. H., R. W. Rinehart, and E. Ball. 1972. “A Colorimetric Method for the Microdetermination of Silicon in the Presence of Excess Phosphorus.” Microchemical Journal 17 (6): 670–676. doi:10.1016/0026-265X(72)90135-X.
- Bergna, H. E. 2006. “Silicic Acids and Colloidal Silica.” In Colloidal Silica: Fundamentals and Applications, edited by HE Bergna and WO Roberts, 37–41. London: Taylor & Francis Group.
- Böckmann, J., H. Lahl, T. Eckert, and B. Unterhalt. 2000. “Blood Levels of Titanium before and after Oral Administration of Titanium Dioxide.” Pharmazie 55 (2): 140–143.
- Bouwmeester, H., I. Lynch, H. J. Marvin, K. A. Dawson, M. Berges, D. Braguer, H. J. Byrne, et al. 2011. “Minimal Analytical Characterization of Engineered Nanomaterials Needed for Hazard Assessment in Biological Matrices.” Nanotoxicology 5 (1): 1–11. doi:10.3109/17435391003775266.
- Carlisle, E. M., and W. Mertz. 1986. 7-Silicon. Trace Elements in Human and Animal Nutrition. 5th ed, 373–390. San Diego: Academic Press.
- Chen, W. H., Y. W. Liu, H. J. Wang, E. Hnizdo, Y. Sun, L. P. Su, X. Zhang, et al. 2012. “Long-Term Exposure to Silica Dust and Risk of Total and Cause-Specific Mortality in Chinese Workers: A Cohort Study.” PLoS Medicine 9 (4): e1001206. doi:10.1371/journal.pmed.1001206.
- Crosera, E., A. Prodi, M. Mauro, M. Pelin, C. Florio, F. Bellomo, G. Adami, et al. 2015. “Titanium Dioxide Nanoparticle Penetration into the Skin and Effects on HaCaT Cells.” International Journal of Environmental Research and Public Health 12 (8): 9282–9297. doi:10.3390/ijerph120809282.
- Dekkers, S., P. Krystek, R. Peters, D. Lankveld, B. Bokkers, P. van Hoeven-Arentzen, H. Bouwmeester, and A. G. Oomen. 2011. “Presence and Risks of Nanosilica in Food Products.” Nanotoxicology 5 (3): 393–405. doi:10.3109/17435390.2010.519836.
- EU Official Journal of the European Union. 2008a. Commission Directive 2008/84/EC of 27 August 2008 Laying Down Specific Purity Criteria on Food Additive Other Than Colours and Sweeteners. Official Journal of the European Union L253.
- EU Official Journal of the European Union. 2008b. Regulation (Ec) No. 1333/2008 of the European Parliament and of the Council of 16 December 2008 on Food Additives. Official Journal of the European Union L354: 16–33.
- European Commission. 1994. “European Parliament and Council Directive 94/36/EC of 30 June 1994 on Colours in Foodstuffs.” Official Journal of the European Communities L237: 13–29.
- Evans, G. R., D. T. Netscher, M. A. Schusterman, S. S. Kroll, G. L. Robb, G. P. Reece, and M. J. Miller. 1996. “Silicon Tissue Assays: A Comparison of Nonaugmented Cadaveric and Augmented Patient Levels.” Plastic and Reconstructive Surgery 97 (6): 1207–1214. doi:10.1097/00006534-199605000-00016.
- Frisken, K. W., G. W. Dandie, S. Lugowski, and G. Jordan. 2002. “A Study of Titanium Release into Body Organs following the Insertion of Single Threaded Screw Implants into the Mandibles of Sheep.” Australian Dental Journal 47 (3): 214–217. doi:10.1111/j.1834-7819.2002.tb00331.x.
- Fruijtier-Polloth, C. 2012. “The Toxicological Mode of Action and the Safety of Synthetic Amorphous Silica-a Nanostructured Material.” Toxicology 294: 61–79.
- Hardy, A., D. Benford, T. Halldorsson, M. J. Jeger, H. K. Knutsen, S. More, H. Naegeli, et al. 2018. “Guidance on Risk Assessment of the Application of Nanoscience and Nanotechnologies in the Food and Feed Chain: Part 1, Human and Animal Health.” EFSA Journal 16: 5327. doi:10.2903/j.efsa.2018.5327.
- Heringa, M. B., R. J. B. Peters, R. L. A. W. Bleys, M. K. van der Lee, P. C. Tromp, P. C. E. van Kesteren, J. C. H. van Eijkeren, A. K. Undas, A. G. Oomen, and H. Bouwmeester. 2018. “Detection of Titanium Particles in Human Liver and Spleen and Possible Health Implications.” Particle and Fibre Toxicology 15 (1): 15. doi:10.1186/s12989-018-0251-7.
- Jones, K., J. Morton, I. Smith, K. Jurkschat, A. H. Harding, and G. Evans. 2015. “Human in Vivo and in Vitro Studies on Gastrointestinal Absorption of Titanium Dioxide Nanoparticles.” Toxicology Letters 233 (2): 95–101. doi:10.1016/j.toxlet.2014.12.005.
- Jovanovic, B. 2015. “Critical Review of Public Health Regulations of Titanium Dioxide, a Human Food Additive.” Integrated Environmental Assessment 11: 10–20.
- Laborda, F., E. Bolea, and J. Jimenez-Lamana. 2014. “Single Particle Inductively Coupled Plasma Mass Spectrometry: A Powerful Tool for Nanoanalysis.” Analytical Chemistry 86 (5): 2270–2278. doi:10.1021/ac402980q.
- Lim, J. H., P. Sisco, T. K. Mudalige, G. Sanchez-Pomales, P. C. Howard, and S. W. Linder. 2015. “Detection and Characterization of SiO2 and TiO2 Nanostructures in Dietary Supplements.” Journal of Agricultural and Food Chemistry 63 (12): 3144–3152. doi:10.1021/acs.jafc.5b00392.
- Locci, E., I. Pilia, R. Piras, S. Pili, G. Marcias, P. Cocco, F. De Giorgio, et al. 2019. “Particle Background Levels in Human Tissues – PABALIHT Project. Part I: A Nanometallic Study of Metal-Based Micro- and Nanoparticles in Liver and Kidney in an Italian Population Group.” Journal of Nanoparticle Research 21 (3): 45. doi:10.1007/s11051-019-4480-y.
- Maynard, A. D., R. J. Aitken, T. Butz, V. Colvin, K. Donaldson, G. Oberdorster, M. A. Philbert, et al. 2006. “Safe Handling of Nanotechnology.” Nature 444 (7117): 267–269. doi:10.1038/444267a.
- Mojsiewicz-Pienkowska, K., and J. Lukasiak. 2003. “Analytical Fractionation of Silicon Compounds in Foodstuffs.” Food Control 14: 153–162.
- Morfeld, P., D. Taeger, H. Mitura, A. Bosch, A. Nordone, R. Vormberg, R. McCunney, and R. Merget. 2014. “Cross-Sectional Study on Respiratory Morbidity in Workers after Exposure to Synthetic Amorphous Silica at Five German Production Plants Exposure Assessment and Exposure Estimates.” Journal of Occupational and Environmental Medicine 56 (1): 72–78. doi:10.1097/JOM.0000000000000055.
- Mueller, N. C., and B. Nowack. 2008. “Exposure Modeling of Engineered Nanoparticles in the Environment.” Environmental Science and Technology 42: 4447–4453. doi:10.1021/es7029637.
- Napierska, D., L. Thomassen, D. Lison, J. Martens, and P. Hoet. 2010. “The Nanosilica Hazard: Another Variable Entity.” Particle and Fibre Toxicology 7 (1): 39. doi:10.1186/1743-8977-7-39.
- National Research Council. 2005. Mineral Tolerance of Animals: Second Revised Edition. Washington.
- Pelclova, D., T. Navratil, T. Kacerova, B. Zamostna, Z. Fenclova, S. Vlckova, and P. Kacer. 2019. “NanoTiO2 Sunscreen Does Not Prevent Systemic Oxidative Stress Caused by UV Radiation and a Minor Amount of NanoTiO2 is Absorbed in Humans.” Nanomaterials 9 (6): 888. doi:10.3390/nano9060888.
- Pele, L. C., V. Thoree, S. F. Bruggraber, D. Koller, R. P. Thompson, M. C. Lomer, and J. J. Powell. 2015. “Pharmaceutical/Food Grade Titanium Dioxide Particles Are Absorbed into the Bloodstream of Human Volunteers.” Particle and Fibre Toxicology 12 (1): 26. doi:10.1186/s12989-015-0101-9.
- Peters, R. J. B., A. K. Undas, J. Memelink, G. van Bemmel, S. Munniks, H. Bouwmeester, P. Nobels, W. Schuurmans, and M. van der Lee. 2018. “Development and Validation of a Method for the Detection of Titanium Dioxide Particles in Human Tissue with Single Particle ICP-MS.” Current Trends in Analytical and Bioanalytical Chemistry 2: 74–84. doi:10.36959/525/442.
- Peters, R. J. B., G. van Bemmel, N. B. L. Milani, G. C. T. den Hertog, A. K. Undas, M. van der Lee, and H. Bouwmeester. 2018. “Detection of Nanoparticles in Dutch Surface Waters.” Science of the Total Environment 621: 210–218. doi:10.1016/j.scitotenv.2017.11.238.
- Peters, R. J. B., Z. H. Rivera, G. van Bemmel, H. J. P. Marvin, S. Weigel, and H. Bouwmeester. 2014. “Development and Validation of Single Particle ICP-MS for Sizing and Quantitative Determination of Nano-Silver in Chicken Meat.” Analytical and Bioanalytical Chemistry 406 (16): 3875–3885. doi:10.1007/s00216-013-7571-0.
- Peters, R., Z. Herrera-Rivera, A. Undas, M. van der Lee, H. Marvin, H. Bouwmeester, and S. Weigel. 2015. “Single Particle ICP-MS Combined with a Data Evaluation Tool as a Routine Technique for the Analysis of Nanoparticles in Complex Matrices.” Journal of Analytical Atomic Spectrometry 30 (6): 1274–1285. doi:10.1039/C4JA00357H.
- Peters, R. J. B, G. van Bemmel, Z. Herrera-Rivera, H. P. F. G. Helsper, H. J. P. Marvin, S. Weigel, P. C. Tromp, A. G. Oomen, A. G. Rietveld, and H. Bouwmeester. 2014. “Characterization of Titanium Dioxide Nanoparticles in Food Products: Analytical Methods to Define Nanoparticles.” Journal of Agricultural and Food Chemistry 62 (27): 6285–6293. doi:10.1021/jf5011885.
- Peters, R., E. Kramer, A. G. Oomen, Z. E. Herrera Rivera, G. Oegema, P. C. Tromp, R. Fokkink, et al. 2012. “Presence of Nano-Sized Silica during in Vitro Digestion of Foods Containing Silica as a Food Additive.” ACS Nano 6 (3): 2441–2451. doi:10.1021/nn204728k.
- Rompelberg, C., M. B. Heringa, G. van Donkersgoed, J. Drijvers, A. Roos, S. Westenbrink, R. Peters, G. van Bemmel, W. Brand, and A. G. Oomen. 2016. “Oral Intake of Added Titanium Dioxide and Its Nanofraction from Food Products, Food Supplements and Toothpaste by the Dutch Population.” Nanotoxicology 10 (10): 1404–1414. doi:10.1080/17435390.2016.1222457.
- Ryu, H. J., N. W. Seong, B. J. So, H. S. Seo, J. H. Kim, J. S. Hong, M. K. Park, et al. 2014. “Evaluation of Silica Nanoparticle Toxicity after Topical Exposure for 90 Days.” International Journal of Nanomedicine 9: 127–136.
- Sarmiento-Gonzalez, A., J. Encinar, J. M. Marchante-Gayon, and A. Sanz-Medel. 2009. “Titanium Levels in the Organs and Blood of Rats with a Titanium Implant, in the Absence of Wear, as Determined by Double-Focusing ICP-MS.” Analytical and Bioanalytical Chemistry 393: 335–343. doi:10.1007/s00216-008-2449-2.
- Sepeur, S., N. Laryea, S. Goedicke, and F. Grobeta. Hannover: Vincentz Network, 2008.
- Shi, H., R. Magaye, V. Castranova, and J. Zhao. 2013. “Titanium Dioxide Nanoparticles: A Review of Current Toxicological Data.” Particle and Fibre Toxicology 10 (1): 15. doi:10.1186/1743-8977-10-15.
- Sohal, I. S., Y. K. Cho, K. S. O’Fallon, P. Gaines, P. Demokritou, and D. Bello. 2018. “Dissolution Behavior and Biodurability of Ingested Engineered Nanomaterials in the Gastrointestinal Environment.” ACS Nano 12 (8): 8115–8128. doi:10.1021/acsnano.8b02978.
- Sugibayashi, K., H. Todo, and E. Kimura. 2008. “Safety Evaluation of Titanium Dioxide Nanoparticles by Their Absorption and Elimination Profiles.” The Journal of Toxicological Sciences 33 (3): 293–298. doi:10.2131/jts.33.293.
- U.S. Food and Drug Administration. 2002. “Code of Federal Regulations Title 21-Food and Drugs Part 73, Listing of color additives exempt from certification.” 21CFR73.2575.
- van der Zande, M., R. Vandebriel, M. Groot, E. Kramer, Z. Herrera Rivera, K. Rasmussen, J. S. Ossenkoppele, et al. 2014. “Sub-Chronic Toxicity Study in Rats Orally Exposed to Nanostructured Silica.” Particle and Fibre Toxicology 11 (1): 8. doi:10.1186/1743-8977-11-8.
- van Kesteren, P. C. E., F. Cubadda, H. Bouwmeester, J. C. H. van Eijkeren, S. Dekkers, W. H. de Jong, and A. G. Oomen. 2015. “Novel Insights into the Risk Assessment of the Nanomaterial Synthetic Amorphous Silica, Additive E551, in Food.” Nanotoxicology 9 (4): 442–452. doi:10.3109/17435390.2014.940408.
- Van Rossem, T. M., H. P. Fransen, J. Verkaik-Kloosterman, E. J. M. Buurma-Rethans, and M. C. Ocke. 2011. Dutch National Food Consumption Survey 2007–2010. Diet of children and adults 7 to 69 years. RIVM-Report 350050006, Bilthoven; 2011.
- Weir, A., P. Westerhoff, L. Fabricius, K. Hristovski, and N. Von Goetz. 2012. “Titanium Dioxide Nanoparticles in Food and Personal Care Products.” Environmental Science and Technology 46 (4): 2242–2250. doi:10.1021/es204168d.
- WHO. 1974. Toxicological Evaluation of Some Food Additives Including Anticaking Agents, Antimicrobials, Antioxidants, Emulsifiers and Thickening Agents. Geneva: WHO.
- WHO. 1982. Environmental Health Criteria 24: Titanium. Geneva: WHO.
- Younes, M., G. Aquilina, L. Castle, K. H. Engel, P. Fowler, F. J. Frutos Fernandez, R. Geurtler, et al. 2019. “Scientific Opinion on the Proposed Amendment of the EU Specifications for Titanium Dioxide (E 171) with Respect to the Inclusion of Additional Parameters Related to Its Particle Size Distribution.” EFSA Journal 17: 5760. doi:10.2903/j.efsa.2019.5760.
- Yukawa, M., K. Amano, M. Suzuki-Yasumoto, and M. Terai. 1980. “Distribution of Trace Elements in the Human Body Determined by Neutron Activation Analysis.” Archives of Environmental Health: An International Journal 35 (1): 36–44. doi:10.1080/00039896.1980.10667459.