
Abstract
In this study, two sets of methyl-coated non-porous and mesoporous amorphous silica materials of two target sizes (100 and 300 nm; 10–844 m2/g) were used to investigate the potential role of specific surface area (SSA) and porosity on the oral toxicity in mice. Female Swiss mice were administered by oral gavage for 5 consecutive days. Two silica dose levels (100 and 1000 mg/kg b.w.) were tested for all four materials. All dispersions were characterized by transmission electron microscopy (TEM) and Nanoparticle tracking analysis (NTA). Batch dispersions of porous silica were rather unstable due to agglomeration. Animals were sacrificed one day after the last administration or after a three-week recovery period. No relevant toxicological effects were induced by any of the silica materials tested, as evaluated by body weight, gross pathology, relative organ weights (liver, spleen, kidneys), hematology, blood biochemistry, genotoxicity (Comet assay in jejunum cells and micronucleus test in peripheral blood erythrocytes), liver and small intestine histopathology, and intestinal inflammation. The presence of silica particles in the intestine was evaluated by a hyperspectral imaging microscopy system (CytoViva) using histological samples of jejunum tissue. Silica spectral signatures were found in jejunum samples with all the treatments, but only statistically significant in one of the treatment groups.
1. Introduction
Synthetic amorphous silica nanomaterials are produced at a level of million tons and are among the most produced nanomaterials worldwide (Liljenström, Lazarevic, and Finnveden Citation2013). They are broadly used in different industrial sectors, such as food, electronics, construction, and medicine, and a large proportion (>10%) of consumer nano-based products contain silica nanomaterials (Vance et al. Citation2015).
Synthetic amorphous silica (SAS) is widely used as an anti-caking agent (E551) in the food industry (OECD Citation2014). SAS consists of mainly micro-sized aggregates of nano-sized primary particles (Dekkers et al. Citation2013). The consumer intake of SAS from food has been estimated to be around 1.8 mg/kg body weight/day (Dekkers et al. Citation2011).
Murugadoss et al. (Citation2017) reviewed in vitro and in vivo toxicological studies on 7–1000 nm-size SAS materials. In general, for the oral route, only minor or absence of toxicological findings were observed in this review, even at very high doses (1–2.5 g/kg bw/day). No histopathological alterations in the intestine (Yoshida et al. Citation2014; Li et al. Citation2015; Tarantini et al. Citation2015) nor in other organs were reported after gastro-intestinal exposure to SAS (Kim et al. Citation2014). One study reported a small increase in villus heights and crypt depths in jejunum for several types of SAS (van der Zande et al. Citation2014), but later analyses have attributed these differences to slightly different orientation of the histological sections in the controls versus treated groups (Morfeld et al. Citation2017).
Liang et al. (Citation2018) reported no treatment-related local or systemic alterations in a rat oral gavage subchronic study following the OECD Test Guideline (TG) 408 with SAS (25.9 ± 3.4 nm) at doses up to 1500 mg/kg b.w. In contrast, other studies did report adverse effects. Tassinari et al. (Citation2020), conduced another 90-day repeated dose oral toxicity study (also following OECD TG 408) with the SAS NM-203 (13–45 nm). They reported histological alterations on the liver and spleen, and in blood thyroid stimulating hormone and creatinine levels. Histological alterations in the liver and the kidneys were observed in a 18-month chronic exposure of the SAS NM-200 (14–23 nm) in mice via drinking water at 4.8 mg/kg bw/day (Boudard et al. Citation2019). Chen et al. (Citation2018) reported adverse effects in mice orally exposed for 7 days to 2.5 mg/kg b.w./day SiO2 NP (10.8 ± 1.7 nm, crystallinity not reported), by evaluating parameters that are not amongst classical endpoints in OECD test guidelines. In particular, they found increased pro-inflammatory cytokine levels in colons of exposed mice as well as increased microbial species richness and diversity within the intestinal tract.
Silica can be synthesized with controlled size, shape, crystallinity, morphology and porosity, and several of these parameters, as well as the route of synthesis, have been shown to modulate in vitro and/or in vivo biodistribution patterns and toxicity (Murugadoss et al. Citation2017). Given the diversity in the type of silica that can be generated, the existing studies only cover a few types of silica and are not yet sufficient to understand how these different properties affect their toxicity.
Some studies have shown that the porosity of silica affects cell uptake and toxicity (Lin and Haynes Citation2010; Maurer-Jones, Lin, and Haynes Citation2010; Tao et al. Citation2009; Kettiger et al. Citation2015; Yu et al. Citation2012). Most of the evidence derives from in vitro studies and studies evaluating the effects after in vivo exposure are scarce. An intravenous injection study showed a markedly higher toxicity of porous vs. non-porous silica particles. In this case, however, toxicity seemed to be strongly determined by the degree of aggregation. The porous particles led to larger aggregates (based on hydrodynamic sizes) and had a higher potency to induce vascular congestion and consequently lower maximum tolerated dose (Yu et al. Citation2012). The second study evaluated the toxicity of non-porous (SSA: 27 m2/g) and porous SAS (SSA: 495 m2/g and 1027 m2/g) after a single-dose intravenous administration in mice, and did not find histopathological alterations in liver, lung, spleen, or kidney (Hadipour Moghaddam, Mohammadpour, and Ghandehari Citation2019).
The main focus of this study was to evaluate the role of SSA on particle toxicity by using four methyl-coated SAS in a short-term (5-day) repeated oral administration (STOS) in Swiss female mice, followed by a three-week recovery period. Particles varying in size and in porosity were included to account for the main factors affecting particle SSA. Two (non-porous and porous) of these four materials have particle sizes in the upper range of the EC nanomaterial definition, while the two other materials (also porous and non-porous) are in the submicron range. The high SSA of the submicron porous material would also classify it as a nanomaterial. Smaller particle sizes were not used due to technical difficulties in the generation, at a sufficient production yield, of silica powders of these characteristics. All the materials were methyl-coated to minimize the dissolution into ions (Si4+) (Juère et al. Citation2020; Fabjan et al. Citation2020). The study included some systemic toxicity evaluations, although it focused mainly on the evaluation of local effects in the intestine. The test protocol is inspired by the increasingly used short-term inhalation study (STIS) to evaluate toxicity of nanomaterials (Landsiedel et al. Citation2014). Indeed, other authors have already used similar exposure and follow-up periods to evaluate oral toxicity of nanoparticles (e.g. De Jong et al. Citation2019).
2. Materials and methods
2.1. Characterization of test materials
SAS powders of two non-porous and two P6MM mesoporous methyl-coated amorphous silica materials with target sizes of 100 and 300 nm were synthesized at NRCWE (Denmark) using the Stöber process, and methylated to minimize the dissolution into ions (Si4+). A full description of the method and characteristics of the test materials is given elsewhere (Sahlgren et al. Citationforthcoming).
2.1.1. Particle morphology and primary particle sizes
Transmission electron microscopy (TEM) was conducted with a Tecnai T20 G2 – LaB6 microscope, operating at 200 kV and images recorded using a Bottom mounted Ultrascan 1000xp CCD camera at 30 000–100 000× magnification. TEM samples were prepared using a grid-on-drop method after dispersing test materials in distilled water (5 wt.%) by probe-sonication for about 13 min at amplitude of 20% (Branson Digital Sonifier S-450D, Branson Ultrasonics, Danbury, CT, 13 mm model 102 C disrupter horn). Additional TEM characterization was made on a diluted aliquot of the dispersions used for hydrodynamic size analysis using a JEM-2100 HT (JEOL Ltd, Tokyo, Japan) operated at an accelerating voltage of 200 kV (see Section 2.1.4).
2.1.2. Water-loss and methyl-content
Water-loss and concentration of methyl coating was determined by coupled thermogravimetry-mass-spectrometry (TGA-MS) using a STA 449F3 TGA and QMS D Aëolos MS (Netzsch holding; Gebrüder-Netzsch-Strasse, Germany). Adsorbed water was ascribed to TGA mass-loss occurring between 30 and 100 °C. The content of methyl coating was ascribed to a mass-loss event occurring between 395 and 445 °C in 100 nm- and 300 nm-size SAS, and between 165 and 255 °C in porous 100 nm- and porous 300 nm-size SAS. Mass-losses occurring above the episodic methylation-loss temperatures were ascribed to structural water (hydroxyls) and considered part of the silica material. Based on these data, the amount of amorphous silica, methylation, and adsorbed water was calculated for each sample.
2.1.3. Specific surface area
The specific surface areas including porosity were determined using the Brunnauer–Emmett–Teller (BET) nitrogen (−196 °C) gas-adsorption method (Micromeritics TriStar II volumetric adsorption analyzer; Micomeritics Instrument Corporation, Norcross, GA, USA). Before the measurements, the samples were outgassed for 6 h at 120 °C under the flow of nitrogen gas. The BET equation was used to calculate the surface area between 0.05 and 0.3 relative pressures (P/Po).
2.1.4. Hydrodynamic size analysis
SAS (100 mg/mL) dispersions were made in MilliQ-filtered water with Carboxymethyl cellulose-Tween80® (CMC sodium salt high viscosity) Sigma-Aldrich, St. Louis, MO, USA; Tween80® (micellar avg mol wt 79 000, Sigma-Aldrich, St. Louis, MO, USA), at 0.2% (w/v) and 1% (v/v), respectively). Dispersions were achieved by probe sonication using a Labsonic sonicator (VCX750 Ultrasonic Cell Disrupter, VibracellTM, SONICS(R) NewTown, CT, USA). The sonication protocol consisted of a 5-minute sonication in continuous mode at 20% amplitude using a 3 mm × 80 mm tip (Sigma-Aldrich, St. Louis, MO, USA). Sonication was repeated if a satisfactory suspension was not achieved as assessed by visual inspection. The energy applied during one sonication round was calculated to be 6.21 J. After sonication, the dispersion was vortexed and diluted to 10 mg/mL using the CMC-Tween80® vehicle.
Nanoparticle tracking analysis (NTA; Nanosight NS300, Malvern Panalytical, Malvern, UK) was used to determine the hydrodynamic size of the test materials dispersed in the CMC-Tween80® vehicle. The 10 mg/mL stock concentration of each material was diluted using MilliQ water to around 1 µg/mL. The particle suspensions were vortexed immediately before injection into the NTA sample chamber with sterile syringes and then 30 s measurements were performed in triplicate at room temperature.
2.2. Animals and in vivo study design
Swiss female mice (RjOrl:SWISS; 20–24 g of body weight) were obtained from Janvier-Labs (Le Genest-Saint-Isle, France). Animals were housed in groups of 4 individuals per cage in the Animal Facilities of the Barcelona Scientific Park, under a 12:12 h light:dark cycle at 20 ± 2 °C and 55 ± 30% humidity. Mice had ad libitum access to Protein Rodent Maintenance Diet (Ref. 831193 Dietex International Ltd, Witham, UK) and autoclaved water. Animal work was approved by the Animal Welfare Committee (Barcelona Scientific Park, Spain).
Groups of eight mice per treatment and dose level were administered by oral gavage once a day during a period of five consecutive days. The control group was administered the vehicle (CMC-Tween80®) that was used to prepare the particle suspensions. The administration volume was 10 mL/kg body weight (b.w.). Particle dispersions were prepared at 10 mg/mL and 100 mg/mL as described above to obtain 100 mg/kg b.w. (Low dose; LD) and 1000 mg/kg b.w. (high dose; HD), respectively. Two follow-up periods were selected after the last administration: 24-h (day 6 of the experiment) or 21 days (day 26 of the experiment; Recovery group). Two additional groups of 8 animals each were orally administered with Methyl methanesulfonate (MMS, Sigma-Aldrich, St. Louis, MO, USA), a DNA alkylating agent used as a positive control for genotoxicity (Comet assay in the intestine). MMS was administered at 100 mg/kg b.w. during 3 consecutive days, at 48 h, 24 h, and 2–3 h prior to each termination date.
2.3. Toxicological evaluations
Animals were weighed and clinical signs of toxicity were assessed daily during the dosing period. During the 3-week recovery period, these evaluations were performed every 2–3 days. Bodyweight gain was calculated as the percentage relative to the body weight at the start of the study.
2.3.1. Micronuclei in peripheral blood erythrocytes
At termination (day 6 or day 26 of the experiment), animals were anesthetized with Isoflurane (3% + O2 0.8 L/min). One milliliter of whole blood was extracted by cardiac puncture and placed in a tub containing 5 µL of Heparin (1000 U/mL, Merck, Darmstadt, Germany). Five microliters of whole heparinized blood was sampled and diluted 1:5 in fetal bovine serum (FBS, Biowest, Riverside, MO, USA) on a microscopy slide to form a smear, dried overnight and fixated in methanol for micronucleus analysis.
The peripheral blood micronuclei (MN) assay was performed as described before (Lindberg et al. Citation2012), in accordance with TG 474 (OECD Citation2016). The frequencies of micronucleated polychromatic erythrocytes (MNPCEs) and micronucleated normochromatic erythrocytes (MNNCEs), in 2000 polychromatic (PCEs) and normochromatic erythrocytes (NCEs) per mouse, respectively, were analyzed using an Axio Imager Z1 fluorescence microscope (Zeiss, Göttingen, Germany).
For SAS-treated groups, the frequency of peripheral blood MNPCEs was analyzed in animals sacrificed at day 6, whereas the frequency of peripheral blood MNNCEs was assessed in animals sacrificed after the recovery period (day 26). In addition, the frequencies of peripheral blood MNPCEs were analyzed in the negative control and the positive (MMS) control groups at both post-administration times.
2.3.2. Hematology, differential white cell count, and blood biochemistry
Hematological analyses were performed using 150 µL heparinized blood in a hematology analyzer (Abacus JuniorVet, Diatron®, Budapest, Hungary). Additionally, differential leukocyte counting using Wright-Giemsa modified staining was performed by visual evaluation using optical microscopy (Leica DM100®, Wetzlar, Germany). Incidence of morphological variations in leukocytes and incidence of acanthocytes and anisochromia were also recorded.
The remaining blood was centrifuged (10 min, 1500 g at 4 °C) to separate the plasma fraction and analyze aspartate transaminase (AST), alanine transaminase (ALT), creatinine, and total protein concentration using an automatic analyzer (Olympus AU400 analyzer, Tokyo, Japan).
2.3.3. Gross pathology and tissue weight
Immediately after termination, animals were dissected and examined for macroscopic alterations. The intestinal tract was excised and processed as described below for histopathology, the Comet assay, and tumor necrosis factor (TNF-α) levels. Liver, spleen, and kidneys were harvested and weighted, and the left lobule of the liver was preserved for histopathology (see below). Relative organ weights were calculated as the percentage relative to the body weight at the time of sacrifice.
2.3.4. Comet assay in fresh jejunum samples
The Comet assay was performed on fresh jejunum intestinal cells of 5–6 animals per treatment group. Immediately after sacrifice, a piece of 6 cm of jejunum was harvested, intestinal content was gently removed, rinsed with mincing buffer containing Hank’s Balanced Salt Solution (HBSS; Ca+2 and Mg+2 free, Lonza, Pontevedra, Spain), 20 mM ethylenediaminetetraacetic acid (EDTA; Sigma-Aldrich, St. Louis, MO, USA) and 10% (v/v) dimethyl sulfoxide (DMSO; Sigma-Aldrich, St. Louis, MO, USA) at pH = 7.5 at 4 °C. The tissue was minced, suspended in ice-cold phosphate-buffered saline (PBS; Lonza, Pontevedra, Spain), and passed through a 100 µm pore size nylon cell strainers (Corning, Corning, NY, USA). The cell suspensions were centrifuged twice at 1000 rpm at room temperature and the supernatant was discarded.
The Comet assay was performed in alkaline conditions (pH > 13). Briefly, 7.5 × 10³ cells were resuspended in 30 µL molten (37 °C) 0.65% of agarose (LMPA, Sigma-Aldrich, St. Louis, MO, USA). Drops of 7 µL were put onto GelBond® films (Lonza, Pontevedra, Spain) and were allowed to solidify for 5 min at 4–8 °C. The films were immersed in cold lysis solution (2.5 M, NaCl, 100 mM EDTA, 10 mM Tris, 1% (v/v) Triton and 10% (v/v) DMSO) overnight at 4 °C. Films were washed with an alkaline solution (0.3 M NaOH, 1 mM EDTA, pH > 13, at 4 °C) and left 1 h in this solution to allow unwinding, after which they were transferred to an electrophoresis tank. Electrophoresis was performed at 4 °C during 20 min at 300 mA (0.7 V/cm). The films were then washed twice with PBS and once with MilliQ water at 4 °C for neutralizing the effect of the alkaline solution, and fixed overnight in 100% ethanol solution and air-dried at room temperature. The films were then mounted onto glass microscope slides (SuperFrost®Plus, VWR, Radnor, PA, USA). DNA was stained with 10.000 X SYBR® Green (Sigma-Aldrich, St. Louis, MO,USA) solution (Tris 10 mM, 1 mM EDTA at pH = 8) rinsed with MilliQ water and let air-dry.
The DNA was visualized using a fluorescein filter in an epifluorescence microscope (E600, Nikon, Tokyo, Japan) and images captured using a digital camera (DP72, Olympus, Tokyo, Japan). A semi-automated software (Comet Assay IV Software v4.2, Perceptive Instruments Ltd, Bury Saint Edmunds, UK) was used to calculate the percentage of DNA in the Comet tail, which was used as a measure of DNA damage. Around 100 cells per animal, after exclusion of hedgehogs were evaluated, except in the case of MMS treated groups, in which the higher percentage of hedgehogs lead to a lower number of cells available for evaluation (an average of 78 per animal).
2.3.5. Histopathological evaluation of jejunum and liver
Jejunum samples of all the high dose groups at Day 6, and liver of all the high dose groups at Day 26 were evaluated for histopathology.
Two jejunum sections of 2 cm in length separated by 6 cm were dissected. The intestinal content was gently removed. Intestine and liver were fixed with formalin solution (10% neutral buffered formalin solution, Sigma-Aldrich, St. Louis, MO, USA).
Samples were dehydrated and embedded in paraffin using the tissue processor Tissue-Tek VIP 6 (Sakura, Tokyo, Japan) and paraffin blocks were mounted. From each block, 4 μm representative tissue sections were obtained using a microtome (RM2255, Leica, Tokyo, Japan) and stained with routine Hematoxylin and Eosin (H&E) staining using the Dako Cover Stainer CS 100-10304 (Agilent, Lexington, MA, USA), and observed in a microscope (CX43, Olympus, Tokyo, Japan) for histopathological alterations. Continuous sections to those used for histopathology were collected and left unstained for hyperspectral analyses.
2.3.6. TNF-α levels in jejunal mucosa
A section of approximately 5 cm in length was dissected. The intestinal mucosa was removed by gently scratching the lumen surface, placed into an Eppendorf tube and immediately frozen by immersion in liquid nitrogen and kept at −80 °C.
Prior to analysis, intestinal mucosa was thawed in cold RIPA buffer (Sigma-Aldrich, St. Louis, MO, USA) containing complete protease inhibitor (Sigma-Aldrich, St. Louis, MO, USA). These samples were homogenized and incubated using an orbital rotator for 30 min at 4 °C to extract proteins. Samples were then centrifuged for 5 min at 13 000 rpm and 4° C. The supernatant was used to measure protein concentration with a BCA protein assay kit (ThermoScientific, Waltham, MA, USA), and TNF-α levels with a commercial ELISA kit (Bio-Techne, Devens, MA, USA). Control samples spiked with known amounts of TNF-α were used to evaluate the interference of the matrix in the assay. TNF-α levels were normalized per milligram of tissue protein.
2.3.7. Identification of SAS in jejunum sections by hyperspectral analysis
The presence of SAS particles in the jejunum samples was determined by a hyperspectral imaging microscopy system (CytoViva, Inc, Auburn, AL, USA) coupled with an Olympus BX43 optical microscope (Olympus Corporation, Tokyo, Japan). Tissue samples were prepared as described above for histopathology. The images were captured, processed, and analyzed with CytoViva ENVI 4.8 software.
SAS particles were identified following an established protocol (Roth et al. Citation2015) with few modifications. In brief, for each histological preparation, 2 datacubes were captured with the 40× objective (600× magnification) and 0.25 s exposure time. Then, the signal from the datacubes was smoothed with the Savitski-Golay curve fit smoothing algorithm using an 11-bands width, and corrected for the lamp spectrum profile. Next, for each material, histological preparations from animals treated with the highest dose were analyzed to find the pixels-spectra that met a certain criteria of light spectra intensity (5000–16 000 units). The spectral profiles were merged into a reference spectra library (RSL), specific for each material. To improve specificity, the datacubes of untreated samples were subtracted from the RSL of each nanomaterial. Finally, to identify the material spectral signature in the control and treated samples, each material-specific filtered-RSL was used along a pixel-spectral match algorithm (spectra angle mapper (SAM)). The total tissue area of each datacube was quantified using the ROI ENVI 4.8 tool. The total matching pixels within the region of interest (ROI) were scored and reported as the percentage of matching pixels in the tissue.
For confirmation, a second approach based on generating spectral libraries from the SAS stock dispersion (as in Ilves et al. Citation2014; Wen et al. Citation2012; Husain et al. Citation2013) was applied in selected samples. In this approach, SAS stock dispersions were used for creating the spectral libraries along with the SAM classification algorithm to find the localization of matching pixels in the histological images.
2.3.8. Microbiome in feces
Fresh feces were collected at day 1, just before the first administration, and at day 6 of the experiment. They were placed in ice-cold 20% glycerol (Sigma-Aldrich, St. Louis, MO, USA) solution in PBS and kept on ice until storage at −80 °C.
Only samples from controls and high dose groups were analyzed. Four pools of two animals each were processed per experimental group. After homogenization, DNA was extracted using the Stool DNA Isolation Kit (27600, Norgen Biotek, Thorold, ON, Canada), following the supplier instructions. The concentration and quality of extracted DNA were measured through a NanoDrop 2000 C spectrophotometer (Thermo Scientific, Waltham, MA, USA). For metagenomic analysis, fecal samples were subjected to two-step PCR amplification of the V3-V4 region of the bacterial 16S ribosomal RNA gene, using the primers 338 F (5′-ACTCCTACGGGAGGCAGCAG-3′) and 806 R (5′-GGACTACHVGGGTWTCTAAT-3′) as described elsewhere (Nagpal et al. Citation2018). Quality control of the final equimolar-pooled library was performed using a 2100 Bioanalyzer (Agilent) and quantified using qPCR. Sequencing was completed in a MiSeq platform (Illumina), using one MiSeq 500 cycle flow cell, and according to standard protocols. A first quality control of sequence data was performed using the FastQC tool.
For the microbiome analysis, sequencing data were filtered and quality checked with the plugin-based microbiome analysis platform QIIME2 2019.4 (https://qiime2.org; Bolyen et al. Citation2019). The obtained sequence data were demultiplexed and quality filtered (q2-demux plugin), obtaining a median of demultiplexed sequences per sample of 77500. Afterwards, denoising, quality filtering (median, 8500 sequences) and identification of sequence variants was done (q2-deblur). Sequences were clustered (q2 vsearch) at 99% identity and aligned (q2-alignment) and phylogeny constructed (fasttree2 and the q2-phylogeny). Alpha diversity (observed operational taxonomic units – OTUs, Faith’s Phylogenetic Diversity and Shannon Diversity) and beta diversity metrics (weighted and unweighted UniFrac) and principal coordinate analysis were calculated at a depth of 6000 sequences/sample (q2-diversity). Sequence variants were taxonomically classified using classify-sklearn against the Greengenes 13_8 99% OTUs reference sequences.
The artifacts generated with QIIME2 were imported in R studio with qiime2R package (https://github.com/jbisanz/qiime2R) for the statistical analysis and plots generation with RStudio Desktop 1.2.1335, R v3.6.1 (R Core Team) and libraries: phyloseq, microbiome, microbiomeutilities gglot2, vegan, dplyr, ggpubr, knitr, tibble.
2.4. Statistical analysis
All statistical analyses were performed using Prism 6.02 for Windows (GraphPad Software Inc, La Jolla, CA, USA), except those for microbiome data, which were performed using R v3.6.1 (R Core Team). All results are presented as mean and standard error. Statistical analysis was based on the recommendations of the OECD guidance document N° 116 (OECD GD 116, 2012). The normality of the data was evaluated using the Shapiro–Wilk normality test. For data normally distributed, one-way ANOVA followed by multiple comparison test followed by Dunnett’s test was used. Data not following normal distribution or data consisting of percentages were analyzed by Kruskal–Wallis ANOVA by ranks test followed by Dunn’s posthoc test for multiple group comparisons. Fisher’s exact test was used to evaluate the incidence of morphological alterations in blood cells. When comparing only two experimental groups (negative and positive controls in genotoxicity analyses, and exposed versus non-exposed in hyperspectral analyses) unpaired Mann–Whitney U-test was used. For microbiome analyses, PERMANOVA tests with 999 permutations were used to determine whether between-groups distances were significantly different with Weighted and Unweighted Unifrac. In all cases, groups were considered significantly different when the p value <0.05.
3. Results
3.1. Material characterization
Physically, the particles in all samples appeared spherical to sub-spherical. Some of the mesoporous silica particles appeared to be partially aggregated (Supplementary Figure S1). Sahlgren et al. (Citationforthcoming) have shown that the average Feret-sizes of the ‘100 nm-size group,’ were 128 nm (non-porous silica) and 66 nm (porous silica) while they for the ‘300 nm size-group,’ were 301 nm (non-porous silica) and 224 nm (porous silica). Hence all materials varied around their target sizes.
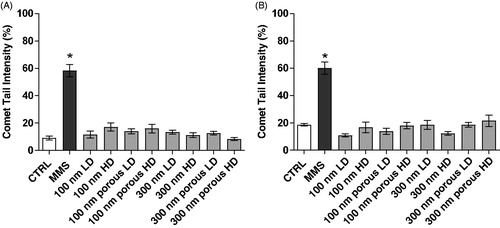
Figure 1. DNA tail intensity (%) of jejunum samples from animals orally administered the vehicle (CTRL), the positive control MMS (100 mg/kg b.w.) or SAS particles and sacrificed at day 6 (A) or day 26 (B). LD: Low dose (100 mg/kg b.w). HD: High dose (1000 mg/kg b.w.). All values are means ± SEM (n = 6). (*) p < 0.05, one-way ANOVA followed by Dunnett’s test (SAS exposed groups vs. control vehicle group) or Mann–Whitney U-test (MMS vs. control vehicle group).
TGA-MS analysis showed that the four test materials contained 1.6–2.8 wt% methylation and had 0.7–5.9 wt% adsorbed water (Supplementary Table S1). Corrected for adsorbed water content, the silica material varied between 97.2 and 98.4 wt% and methylation accounted for 1.6–2.8 wt%. As intended, the materials divided into a high (828 and 844 m2/g) and a low (10–22 m2/g) specific surface area group due to internal and external surface area, respectively.
Table 1. Frequency of micronucleated cells [MNCs, mean (SD)] in 2000 normochromatic (NCEs) and polychromatic (PCEs) peripheral blood erythrocytes of vehicle [0.2% (w/v) CMC + 1% (v/v) Tween80 in MilliQ water], methylated (Me) non-porous (100 and 300 nm) and methylated porous (100 and 300 nm) SAS-treated and methyl methanesulfonate (MMS)-treated mice.
3.1.1. Characterization of nanomaterial dispersions
Dispersed in CMC-Tween80®, TEM micrographs showed aggregates of different sizes for all the materials (from a few particles to large aggregates >1 µm; see Supplementary Figure S2), together with some isolated particles. The hydrodynamic size of the particle dispersions in CMC-Tween80® obtained by NTA was 182 ± 16 nm (100 nm); 173 ± 12 nm (100 nm porous); 322 ± 15 nm (300 nm), and 316 ± 16 nm (300 nm porous).
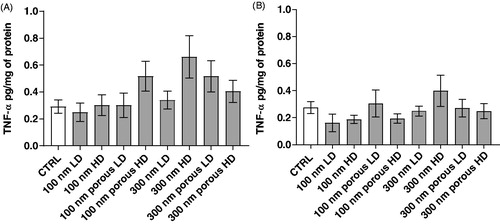
Figure 2. TNF-α levels in jejunal mucosa from animals orally administered the vehicle (CTRL) or SAS particles and sacrificed at day 6 (A) or day 26 (B). LD: Low dose (100 mg/kg b.w). HD: High dose (1000 mg/kg b.w.). All values are means ± SEM (n = 6). No statistically significant differences (p< 0.05) were observed by means of one-way ANOVA followed by Dunnett’s test .
3.2. Toxicological evaluations
3.2.1. Clinical signs and body weight
No clinical signs of toxicity were observed during the study period. No statistically significant differences in body weight and body weight gain were found between the different treatments and the vehicle (Supplementary Table S2).
3.2.2. Gross pathology and organ weights
At sacrifice, no relevant macroscopic abnormalities were observed. Some statistically significant differences between groups were observed in spleen weight (i.e. decrease in the high dose of the 100 nm SAS at day 6, and increase in the high dose of 300 nm porous SAS at day 26) and in liver weight (i.e. increase in the high dose of 300 nm porous SAS at day 26) (Supplementary Table S3).
3.2.3. Hematology, differential white cell count, and blood biochemistry
Only a few statistically significant differences were observed in hematology between the control group and some SAS-treated groups with unclear relation to the treatment and toxicological significance. At day 6, the low dose of 300 nm non-porous SAS showed statistically significant higher mean platelet volume (MPV) and higher platelet volume distribution width (PDWsd (fL) and PDWcv (%)) than the control group. At Day 26, these differences were not observed (Supplementary Table S4).
Some statistically significant differences in red blood cells (RBC) and hemoglobin levels were observed between the control and some exposed groups at day 26 (Supplementary Table S4). But these differences might be due to the particularly high values in the control group observed at day 26.
The differential white cell count showed that the percentage of eosinophils at day 26 for both non-porous 100 nm and porous 300 nm groups at the high dose was statistically higher than the control group (Supplementary Table S4). These differences may be due to the low percentage of eosinophils found in the control group at day 26 (0.38%) in comparison to day 6 (4.75%). Indeed, the animal supplier states an indicative value of 4.10% of eosinophils in the blood of healthy Swiss female mice. No qualitative or quantitative differences in terms of the presence of basophilia, cytoplasmic granulation, or prominent nucleoli were found.
Among the blood biochemistry parameters analyzed, the only statistically significant difference versus the control group was a decrease in creatinine content for the 100 nm low dose group on day 26, with no toxicological relevance (Supplementary Table S4).
3.2.4. Histopathological evaluation of jejunum and liver
All the groups, including control groups at both time points (day 6 and day 26), presented minor histopathological findings in the small intestine: mild cellular infiltrate, necrotic/apoptotic cells, and vacuolated cells (Supplementary Figure S3), normally presented in the lamina propria of the intestinal villi. These variations were of low incidence and severity and were not treatment-related.
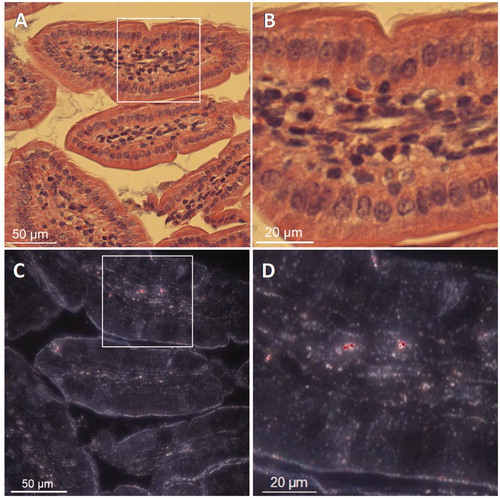
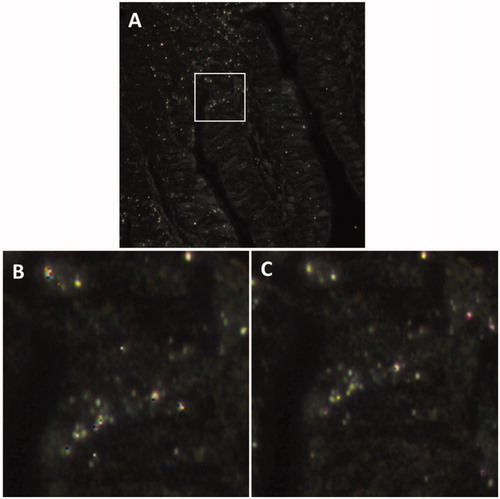
Figure 3. Microscopy image from a jejunum section of a swiss female mouse treated with 1000 mg/kg b.w. 100 nm non-porous SAS. (B) Magnification of the image (A) white contour square area. (C) Image obtained with hyperspectral imaging microscopy from the same field of a consecutive jejunum section of image (A). Colored pixels indicate a spectral match with the RSL for 100 nm non-porous SAS. (D) Magnification of the image C white contour square area.
No relevant hepatic lesions were present in any of the samples. Irrespective of the group, including the control group, a low number of small foci of mixed inflammatory cell infiltrates with the presence of isolated necrotic hepatocytes were observed (Supplementary Figure S4). In some of the samples, a slight mononuclear inflammatory cell infiltrate was also observed in portal spaces. These multifocal inflammatory lesions were considered background lesions frequently found in mice maintained in conventional animal facilities.
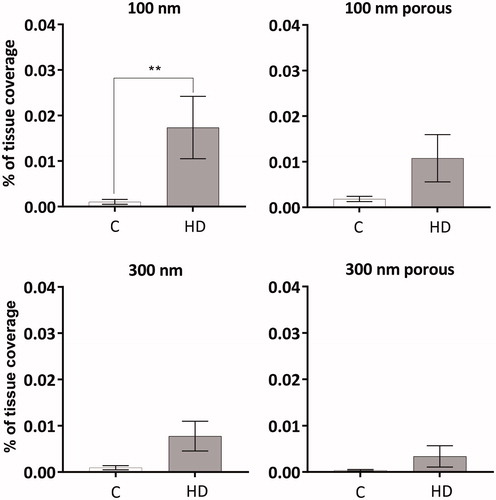
Figure 4. Percentage of matching pixels within the specified the tissue area of control and treated animals. HD: High dose (1000 mg/kg b.w.). All values are means + SEM (n = 7). Mann–Whitney U-test (**) p < 0.01.
3.2.5. Genotoxicity
No differences compared to the control group in the frequency of micronucleated (MN) normochromatic erythrocytes (NCEs) or polychromatic erythrocytes (PCEs) in peripheral blood at any of the post-administration times were observed (). The frequency of MNNCEs reflects chromosome damage accumulated from the beginning of the treatment until about 60 h before the blood sampling, whereas the frequency of MNPCEs assesses chromosome damage that occurred 36–48 h before the sampling. For this reason, the frequency of MNPCEs was assessed for day 6 samples. In all silica particle treatments, the percentage of PCEs among blood erythrocytes was similar to the values of the negative control group, indicating that the particles did not induce bone marrow toxicity. The positive control treatment (MMS) increased the frequency of MNPCEs in peripheral blood by 8.6-fold at day 6 and 14.4-fold at day 26 in comparison with the negative control. MMS did not, however, affect the frequency of micronuclei in NCEs of peripheral blood, as expected due to the shorter treatment. MMS slightly reduced the percentage of PCEs in peripheral blood ().
No significant differences were observed in the percentage of DNA in tail in intestinal cells at day 6 or 26 () between the negative control and the silica-treated groups. The positive control (MMS) showed a clear statistically significant increase in the percentage DNA in tail compared to the negative control ().
3.2.6. Inflammatory markers in jejunal mucosa
There was a trend toward elevated TNF-α levels in the intestinal mucosa of some SAS-exposed groups vs. the vehicle control group. However, none of the values reached statistical significance at any of the time points evaluated ().
3.2.7. Hyperspectral analyses
Example images (histology and hyperspectral) for animals treated with 100 nm non-porous silica are presented in , and example images for all remaining experimental groups and controls are shown in Supplementary material (Supplementary Figures S7–S11). The percentage of matching pixels per tissue (number of colored pixels in tissue pixels) showed high variability for all SAS-treated groups, and only for non-porous 100 nm SAS a statistically significant difference when compared to the controls was observed (). The localization of matching pixels from the analysis based on RSL from the stock particle dispersions was consistent with the matching pixels in the analysis based on RSL from intestinal tissue slides of treated animals ().
Figure 5. Comparison of two material specific reference spectral libraries: obtained from a treated mouse or from the SAS stock dispersion. The hyperspectral microscopy images correspond to a jejunum section of a mouse treated with 1000 mg/kg b.w. 100 nm porous SAS from the follow-up group (26 days). (B) and (C) are magnifications of image (A) white contour square area, analyzed using a RSL obtained from jejunum sections of a treated mouse (B) or using a RSL obtained from the stock SAS dispersion (C).
3.2.8. Microbiome study in feces
A total of 661 different OTUs were detected with the 99% OTU clustering. The two most abundant families across the different study groups were S24-7 and Rikenellaceae (Supplementary Figure S5), both belonging to the phylum Bacteroidetes. Alpha diversity analyses showed no differences in the Shannon diversity index or in the phylogenetic diversity index amongst the different groups after 6 days of administration. However, there was a trend toward a reduction on the diversity among all the groups (including controls) compared to the values recorded on day 1, reaching statistical significance only for some of the groups ().
Figure 6. Box-plots illustrating (A) Shannon diversity index and (B) phylogenetic diversity prior to the first administration and at day 6 for controls and SAS-treated groups. Median values and interquartile ranges have been indicated in the plots. Kruskal–Wallis pairwise test, (*) denotes p < 0.05.
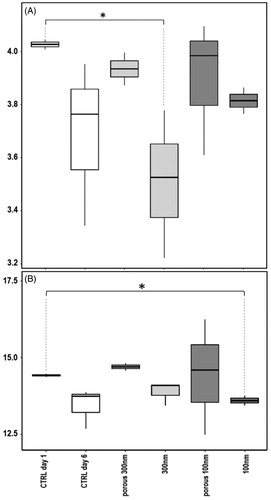
No effect on phylogenetic diversity was observed, neither based on taxa abundances (p = 0.28; weighted UniFrac), nor for observed taxa based on incidence (p = 0.696; unweighted UniFrac). Principal coordinate analysis showed no specific clustering (Supplementary Figure S6).
4. Discussion
No local or systemic toxicity (including genotoxicity) were observed after short-term oral exposure to neither 100 or 300 nm-size non-porous or mesoporous SAS up to 1 g/kg in mice. The study was mostly focused on evaluating local toxicity and included histopathology, evaluation of pro-inflammatory cytokines in the intestinal mucosa, potential induction of DNA damage in the jejunum epithelial cells, as well as evaluation of effects on the intestinal microbiome.
The lack of histopathological effects in the intestine are consistent with most previous studies in rodents investigating oral toxicity of porous (Fu et al. Citation2013; Li et al. Citation2015) or non-porous SAS (Kim et al. Citation2014; Yun et al. Citation2015; Yoshida et al. Citation2014; Kim et al. Citation2017; Liang et al. Citation2018; Tassinari et al. Citation2020). Some of the previous studies had included similar high doses (following the recommendations for dose selection of the OECD test guidelines) or even much longer administration periods. Chen et al. (Citation2018) reported only minor histological effects in the colon after 7-day oral gavage administration of 11 nm silica in mice.
The study by Chen et al. (Citation2018) reported increased levels of pro-inflammatory markers, namely IL-1β, IL-6, and TNF-α, in the colon. Also in oral toxicity studies for other nanomaterials, increased levels of proinflammatory markers have been reported at doses that did not induce histopathological changes (Bettini et al. Citation2017). Evaluation of cytokine levels in tissues is challenging due to the potential interference of the matrix in the quantification Elisa kits. We conducted preliminary experiments with spiked samples to evaluate recovery and linearity in the response. Although we attempted to evaluate S100A8/A9 levels, the matrix affected the robustness of the assay and this test was finally not included. Assay protocols suggested by kit suppliers and mostly optimized for the detection of cytokine levels in serum or cell supernatants may not be adequate for other types of matrices. It is unclear in previous publications assessing cytokine levels in tissues whether such type of controls were evaluated. The assay for TNF-α was robust when applied to evaluate levels in intestinal mucosa, but no differences between any of the treated groups and the control group were observed.
In our study, neither non-porous or mesoporous SAS caused any detectable genotoxicity locally in the jejunum (evaluated by the Comet assay) or systemically (evaluated by the mammalian erythrocyte micronucleus assay) at the end of the administration period and after the three-week recovery period. Kwon, Koedrith, and Seo (Citation2014) and Tarantini et al. (Citation2015) also reported no genotoxicity after oral exposure to SAS, but Kwon, Koedrith, and Seo (Citation2014) focused on other tissues, and Tarantini et al. (Citation2015) used considerably lower doses. Kwon, Koedrith, and Seo (Citation2014) administered 20 and 100 nm non-porous SAS three consecutive times by oral gavage to male rats up to a 2000 mg/kg b.w. and used the Comet assay to evaluate the genotoxicity in the stomach and the liver. In the same study, mice were orally administered twice using the same dose levels and the micronucleus assay was performed in the bone marrow. In both rodent species, no genotoxicity was observed. Tarantini et al. (Citation2015) reported no effects on DNA damage by the Comet assay in several organs and tissues (duodenum, colon, bone marrow, blood, kidney, spleen and liver) of rats orally administered three times (48, 24, and 3 hours before sacrifice) with four different SAS (primary size from 17.7 to 24.7 nm), although they only tested doses up to 20 mg/kg b.w.
Genotoxicity of SAS has also been studied by other administration routes. Intravenous administration of SAS caused a significant effect at very high doses. In the study by Downs et al. (Citation2012), SAS (15 nm and 55 nm; SSA: 200 m2/g and 50 m2/g) caused a small, but significant increase in DNA damage in liver (15 nm SAS) and circulating micronucleated reticulocytes (both 15 and 55 nm SAS) when intravenously tested at the maximum tolerated dose (3 consecutive daily administrations at 50 mg/kg b.w., with evaluation 3 hours after the last administration). The same 15 nm SAS induced no significant effects in the standard Comet assay in liver, but induced a statistically significant increase in liver DNA damage evaluated by the hOGG1 Comet assay, which involves an oxidative damage probably induced as a consequence of the inflammatory response (Pfuhler et al. Citation2017). In contrast, Guichard et al. (Citation2015) reported no genotoxicity (Comet and micronucleus assays) in rats administered three consecutive daily intravenous doses of 24.7 nm SAS (SSA: 204 m2/g) up to 20 mg/kg b.w. Intratracheal instillation studies have neither shown genotoxic effects with single (Maser et al. Citation2015) or cumulative doses up to 36 mg/kg SAS (Guichard et al. Citation2015) in the range of 15–55 nm. Our study adds supporting evidence to the lack of genotoxicity of SAS, consistently with previous oral and intratracheal instillation studies. Internal doses achieved in the intravenous studies that observed (probably secondary) genotoxicity are predicted to be much higher than those reached by oral or intracheal instillation studies.
The four materials that we investigated in this study have also been evaluated in an intratracheal instillation study. In that case, the introduction of porosity increased the toxicity of silica particles per mass unit (Hadrup et al. Citationforthcoming).
Beyond local toxicity, one of the main concerns of insoluble nanoparticle exposure is the potential systemic absorption and consequent long-term accumulation. Hyperspectral imaging is a relatively new technique to assess the presence and distribution of nanomaterials in biological samples in a label-free manner, allowing minimal interference with the sample integrity, which permits its assessment with other methods later. Several studies using an hyperspectral image system have been performed to detect different type of metallic, metal oxides, and even organic NPs in a variety of tissues (Ilves et al. Citation2014; Husain et al. Citation2013; Talamini et al. Citation2017; Holian et al. Citation2019). In some studies, inductively coupled plasma mass spectrometry (ICP-MS) has been used to confirm the results of hyperspectral data (Talamini et al. Citation2017). In this case, measuring silicon via ICP-MS would be challenging due to the ubiquitous presence of silica in labware and the analytical equipment and the natural-occurring silicon background in tissues (Aureli et al. Citation2020).
In this study, the presence of silica particles in the jejunum of treated mice was assessed through a hyperspectral imaging system. Analysis of tissue samples by hyperspectral is complex due to the interference of the matrix in the particle scattering properties (Roth et al. Citation2015). In addition, in an oral administration study, the physicochemical properties of test materials might change along the gastrointestinal tract and consequently affect the particle scattering properties (Walczak et al. Citation2015). For these reasons, the RSL were generated from the treated samples. In parallel, RSL generated from the stock particle dispersions were used in some samples for confirmation, and consistent localization of pixels was observed. However, the overall percentage of matching pixels was lower when evaluated using RSL generated from the stock dispersions than when generated from the exposed tissues, possibly due to the reasons described above. These two approaches to generate RSL are the most commonly used in previous studies. The results of the hyperspectral analyses suggest the presence of silica in intestinal tissue of exposed animals. Statistically significant differences vs. the control group were only recorded for the 100 nm non-porous SAS group. This test material corresponds to the smallest particle size tested and possibly the smallest particle agglomerates, due to an observed higher tendency to agglomerate of high-porosity particles. Nevertheless, the high intra- and inter-individual variability, related to the irregular distribution of the different silica particles in the tissues, may have hindered the detection of statistically significant differences versus the controls for other groups. Note that the use of material-specific RSL only allowed comparisons toward respective control groups, but not across particle-exposed groups.
No treatment related effects were observed in the microbiome analyses. Some significant differences were found when comparing feces collected on day 6 versus those on day 1 of the study, in the Shannon (100 nm SAS) and phylogenetic (300 nm SAS) diversity indexes. Such effects are likely to be related to the vehicle rather than the test material, as no statistically significant differences between control and treated groups at day 6 were recorded.
We only identified another study (Chen et al. Citation2018) evaluating effects on microbiota after oral administration of silica nanomaterials. They administered 11 nm silica to mice for seven days and reported an increase in microbial species richness and diversity. In our study, much higher doses did not lead to significant effects. The differences between these two studies might be related to the considerably larger particle sizes and surface methylation of silica particles in our study, but also the fact that potential effects associated to the vehicle (explaining differences between in diversity indexes day 1 and day 6 of the study) might have masked particle-related effects in our study.
One of the main goals of the study was to investigate the role of meso-porosity-driven high specific surface area in the oral toxicity of SAS. Owing to the lack of test-item related adverse responses in all the parameters evaluated, it is concluded that none of the tested non-porous and high porosity SAS materials induced adverse effects. The clear differences that were observed in primary particle characteristics, dispersibility and handling of these four silica dispersions (i.e. high propensity to aggregation of the porous particles) did not translate into different biological responses. It should be noted that the sizes of the particles tested ranged from the upper limit or above the regulatory size-definition of nanomaterials and the aim was to investigate the role of specific surface area in this scenario. It should also be noted that the SAS particles were methylated to minimize dissolution of Si4+ ions, whereas such coating is, to our knowledge, not used in food grade silica. Smaller-size and uncoated silica particles, as tested in some previous studies may show a different pattern of effects.
TNAN-2020-OR-0197-File002.docx
Download MS Word (32.1 MB)Acknowledgements
The authors thank Dr. J.L. Muñoz for the calibration of the sonicator tips and calculation of the energy delivered by the sonication protocols, and Dr. Joana Bastos for her technical support during necropsies. JC, IG, SV and GJ acknowledge Gen. Cat. 2017SGR1759.
Disclosure statement
In accordance with Taylor & Francis policy and our ethical obligations, we inform that Rambabu Atluri owns the company INFINGENT Innovations AB (Sweden) who develops and produces silica materials for commercial purposes. The authors do not have any other identified potential conflicts of interest.
Data availability statement
The data that support the findings of this study are mostly available within its supplementary materials. Any further data are available from the corresponding author [GJ], upon reasonable request.
Additional information
Funding
References
- Aureli, F., M. Ciprotti, M. D’Amato, E. do Nascimento da Silva, S. Nisi, D. Passeri, A. Sorbo, et al. 2020. “Determination of Total Silicon and SiO(2) Particles Using an ICP-MS Based Analytical Platform for Toxicokinetic Studies of Synthetic Amorphous Silica.” Nanomaterials (Basel, Switzerland) 10 (5): 888. doi:10.3390/nano10050888.
- Bettini, S., E. Boutet-Robinet, C. Cartier, C. Coméra, E. Gaultier, J. Dupuy, N. Naud, et al. 2017. “Food-Grade TiO2 Impairs Intestinal and Systemic Immune Homeostasis, Initiates Preneoplastic Lesions and Promotes Aberrant Crypt Development in the Rat Colon.” Scientific Reports 7: 40373. doi:10.1038/srep40373.
- Bolyen, E., J. R. Rideout, M. R. Dillon, N. A. Bokulich, C. C. Abnet, G. A. Al-Ghalith, H. Alexander, et al. 2019. “Reproducible, Interactive, Scalable and Extensible Microbiome Data Science Using QIIME 2.” Nature Biotechnology 37 (8): 852–857. doi:10.1038/s41587-019-0209-9.
- Boudard, D., F. Aureli, B. Laurent, N. Sturm, A. Raggi, E. Antier, L. Lakhdar, et al. 2019. “Chronic Oral Exposure to Synthetic Amorphous Silica (NM-200) Results in Renal and Liver Lesions in Mice.” Kidney International Reports 4 (10): 1463–1471. doi:10.1016/j.ekir.2019.06.007.
- Chen, L., J. Liu, Y. Zhang, G. Zhang, Y. Kang, A. Chen, X. Feng, and L. Shao. 2018. “The Toxicity of Silica Nanoparticles to the Immune System.” Nanomedicine (London, England) 13 (15): 1939–1962. doi:10.2217/nnm-2018-0076.
- De Jong, W. H., E. De Rijk, A. Bonetto, W. Wohlleben, V. Stone, A. Brunelli, E. Badetti, A. Marcomini, I. Gosens, and F. R. Cassee. 2019. “Toxicity of Copper Oxide and Basic Copper Carbonate Nanoparticles after Short-Term Oral Exposure in Rats.” Nanotoxicology 13 (1): 50–72. doi:10.1080/17435390.2018.1530390.
- Dekkers, S., H. Bouwmeester, P. M. J. Bos, R. J. B. Peters, A. G. Rietveld, and A. G. Oomen. 2013. “Knowledge Gaps in Risk Assessment of Nanosilica in Food: Evaluation of the Dissolution and Toxicity of Different Forms of Silica.” Nanotoxicology 7 (4): 367–377. doi:10.3109/17435390.2012.662250.
- Dekkers, S., P. Krystek, R. J. B. Peters, D. P. K. Lankveld, B. G. H. Bokkers, P. H. van Hoeven-Arentzen, H. Bouwmeester, and A. G. Oomen. 2011. “Presence and Risks of Nanosilica in Food Products.” Nanotoxicology 5 (3): 393–405. doi:10.3109/17435390.2010.519836.
- Downs, T. R., M. E. Crosby, T. Hu, S. Kumar, A. Sullivan, K. Sarlo, B. Reeder, et al. 2012. “Silica Nanoparticles Administered at the Maximum Tolerated Dose Induce Genotoxic Effects through an Inflammatory Reaction While Gold Nanoparticles Do Not.” Mutation Research/Genetic Toxicology and Environmental Mutagenesis 745 (1–2): 38–50. doi:10.1016/j.mrgentox.2012.03.012.
- Fabjan, E. S., P. Nadrah, A. Ajdovec, M. Tomšič, G. Dražić, M. Mazaj, N. Z. Logar, et al. 2020. “Colorimetric Cutoff Indication of Relative Humidity Based on Selectively Functionalized Mesoporous Silica.” Sensors and Actuators B Chemistry 316 (April): 128–138.
- Fu, C., T. Liu, L. Li, H. Liu, D. Chen, and F. Tang. 2013. “The Absorption, Distribution, Excretion and Toxicity of Mesoporous Silica Nanoparticles in Mice following Different Exposure Routes.” Biomaterials 34 (10): 2565–2575. doi:10.1016/j.biomaterials.2012.12.043.
- Guichard, Y., M. A. Maire, S. Sébillaud, C. Fontana, C. Langlais, J. C. Micillino, C. Darne, et al. 2015. “Genotoxicity of Synthetic Amorphous Silica Nanoparticles in Rats following Short-Term exposure. Part 2: intratracheal instillation and intravenous injection.” Environ Mol Mutagen 56 (2): 228–244. doi:10.1002/em.21928.
- Hadipour Moghaddam, S. P., R. Mohammadpour, and H. Ghandehari. 2019. “In Vitro and In Vivo Evaluation of Degradation, Toxicity, Biodistribution, and Clearance of Silica Nanoparticles as a Function of Size, Porosity, Density, and Composition.” Journal of Controlled Release: Official journal of the Controlled Release Society 311–312: 1–15. doi:10.1016/j.jconrel.2019.08.028.
- Hadrup, N., K. Aimonen, M. Ilves, H. Lindberg, R. Atluri, N. M. Sahlgren, N. R. Jacobsen, et al. forthcoming. “Pulmonary Toxicity of Synthetic Amorphous Silica – Effects of Porosity and Copper Oxide Doping.” Submitted to Nanotoxicology.
- Holian, A., R. F. Hamilton, Z. Wu, S. Deb, K. L. Trout, Z. Wang, R. Bhargava, and S. Mitra. 2019. “Lung Deposition Patterns of MWCNT Vary with Degree of Carboxylation.” Nanotoxicology 13 (2): 143–159. doi:10.1080/17435390.2018.1530392.
- Husain, M., A. T. Saber, C. Guo, N. R. Jacobsen, K. A. Jensen, C. L. Yauk, A. Williams, et al. 2013. “Pulmonary Instillation of Low Doses of Titanium Dioxide Nanoparticles in Mice Leads to Particle Retention and Gene Expression Changes in the Absence of Inflammation.” Toxicology and Applied Pharmacology 269 (3): 250–262. doi:10.1016/j.taap.2013.03.018.
- Ilves, M., J. Palomäki, M. Vippola, M. Lehto, K. Savolainen, T. Savinko, and H. Alenius. 2014. “Topically Applied ZnO Nanoparticles Suppress Allergen Induced Skin Inflammation but Induce Vigorous IgE Production in the Atopic Dermatitis Mouse Model.” Particle and Fibre Toxicology 11 (1): 38. doi:10.1186/s12989-014-0038-4.
- Juère, E., G. Del Favero, F. Masse, D. Marko, A. Popat, J. Florek, R. Caillard, et al. 2020. “Gastro-protective Protein-Silica Nanoparticles Formulation for Oral Drug Delivery: In Vitro Release, Cytotoxicity and Mitochondrial Activity.” European Journal of Pharmaceutics and Biopharmaceutics: Official Journal of Arbeitsgemeinschaft fur Pharmazeutische Verfahrenstechnik e.V 151: 171–180. doi:10.1016/j.ejpb.2020.03.015.
- Kettiger, H., D. Sen Karaman, L. Schiesser, J. M. Rosenholm, and J. Huwyler. 2015. “Comparative Safety Evaluation of Silica-Based Particles.” Toxicology In Vitro 30 (1 Pt B): 355–363. doi:10.1016/j.tiv.2015.09.030.
- Kim, J. H., C. S. Kim, R. M. C. Ignacio, D. H. Kim, M. E. J. Sajo, E. H. Maeng, X. F. Qi, et al. 2014. “Immunotoxicity of Silicon Dioxide Nanoparticles with Different Sizes and Electrostatic Charge.” International Journal of Nanomedicine 9: 183–193.
- Kim, M., J. H. Park, H. Jeong, J. Hong, W. S. Choi, B. H. Lee, and C. Y. Park. 2017. “An Evaluation of the In Vivo Safety of Nonporous Silica Nanoparticles: Ocular Topical Administration versus Oral Administration.” Scientific Reports 7 (1): 1–8. doi:10.1038/s41598-017-08843-9.
- Kwon, J. Y., P. Koedrith, and Y. R. Seo. 2014. “Current Investigations into the Genotoxicity of Zinc Oxide and Silica Nanoparticles in Mammalian Models in Vitro and in Vivo: Carcinogenic/Genotoxic Potential, Relevant Mechanisms and Biomarkers, Artifacts, and Limitations.” International Journal of Nanomedicine 9: 271–286.
- Landsiedel, R., L. Ma-Hock, T. Hofmann, M. Wiemann, V. Strauss, S. Treumann, W. Wohlleben, S. Gröters, K. Wiench, and B. van Ravenzwaay. 2014. “Application of Short-Term Inhalation Studies to Assess the Inhalation Toxicity of Nanomaterials.” Particle and Fibre Toxicology 11: 16. doi:10.1186/1743-8977-11-16.
- Li, L., T. Liu, C. Fu, L. Tan, X. Meng, and H. Liu. 2015. “Biodistribution, Excretion, and Toxicity of Mesoporous Silica Nanoparticles after Oral Administration Depend on Their Shape.” Nanomedicine: Nanotechnology, Biology, and Medicine 11 (8): 1915–1924. doi:10.1016/j.nano.2015.07.004.
- Liang, C. L., Q. Xiang, W. M. Cui, J. Fang, N. N. Sun, X. P. Zhang, Y. N. Li, H. Yang, Z. Yu, and X. D. Jia. 2018. “Subchronic Oral Toxicity of Silica Nanoparticles and Silica Microparticles in Rats.” Biomedical and Environmental Sciences: BES 31 (3): 197–207. doi:10.3967/bes2018.025.
- Liljenström, C., D. Lazarevic, and G. Finnveden. 2013. Silicon-based nanomaterials in a life-cycle perspective, including a case study on self-cleaning coatings. ISBN 978-91-7501-942-0.
- Lin, Y. S., and C. L. Haynes. 2010. “CH2-Hemolysis and Size Different MSN.” Journal of the American Chemical Society 132 (13): 4834–4842. doi:10.1021/ja910846q.
- Lindberg, H. K., G. C.-M. Falck, J. Catalán, A. J. Koivisto, S. Suhonen, H. Järventaus, E. M. Rossi, et al. 2012. “Genotoxicity of Inhaled Nanosized TiO(2) in Mice.” Mutation Research 745 (1–2): 58–64. doi:10.1016/j.mrgentox.2011.10.011.
- Maser, E., M. Schulz, U. G. Sauer, M. Wiemann, L. Ma-Hock, W. Wohlleben, A. Hartwig, and R. Landsiedel. 2015. “In Vitro and in Vivo Genotoxicity Investigations of Differently Sized Amorphous SiO2 Nanomaterials.” Mutation Research. Genetic Toxicology and Environmental Mutagenesis 794: 57–74. doi:10.1016/j.mrgentox.2015.10.005.
- Maurer-Jones, M. A., Y. S. Lin, and C. L. Haynes. 2010. “Functional Assessment of Metal Oxide Nanoparticle Toxicity in Immune Cells.” ACS Nano 4 (6): 3363–3373. doi:10.1021/nn9018834.
- Morfeld, P., A. Bosch, K. Weber, M. Heinemann, and N. Krueger. 2017. “Synthetic Amorphous Silica in Food: Findings about “Liver Fibrosis “and Other Study-Related Findings in Van der Zande et al. (2014) are Questionable.” EC Pharmacology and Toxicology 3.2: 49–61.
- Murugadoss, S., D. Lison, L. Godderis, S. Van Den Brule, J. Mast, F. Brassinne, N. Sebaihi, and P. H. Hoet. 2017. “Toxicology of Silica Nanoparticles: An Update.” Archives of Toxicology 91 (9): 2967–3010. doi:10.1007/s00204-017-1993-y.
- Nagpal, R., S. Wang, L. C. Solberg Woods, O. Seshie, S. T. Chung, C. A. Shively, T. C. Register, S. Craft, D. A. McClain, and H. Yadav. 2018. “Comparative Microbiome Signatures and Short-Chain Fatty Acids in Mouse, Rat, Non-Human Primate, and Human Feces.” Frontiers in Microbiology 9: 2897. doi:10.3389/fmicb.2018.02897.
- OECD. 2014. Guidance Document 116 on the Conduct and Design of Chronic Toxicity and Carcinogenicity Studies, Supporting Test Guidelines 451, 452 and 453: Second Edition, OECD Series on Testing and Assessment, No. 116. Paris: OECD Publishing.
- OECD. 2016. Test No. 474: Mammalian Erythrocyte Micronucleus Test, OECD Guidelines for the Testing of Chemicals, Section 4. Paris: OECD Publishing.
- Pfuhler, S., T. R. Downs, A. J. Allemang, Y. Shan, and M. E. Crosby. 2017. “Weak Silica Nanomaterial-Induced Genotoxicity Can Be Explained by Indirect DNA Damage as Shown by the OGG1-Modified Comet Assay and Genomic Analysis.” Mutagenesis 32 (1): 5–12. doi:10.1093/mutage/gew064.
- Roth, G. A., M. D. P. S. Peña, N. M. Neu-Baker, S. Tahiliani, and S. A. Brenner. 2015. “Identification of Metal Oxide Nanoparticles in Histological Samples by Enhanced Darkfield Microscopy and Hyperspectral Mapping.” Journal of Visualized Experiments (106): e53317. doi:10.3791/53317.
- Sahlgren, N. M., R. Atluri, O. Aguerre-Chariol, Y. Kembouche, P. A. Clausen, and K. A. Jensen. forthcoming. “Physicochemical Characteristics of Mesoporous Silica with and without CuO-Doping and Their Dissolution in Artificial Lung Fluids.”
- Talamini, L., M. B. Violatto, Q. Cai, M. P. Monopoli, K. Kantner, Ž. Krpetić, A. Perez-Potti, et al. 2017. “Influence of Size and Shape on the Anatomical Distribution of Endotoxin-Free Gold Nanoparticles.” ACS Nano 11 (6): 5519–5529. doi:10.1021/acsnano.7b00497.
- Tao, Z., B. B. Toms, J. Goodisman, and T. Asefa. 2009. “Mesoporosity and Functional Group Dependent Endocytosis and Cytotoxicity of Silica Nanomaterials.” Chemical Research in Toxicology 22 (11): 1869–1880. doi:10.1021/tx900276u.
- Tarantini, A., R. Lanceleur, A. Mourot, M. T. Lavault, G. Casterou, G. Jarry, K. Hogeveen, and V. Fessard. 2015. “Toxicity, Genotoxicity and Proinflammatory Effects of Amorphous Nanosilica in the Human Intestinal Caco-2 Cell Line.” Toxicology In Vitro: Vitro 29 (2): 398–407. doi:10.1016/j.tiv.2014.10.023.
- Tassinari, R., G. Di Felice, C. Butteroni, B. Barletta, S. Corinti, F. Cubadda, F. Aureli, et al. 2020. “Hazard Identification of Pyrogenic Synthetic Amorphous Silica (NM-203) after Sub-Chronic Oral Exposure in Rat: A Multitarget Approach.” Food and Chemical Toxicology 137: 111168. doi:10.1016/j.fct.2020.111168.
- van der Zande, M., R. J. Vandebriel, M. J. Groot, E. Kramer, Z. E. Herrera Rivera, K. Rasmussen, J. S. Ossenkoppele, et al. 2014. “Sub-Chronic Toxicity Study in Rats Orally Exposed to Nanostructured Silica.” Particle and Fibre Toxicology 11 (1): 8. doi:10.1186/1743-8977-11-8.
- Vance, M. E., T. Kuiken, E. P. Vejerano, S. P. McGinnis, M. F. Hochella, D. Rejeski, M. S. Hull, and M. S. Hull. 2015. “Nanotechnology in the Real World: Redeveloping the Nanomaterial Consumer Products Inventory.” Beilstein Journal of Nanotechnology 6: 1769–1780. doi:10.3762/bjnano.6.181.
- Walczak, A. P., E. Kramer, P. J. M. Hendriksen, R. Helsdingen, M. van der Zande, I. M. C. M. Rietjens, and H. Bouwmeester. 2015. “In Vitro Gastrointestinal Digestion Increases the Translocation of Polystyrene Nanoparticles in an in Vitro Intestinal co-Culture Model.” Nanotoxicology 9 (7): 886–894. doi:10.3109/17435390.2014.988664.
- Wen, C. -J., L. -W. Zhang, S. A. Al-Suwayeh, T. -C. Yen, and J. -Y. Fang. 2012. “Theranostic Liposomes Loaded with Quantum Dots and Apomorphine for Brain Targeting and Bioimaging.” International Journal of Nanomedicine 7: 1599–1611. doi:10.2147/IJN.S29369.
- Yoshida, T., Y. Yoshioka, H. Takahashi, K. Misato, T. Mori, T. Hirai, K. Nagano, et al. 2014. “Intestinal Absorption and Biological Effects of Orally Administered Amorphous Silica Particles.” Nanoscale Research Letters 9 (1): 532–537. doi:10.1186/1556-276X-9-532.
- Yu, T., K. Greish, L. D. McGill, A. Ray, and H. Ghandehari. 2012. “Influence of Geometry, Porosity, and Surface Characteristics of Silica Nanoparticles on Acute Toxicity: Their Vasculature Effect and.” ACS Nano 6 (3): 2289–2301. doi:10.1021/nn2043803.
- Yun, J. -W., S. -H. Kim, J. -R. You, W. H. Kim, J. -J. Jang, S. -K. Min, H. C. Kim, et al. 2015. “Comparative Toxicity of Silicon Dioxide, Silver and Iron Oxide Nanoparticles after Repeated Oral Administration to Rats.” Journal of Applied Toxicology: JAT 35 (6): 681–693. doi:10.1002/jat.3125.