
Abstract
The interaction between engineered nanoparticles and the bacterial lipopolysaccharide, or endotoxin, is an event that warrants attention. Endotoxin is one of the most potent stimulators of inflammation and immune reactions in human beings, and is a very common contaminant in research labs. In nanotoxicology and nanomedicine, the presence of endotoxin on the nanoparticle surface affects their biological properties leading to misinterpretation of results. This review discusses the importance of detecting the endotoxin contamination on nanoparticles, focusing on the current method of endotoxin detection and their suitability for nanoparticulate materials. Conversely, the capacity of nanoparticles to bind endotoxin can be enhanced by functionalization with endotoxin-capturing molecules, opening the way to the development of novel endotoxin detection assays.
Introduction
In the last decades, engineered nanoparticles (NPs) have been increasingly explored for their use in industrial applications as well as in medicine. NPs are used in food, cosmetic, and textile industries. In diagnostic technologies, NPs are used as sensors to detect analytes at low concentrations or to image biological processes at cellular level. In medicine, NPs are used in diagnostic imaging and as drug delivery systems (Bobo et al. Citation2016).
Due to the increasing NP applications in several fields and their increased presence in the environment, a thorough evaluation of the NP impact on human and environmental health is required, in order to promote the development of a safe-by-design nanotechnology. The human health hazard of NPs is typically assessed as capacity to activate inflammatory responses, mostly by using standardized in vitro tests that measure the production of inflammatory cytokines by human cells exposed to NPs (Hartung and Wendel Citation1995). In nanotoxicity testing, both in vitro and in vivo, the sterility of NPs is an important requirement, since NPs can be easily contaminated by bacteria or bacterial endotoxins (lipopolysaccharide, LPS). NP sterilization eliminates most biologically active contaminants, which are confounding elements in the evaluation of NP toxicity, but is inefficient in eliminating LPS. LPS is a heat-stable molecule that can be found ubiquitously in trace amounts, and is a potent elicitor of inflammation in human cells. Thus, when measuring NP-induced inflammation, one must be aware that the LPS presence could lead to misinterpretation of the results, by attributing to NPs inflammatory effects that are instead caused by LPS. Therefore, only by evaluating the presence and amount of LPS in NPs, we will be able to reliably define the intrinsic inflammation-inducing capacity of nanomaterials.
In this scenario, it is essential to have valid and dependable methods to detect LPS contamination in NP preparations. In fact, measuring LPS on NPs is not simple, since NPs may interfere in many ways with the currently available LPS detection assays, leading to false results (Li et al. Citation2015).
On the other hand, we can exploit and enhance the capacity of NPs to bind LPS for developing new nanotechnological tools. LPS-binding NPs are being used as sensors for setting up novel LPS detection assays of improved sensitivity, and could be developed for capturing LPS in contaminated solutions. Additionally, LPS-decorated NPs can be used as immunostimulatory devices in medicine, to induce therapeutically beneficial enhancement of defensive immunity/inflammation in diseases such as cancer.
This review describes both the traditional and the more innovative methods for endotoxin detection on NPs, highlighting their advantages and disadvantages and their suitability in testing NPs. We will also examine the use of NPs as LPS sensors/capture tools for developing new LPS detection assays.
LPS structure and signaling
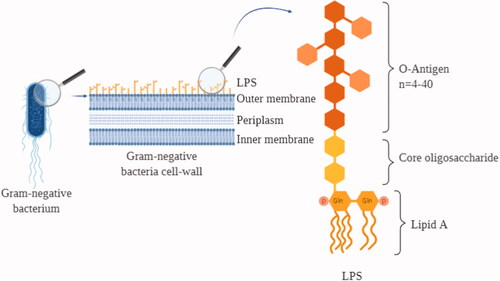
LPS is the major structural component of the Gram-negative bacteria cell wall, accounting approximately for three-quarters of the outer bacterial membrane, and is one of the most potent elicitors of the host immune/inflammatory response aimed at eliminating the bacterial infection (Holst et al. Citation1996).
LPS is an amphiphilic lipoglycan with an overall negative charge. Structurally, it is composed of the lipid A responsible for the LPS inflammatory properties, the extracellular polysaccharide O-antigen, and the interconnecting core oligosaccharide (Rietschel et al. Citation1996) (). The molecular weight of LPS may hugely vary between 10 and 1000 kDa, also considering that LPS in aqueous solution tends to form micelles of variable dimensions depending on the microenvironmental conditions. Therefore, LPS is conventionally measured in endotoxin units (EU), which reflect its biological activity. The degree of activity can vary in LPS from different bacterial origins and depending on a number of other factors. A rough estimate for the LPS of the bacterium Escherichia coli is that 1 EU corresponds to about 100 pg LPS, which is the amount present on 105 bacteria, with each bacterial cell possessing around 2×10⁶ LPS molecules.
Figure 1. LPS on the cell wall of gram-negative bacteria. Graphic representation of a Gram-negative bacterium cellular membrane together with a scheme of the LPS structure. LPS: lipopolysaccharide; Gln: glucosamine; P: phosphate group.
The host immune system recognizes LPS as a signal of ‘danger’ and immediately reacts by starting an inflammatory process. Human beings are particularly sensitive to LPS, and recognition/reaction can occur upon exposure to minute amounts of LPS while, for example, mice are much more resistant. The major mechanism of LPS-induced inflammatory activation is based on the LBP/CD14/TLR4 receptor complex, but LPS can trigger inflammation also through other recognition systems (Yang et al. Citation1998; Ogata et al. Citation2000), including TLR2-mediated recognition that is amplified by CD14 and LPB (Yang et al. Citation1998) and, mainly in neuronal cells, by membrane perturbation-mediated activation of Transient Receptor Potential (TRP) channels that cause an intracellular increase of calcium and sodium levels triggering neurogenic inflammation (Boonen et al. Citation2018).
Once LPS-bearing bacteria are internalized, cytosolic LPS can also activate cells by directly binding caspase-4/11, causing the induction of pyroptosis and indirectly causing the cleavage/activation of the inflammatory cytokine IL-1β by activation of the NLRP3 inflammasome (Casson et al. Citation2013; Vigano et al. Citation2015).
Biological effects of endotoxin
The main LPS-signal transducer, TLR4, is expressed by several cell types, starting from innate immune cells as macrophages and monocytes that are the first line of defense of our body against infections. In all TLR4-bearing cells, TLR4 participates in responses associated to stress, inflammation and disease. Upon LPS-induced cell activation, inflammatory molecules are produced and secreted. At the local level, the release of these factors causes vasodilation and recruitment of circulating leukocytes (Pober and Cotran Citation1990), which participate to the inflammatory defensive reaction by producing other inflammatory mediators and microbicidal agents. A balanced release of inflammation-related mediators leads to a controlled response against invading microorganisms. On the contrary, an uncontrolled and massive inflammatory reaction can cause severe symptoms as in the case of septic shock, in which the host reaction against bacteria or their toxins (including LPS) causes endothelial damage, hypotension, diffuse intravascular coagulation, organ failure and eventual death (Danner et al. Citation1991).
Current methods for LPS detection
Regulatory authorities define the maximum tolerated level of endotoxins in drugs or surgical instruments for human use as 0.5 EU/kg, while, if the product comes in contact with the cerebrospinal fluid, the limit is 0.02 EU/kg (Chapter 85, Unites States Pharmacopoeia Citation2007).
The approved LPS detection assays, which measure the LPS biological activity, are the old rabbit pyrogen test (RPT) and the more recent limulus amoebocyte lysate (LAL) assay. The RPT records the rise in temperature in rabbits after intravenous injection of the test solution, i.e. it measures the pyrogenic effect of the sample (Hort and Penfold Citation1912; Seibert Citation1925). This test is now only applied, when required, to validate the results of the LAL assay. The RPT has limited sensitivity, high cost, long readout time, and implies the use of animals. From a regulatory point of view, the RPT advantage, as opposed to the LAL assay, is that it can detect all types of pyrogens, i.e. substances that cause fever/inflammation, and is not limited to LPS.
The LAL test is based on the use of lysates from amoebocytes (blood cells) of the horseshoe crab Limulus polyphemus. Exposure to LPS induces a defensive reaction in the cells, which includes the LPS-dependent activation of Factor C, an enzyme that initiates a coagulation/clotting cascade aiming to inhibit the infection (Levin and Bang Citation1964a, Citation1964b). Clotting can also be induced by β-(1,3)-d-glucan, a molecule present in fungal pathogens, which activates another clotting enzyme, Factor G, which initiates the same defensive coagulation cascade (Morita et al. Citation1981). The LAL assay exploits the high reactivity of the Factor C present in the lysate of Limulus amoebocytes for an accurate quantitative detection of the LPS biological activity. Several LAL assays have been developed and are available commercially, from the original clotting and turbidimetric assays to the more sensitive assays that use synthetic chromogenic or otherwise tagged substrates. In these assays, LPS-activated Factor C induces the release of a colored/fluorescent/luminescent molecule from the synthetic substrate, which can be precisely measured. The sensitivity of the LAL tests ranges from 0.005 to 50 EU/mL depending on the sample source, bacterial species, strain, and detection method. To avoid the false positives due to the possible presence of β-glucans, many LAL assay kits available on the market include reagents that specifically block the Factor G-dependent reaction.
More recently, the regulatory authorities have included other two LPS detection methods in their list of recommended assays, the recombinant Factor C assay and the monocyte activation test (MAT), with the general recommendation of using more than one method for a reliable evaluation of the endotoxin contamination.
The recombinant Factor C assay is a fluorogenic test that uses the recombinant horseshoe crab enzyme, thereby eliminating the need for animals. The test is specific for LPS, as β-glucans are unable to activate Factor C. The MAT assay is based on the capacity of human monocytes coming in contact with LPS to produce inflammatory cytokines, which can be detected and quantitated by an enzyme-linked immunosorbent assay (ELISA). Similar to the RPT, the advantage of MAT is that monocytes react to all types of pyrogens, not only LPS, providing a functional evaluation (the extent by which contaminants can induce an inflammatory reaction in humans). The drawback is that the assay does not distinguish between the inflammatory effect of contaminants and those intrinsic to the molecules/materials under testing.
Endotoxin contamination of NPs
Endotoxin persists in the environment also in the absence of living Gram-negative bacteria. In the lab, it can be found in all chemicals and glassware, and its high thermostability makes it resistant to the majority of the sterilization methods usually applied (e.g. standard autoclaving). LPS can bind to cationic surfaces, thanks to its negative charge, and to hydrophobic materials through its lipidic domain. While other inflammation-inducing microbial agents can be easily removed with sterilization procedures, the thermostability and the capacity to bind to both hydrophilic and hydrophobic materials, together with its high potency towards human cells, make LPS the most important pyrogen to which attention should be paid during the synthesis and the manipulation of pharmaceutic preparations. LPS can easily bind cationic NPs through electrostatic interactions, such as Coulomb and van der Waals forces (Darkow et al. Citation1999), and to NPs with a lipophilic surface by hydrophobic interaction with lipid A (Bromberg et al. Citation2010). LPS contamination of NPs is further facilitated by the high NP surface:volume ratio that increases their reactivity (Jones and Grainger Citation2009).
LPS was found as a contaminant in different NP preparations, such as Au, polystyrene, silica, TiO2, latex, and AlO3 NPs (Peula-Garcia et al. Citation2002; Kucki, Cavelius, and Kraegeloh Citation2014; Li et al. Citation2015; Bianchi et al. Citation2017; Li et al. Citation2017). As expected, the presence of LPS can strongly affect the biological properties of NPs, as it was shown for AuNPs (Li et al. Citation2017). In that study, endotoxin-contaminated AuNPs induced an inflammatory response in human primary monocytes in vitro, assessed as expression and production of the inflammatory cytokine IL-1β, while endotoxin-free particles were completely inactive (Li et al. Citation2017). Another study reported that LPS-contaminated TiO2NPs could activate inflammatory signaling pathways and increase apoptosis in murine macrophages (Bianchi et al. Citation2017). Thus, if unrecognized, the presence of LPS on NPs may be responsible for significant inflammatory/toxic effects that would be mistakenly attributed to NPs. This is true both in vivo and in vitro, and in particular in assays that use human cells, which are highly sensitive to LPS. For this reason, it is important to exclude LPS contamination during the evaluation of the NP inflammatory/toxic effects.
The procedures for eliminating endotoxin from biomedical materials and devices are defined as ‘depyrogenation’ since the original aim is to eliminate exogenous ‘pyrogens,’ i.e. agents able to cause fever (LPS being the principal one). Several protocols of depyrogenation are available, but these procedures could be destructive for NPs. One of the most used methods is incineration, which consists of treating samples with high temperatures for given times, e.g. dry heat at 180 °C for 3 h or 250 °C for 30 min (Weller et al. Citation2015). It is known that this treatment and others (ethylene oxide treatment, formaldehyde treatment, and autoclaving for 5 h at 121 °C with a pressure of 20 PSI) are not suitable for depyrogenating many NP types, because they can change the NP physicochemical properties leading to aggregation and chemical transformations, changes in morphology and size, and consequently in their optical properties. Such physicochemical changes can affect the NP impact on cells by increasing their cytotoxicity, as observed in many studies (Krug Citation2014). Other methods imply endotoxin removal on immobilized LPS-binding molecules (e.g. polymyxin B, PMB). The method can be used for free endotoxin despite a significant sample loss, but it is hardly applicable to NPs because LPS bound to PMB does not usually detach from NPs, which are therefore retained as well by PMB (unpublished results). Therefore, since LPS elimination requires methods hardly applicable to NPs, the best way to obtain LPS-free NPs is by synthesizing them in endotoxin-free conditions (Vallhov et al. Citation2006).
Assessing endotoxin contamination in NP preparations
The regulatory guidelines about the maximum tolerated LPS levels do not apply to NPs not intended for medical use. Thus, many NPs used in industrial applications and consumer products may be contaminated with biologically active levels of LPS. When NPs are subjected to safety testing, such contamination may significantly bias the results. This calls for an accurate evaluation of the LPS contamination of each NP undergoing safety testing. Notably, the LPS contamination of NPs may need to be lower than the limits imposed for in vivo use in humans, because the testing conditions (e.g. a limited number of human cells in vitro in a small volume) make possible to detect a significant reaction to minute LPS concentrations (few pg/mL).
The currently available assays are not generally applicable for assessing the LPS contamination of NPs, mainly because of the particulate nature of NPs and their physicochemical characteristics. The ISO 29701:2010 regulation provides guidelines to use the LAL tests for monitoring the LPS presence in NP preparations. This document generically mentions that NPs can interfere with the LAL tests. Indeed, NPs can affect the activity of LAL enzymes (e.g. by adsorbing the LAL test components on their surface) resulting in a decrease or increase of the assay sensitivity. Also, depending on the NP characteristics, NPs can interfere with the final readout of the tests (Smulders et al. Citation2012; Li et al. Citation2015; Neun and Dobrovolskaia Citation2019) and generate false positive or false negative results. For NPs, as for every other drug, the use of the LAL assays has limitations in terms of pH (the enzymatic reaction occurs at pH between 6.0 and 8.0) and presence and concentration of divalent cations (which can neutralize the endotoxin negative charge causing aggregation and decreasing activity). The interference is usually identified by assessing the recovery of a known amount of endotoxin spiked into an NP sample. If the spike recovery is less than 50% or more than 200%, the result of the LAL assay is considered not valid because of significant interference (Dobrovolskaia et al. Citation2014). In such cases, NPs can be diluted until interference disappears. If extensive dilution is required for eliminating interference, there is the risk that the NP concentration becomes too low for any kind of realistic LPS testing. Thus, a different assay should be used.
Choosing the right type of LAL test to assess endotoxin contamination in NP samples depends on the NP characteristics. Factors to take into account include NP turbidity and adsorption spectra (especially at wavelengths 405 and 540 nm, which are the most used in commercially available LAL assays). Generally, gel-clot and turbidimetric assays are not suitable for many types of NPs (Dobrovolskaia et al. Citation2010; Smulders et al. Citation2012; Kucki, Cavelius, and Kraegeloh Citation2014), while the use of chromogenic and the fluorescent assays must be assessed case by case.
Lipid-based NPs (e.g. liposomes) can pose problems in different LAL assays. The gel-clot assay is not suitable because the lipids interfere with the clot formation (Piluso and Martinez Citation1999). Moreover, most liposome preparations are milky, and interfere with turbidity assays. In most cases, the chromogenic LAL assays (with a final readout at 405 nm) work satisfactorily for detecting endotoxin in liposomes after appropriate dilution.
Both classic and modified chromogenic LAL assays can be adapted to endotoxin detection in metal-oxide NPs (SiO2, TiO2, Fe3O4) (Smulders et al. Citation2012; Mano, Kanehira, and Taniguchi Citation2013; Li et al. Citation2015). Likewise, the two commercial chromogenic tests turned out to be the most suitable for endotoxin detection in metal NPs (Au and Ag), provided an appropriate NP dilution is used. For instance, Li et al. (Citation2015) demonstrated that, with classical chromogenic assays, 14 nm AgNPs can be tested at concentrations below 5.4 μg/mL without significant interference, whereas 10 nm AuNPs could be tested up to 64 μg/mL. On the other hand, the substantial quenching of fluorescence by metal NPs prevents the use of all the fluorescence-based assays (including the one with recombinant Factor C).
In the LAL assays, two controls must be performed. An ‘NPs-only’ control will exclude false positives due to intrinsic NP absorbance, luminescence, or fluorescence. Moreover, ‘NPs-plus-readout molecule’ and ‘NPs-plus-assay-reagents-plus-LPS’ controls will identify potential interference with endotoxin determination at any level within the assay (assay reagents, assay readouts, etc.) (Li et al. Citation2015).
It has been shown that the same NP preparation tested simultaneously with different LAL assays can yield different results (Dobrovolskaia et al. Citation2010; Li et al. Citation2015). Thus, the use of at least two LAL formats is recommended in testing NP preparations and, when the results differ by more than 25%, these should be confirmed with functional tests (Dobrovolskaia et al. Citation2010). Carbon-based NPs can interfere with both gel-clot, turbidimetric and chromogenic assays by direct activation of the clotting enzyme present in LAL. As in the case of other NPs, it is possible to avoid interference upon appropriate NP dilution. In a recent study, it was possible to measure LPS contamination in preparations of carbon nanotubes at concentrations below 10 ng/mL and 300 ng/mL in the gel-clotting and the chromogenic assays, respectively (Yang et al. Citation2017).
The functional tests include the in vivo induction of fever in the rabbit (RPT) and the in vitro induction of inflammatory reaction in human leukocytes (MAT and similar assays). The major characteristic of functional assays is the lack of specificity for LPS, as all pyrogenic and inflammation-inducing agents are active in such assays. The RPT can be successfully applied to detect endotoxins in NPs but, as already mentioned, it has low sensitivity and a number of other drawbacks, including the fact that the rabbit response to pyrogens is not identical to the human reaction (Hartung and Wendel Citation1995). The in vitro assays based on human cells have successfully replaced the RPT in pyrogen detection. These tests are not affected by components that interfere with LAL, and more closely reflect the human immune response to the tested sample. The assays consist of incubating the NP sample with human blood cells (whole blood, blood mononuclear cells or isolated monocytes), a human macrophage-like cell line, or reporter cells engineered to express human TLR4 (the receptor for LPS) and carrying a reporter gene whose activation can be quantitatively measured (Smulders et al. Citation2012). After incubation for 6 to 24 h, the concentration of inflammatory cytokines released is measured using cytokine-specific ELISA assays or, in the case of reporter cells, by measuring the fluorescence generated by the products of the activated reporter gene. In the case of NPs, before the ELISA it is recommended to centrifuge the supernatant to remove the NPs that could interfere with the test (Oostingh et al. Citation2011). Before running cell-based tests, it is advisable to test the compatibility of NPs with cell culture medium, since some kinds of NPs can corrode releasing toxic cations, or can aggregate and change their size and morphology (Oostingh et al. Citation2011). Disadvantages of these functional tests include, in addition to their lack of specificity for LPS, their variability in quantitative terms (e.g. donor-to-donor variations in reactivity), and the fact that they cannot be used with NPs carrying cytotoxic drugs (Dobrovolskaia et al. Citation2014). For these reasons, cell-based assays should be intended as complementary to the LAL assays, or when LAL assays are not applicable. For example, instead of the unsuitable LAL assay, Mukherjee et al. (Citation2016) used a MAT-like functional assay based on the production of TNF-α by human primary macrophages to detect the presence of LPS in their carbon-based NP preparations, exploiting the high sensitivity of macrophages to LPS and their ability to produce inflammatory cytokines in response to it. Importantly, to overcome at least in part the lack of specificity of the MAT assay, the authors performed the assay in parallel in the presence of PMB, which binds and inhibits LPS with high selectivity. PMB is an amphipathic polypeptide that binds LPS leading to the death of Gram-negative bacteria by destabilizing their outer membrane. The use of PMB in cell cultures should however be considered carefully, because of its non-specific activation and toxicity effects.
The methods described above are summarized in , and compared for their ability to detect LPS on NPs.
Table 1. LPS detection methods useful for NP testing.
As mentioned above, the best way to avoid LPS contamination is working in endotoxin-free conditions, and this is more important when NPs are intended for drug delivery. In this case, the endotoxin-free conditions are essential not only during NP synthesis but also during the NP loading with drugs. In the latter case, a potential LPS contamination could be masked by the NP shell, which will make it undetectable by any LPS detection assay. This could generate the possibility that, upon NP uptake by cells and cargo release in the cytoplasm, LPS could also be released and activate intracellular inflammatory pathways.
Function-independent methods for detecting LPS contamination on NPs
The limitations of the traditional LPS detection assays, based on the assessment of its biological activity, encouraged the development of alternative LPS detection assays suitable for NPs. An interesting method was recently proposed, based on the Ultra High Performance Liquid Chromatography coupled with mass spectrometry to detect the LPS presence on NPs (Giannakou et al. Citation2019). This method is compatible with some NPs (e.g. TiO2 and CeO2 NPs) and has a sensitivity between 0.03 and 0.7 EU/mL. Its applicability to different NP types needs case-to-case validation.
Methods that are traditionally used to characterize NPs have been also applied to detect LPS on NPs and may form the basis for the development of new methods for the quantitative assessment of LPS contamination.
Dynamic light scattering
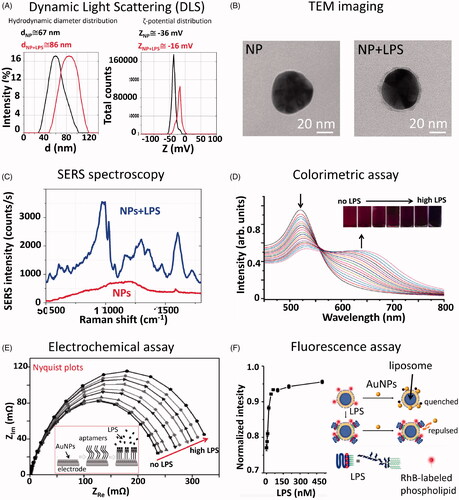
Dynamic Light Scattering (DLS) is widely used to analyze the size and superficial charges (ζ-potential) of NPs (including nanogold, proteins, colloids, etc.). Particle size distribution can be determined by measuring the random changes in the scattered light due to Brownian motion – the random thermal motion – of small particle in solution. By further analyzing the NP mobility across the electric field generated by two electrodes (electrophoretic light scattering), it is possible to estimate the NP superficial charge and, therefore, the NP stability (Bhattacharjee Citation2016). DLS allows for measuring NP size between 0.3 nm to 6 µm with a minimum volume 10-100 µL of sample suspension, with an accuracy of about ±2% and a precision of about ±1%.
Li et al. (Citation2017) used DLS for detecting the presence of LPS on AuNPs (size range 40–50 nm). The shows typical hydrodynamic diameter and ζ-potential distribution curves, obtained with a DLS instrument, for 50 nm AuNPs before and after incubation with LPS. The experiment was performed on 1 mL of the NP solution (3.5 × 10⁵ NPs/mL) incubated with 5 µg of LPS. By comparing the size of both bare and LPS-coated NPs, it was possible to observe an increased size for the LPS-coated NPs of about 20 ± 5%, together with a decrease of the NP ζ-potential, due to the presence of an LPS layer on the NP surface. The main advantage of the DLS analysis is the ability to detect hundreds of NPs in a short time, returning statistically significant results. The drawback is that the NP hydrodynamic diameter measured by DLS is not the same as the NP diameter. The conversion from hydrodynamic diameter to NP diameter is not direct and depends on several factors (including issues of random coil vs. hard sphere) that could lead to possible errors in LPS quantification. Additionally, DLS can measure different hydrodynamic diameters if the sample is polydisperse, implying that a good estimation of the LPS corona around NPs can be obtained only if the LPS corona is homogeneous around all NPs in the sample. Although any kind of NPs can be used, this type of assay can be performed only on solutions with a volume >10 µL, and with monodispersed NPs with a regular shape. As many other methods that measure the presence of organic matter at the NP surface, DLS is not specific for LPS. The main characteristics of the DLS are summarized in .
Figure 2. Summary of non-conventional techniques for detection and quantitative analysis of LPS on NPs. (A) Dynamic light scattering data showing hydrodynamic diameter (d) and ζ-potential (Z) distributions of 50 nm AuNPs before and after incubation with LPS. The mean values acquired before and after the LPS incubation are reported on the graph. The presence of LPS can be detected by measuring a shift into the NP size and ζ-potential distributions. (B) TEM images showing 50 nm AuNPs before and after incubation with LPS. From the TEM image acquired after the LPS incubation, it is possible to observe the LPS corona of about 4–5 nm (grey halo) around the NPs (black sphere). (C) SERS spectrum of 50 nm AuNPs, either bare or incubated with LPS, acquired with a Raman microscope equipped with a 785 nm wavelength laser (Manago et al. Citation2018). The spectral bands allow the biochemical identification of the LPS components, while the signal intensity can be used for LPS quantitation. (D) UV-Vis spectrum showing a decrease of the SPR peak at 525 nm and an increase of the peak at 650 nm related to the agglomeration state of CSH-AuNPs upon addition of increasing LPS concentrations. Inner: Visual colorimetric change of the CSH–AuNPs upon addition of LPS (Sun et al. Citation2012). The measurement of (A650/A525)1/2 values in the presence of different LPS concentrations allows quantitative analysis. Reprinted with permission. (E) Electrochemical impedance assay showing the changes of the electrode/electrolyte interface (AuNPs) by applying an oscillating potential as a function of frequency (Nyquist plot). When the concentration of endotoxin is high, the semi-circles of Nyquist plots increase, due to the rearrangement of LPS molecules on AuNPs and the inherent variation of their electric properties. Inner: schematic representation of the assembly of the LPS-detecting aptasensor (Su et al. Citation2013). Reprinted with permission. (F) Fluorescence intensity increase as a function of the LPS concentrations for the fluorescence-based sensor proposed by Gao et al. (Citation2017). Reprinted with permission.
Transmission electron microscopy
Transmission Electron Microscopy (TEM) is usually employed for the morphological characterization of NPs. Based on the interaction of a high energy electron beam with the atoms of the target sample, TEM allows to image NPs with a diameter even lower than 1 nm (Winey et al. Citation2014). The LPS presence on 50 nm AuNPs surface incubated with 5 µg of LPS can be imaged as a light gray layer (about 5 nm-thickness) around the black NP surface, as shown in . Therefore, the imaging approach can be used to visualize and detect the formation of the LPS corona with a high spatial resolution, to visualize the uniformity of the LPS distribution at different concentrations and to measure the particle sizes using a really small sample volume (>2 µL). Despite its powerful imaging capabilities, this method is excessively time-consuming, requiring long sample preparation and complex image analysis, and it does not provide quantitative and specific information. The NP images should be analysed one by one, resulting in size measuring of poor accuracy. In addition, the selection of the image focus and, therefore, the NP dimension strongly depends on the operator. The main characteristics of the TEM analysis are summarized in .
Surface-enhanced Raman spectroscopy
Surface-enhanced Raman spectroscopy (SERS) can be exploited for detection and quantitation of LPS adsorbed on the surface of metallic NPs. SERS is a surface-sensitive technique where Raman scattering signal by molecules adsorbed on metal surfaces (such as metallic NPs), is enhanced up to several orders of magnitude thanks to the excitation of localized surface plasmons (Campion and Kambhampati Citation1998; De Luca et al. Citation2014; Manago et al. Citation2018; Quero et al. Citation2018). Raman bands are 10–100x narrower than fluorescence bands, and therefore SERS offers a major advantage over fluorescence for multiplex detection and optical stability. Due to its sensitivity and advantages over other detection techniques, SERS has received much attention as an ultrasensitive analytical technique, particularly for biomedical and environmental applications (Manago et al. Citation2018). A number of reports have used SERS for the direct detection and analysis of unlabeled biological molecules and microorganisms, including the composition of bacteria cell membranes (Zhou et al. Citation2015).
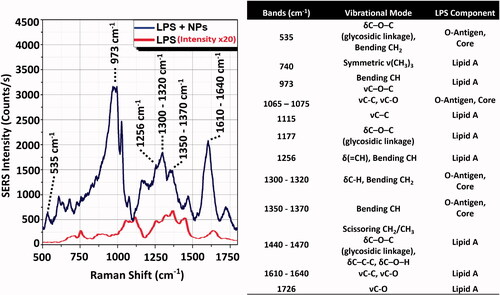
We recently measured the SERS signal of LPS from E. coli O55:B5 adsorbed on 50 nm AuNPs in the same experimental conditions reported previously (Li et al. Citation2017). Compared with the Raman spectrum of the LPS powder, the AuNP-LPS SERS spectrum showed a remarkable increase of the signal intensity, corresponding to about 6–7 orders of magnitude () (Manago et al. Citation2018; Quero et al. Citation2018). Therefore, due to its sensitivity, the SERS approach could allow for detecting and quantitating the LPS on AuNPs with a minimum volume <1 µL of sample suspension, even when LPS is present at low doses (few fg/mL), with a good reproducibility (variation about 5–8% for the reported concentrations).
Furthermore, the spectral analysis allows for the identification of the LPS chemical components. Indeed, the strong Raman bands at 973, 1256 and 1610–1640 cm−1 can be associated to the lipid A, while 535 cm−1 band and bands between 1300 and 1400 cm−1 can be assigned to LPS core or O-antigen (). A complete peak assignment, together with a comparison between the SERS and Raman spectra of LPS, is reported in (Barrett Citation1981; Osorio-Roman et al. Citation2010; Czamara et al. Citation2015). The technique does not require long sample preparation or functionalization procedures, and it can be used for the label-free direct biochemical identification the LPS domains, as well as for the presence of different types of endotoxins (high specificity) even in turbid media (De Luca et al. Citation2014). On the other hand, SERS enhancement depends on the NP nature (only metallic NPs can be used), geometrical parameters (size, shape and concentration of the NPs) and plasmonic mode field distribution (Manago et al. Citation2018; Quero et al. Citation2018). Therefore, after the calibration of the SERS signal of the metallic NPs, the assay can provide quantitative information on the LPS detection. The main characteristics of the SERS technique are summarized in .
Figure 3. Intensity comparison between LPS Raman spectrum and LPS-NPs SERS spectrum. (A) SERS signal (NPs + LPS, upper line) measured using sample concentration conditions of 5 µg LPS on 2 µg (1.4 × 10⁹ particles) of 50 nm AuNPs. Conditions of acquisition: λex = 785 nm; integration time = 1 s; laser power = 0.1 mW (Manago et al. Citation2018; Quero et al. Citation2018). Reference Raman spectrum of the LPS powder (LPS only, lower line). Condition of acquisition: λex = 785 nm; integration time = 60 s; laser power = 10 mW. The spectra are an average over 30 acquisitions. (B) Assignment of the observed SERS and Raman bands based on the literature (Barrett Citation1981; Osorio-Roman et al. Citation2010; Czamara et al. Citation2015). LPS component band assignment related to Lipid A and O-antigen/Core are indicated on spectra peaks. δ: deformation vibrations; ν: stretching vibrations.
NPs for detection and quantitation of LPS
Not only in the case of endotoxin detection on NPs but more in general, the LAL assays have a number of limitations. Being based in the detection of a specific biological activity (activation of Factor C), every condition that interferes with such activity will impact on the assay reliability. One of these limitations is the so called ‘low endotoxin recovery,’ i.e. the lack of Factor C activation due to the formation of macromolecular complexes that mask the endotoxin Factor C-activating moieties (Chen and Vinther Citation2013; Schwarz et al. Citation2017). It has been demonstrated that the ‘masked endotoxin’ can still activate an inflammatory response in human primary monocytes inducing the expression of inflammatory cytokines, indicating that the biological activity of endotoxin in different biological assay can be very various (Schwarz et al. Citation2017). Thus, a significant effort is being devoted to developing new more reliable methods for endotoxin determination that could replace LAL and other biological assays, and provide a more specific and precise detection. Some methods based on antibodies, aptamers, or recognition ligands have been proposed, but they still do not provide sufficient sensitivity and specificity (Su and Ding Citation2015).
Due to their small size, large surface area, and optical and electrochemical properties, NPs have been also used in the development of new methods for LPS detection. Here, new promising NP-based assays are discussed. The main characteristics of all the new LPS detection assays described hereafter are summarized in .
Table 2. NP-based LPS detection assays
NP colorimetric assays (optical assays)
AuNPs are largely used in colorimetric assays thanks to their optical properties and ability to change their color when conjugation or agglomeration occurs. Indeed, UV-Vis spectroscopic observation of the AuNP absorbance peak, called Surface Plasmon Resonance (SPR) peak, in the visible range of light, provides information about the size and the aggregation state of the NPs (Sun et al. Citation2012). If NPs are agglomerated, they will show a shift of their characteristic SPR, which depends on NP size, shape, and surface functionalization (Begum et al. Citation2018). Therefore, colorimetric assays based on the use of AuNPs can be employed for LPS detection. A key parameter to consider in this kind of assay is the capacity of AuNPs to bind LPS. Several NP functionalization protocols have been developed for improving the assay sensitivity, using molecules that specifically recognize LPS such as monoclonal antibodies, aptamers, macromolecules or peptides (Yu et al. Citation2011; Lei et al. Citation2016; Zhu et al. Citation2019). Three examples of AuNP-based colorimetric assays are described below.
In the pioneering case reported by Sun et al. (Citation2012), 35 nm AuNPs were functionalized with cysteamine (CSH), providing a positive surface charge able to interact with the negative charge of LPS. Upon the addition of increasing concentrations of the endotoxin, CSH-AuNPs agglomerated and the solution changed their color from wine-red to purple and finally blue (). UV-Vis spectra of CSH-AuNPs alone showed an SPR peak at 525 nm but, when increasing doses of LPS were added into the solution, CSH-AuNPs started to agglomerate causing the decrease of the 525 nm peak and the increase of a new peak at 650 nm (). The limit of detection (LOD) is reported to be 3.3 ng/mL and is evaluated by a linear relationship obtained between peak amplitude ratio (A650/A525)1/2 and LPS concentration.
Another rapid assay based on UV-Vis measurements used AuNPs functionalized with LPS-binding aptamers (Kalita et al. Citation2015). AuNPs were modified with ethanolamine aptamer (G-probe) or E. coli O111:B4 LPS aptamer (S-probe). With S-probe AuNPs in the absence of LPS or with G-probe AuNPs, particles were stabilized by the aptamers, and the solution appeared red. In the presence of LPS, the interaction of LPS with the S-probe aptamer (not with G-probe) caused the aggregation of AuNPs, inducing a red-to-colorless color change in solution. In this way the assay showed a double function, it allowed identifying and quantifing the LPS in one biosensing system with a LOD of 1 µg/mL. Indeed, S-probe aptamers only recognized E. coli O111:B4 and not other LPS types.
Kalita et al. (Citation2015) proposed a colorimetric assay employing AuNPs functionalized with PMB combined with the use CMOS sensor to detect the AuNP optical properties with high sensitivity. Serum and water samples spiked with LPS from E. coli O55:B5 were first drop-casted onto a silanized glass substrate and then tagged with PMB-AuNPs. The binding was visualized using a silver halide reduction process that leads to an increase of the particle size and the deposition of a silver layer where LPS is present. Signal intensities (measured with a CMOS sensor on images captured with an optical microscope) increased monotonically with rising LPS concentrations, showing a LOD of 5 and 50 fg/mL for water and serum, respectively. This device showed an excellent recognition of O55:B5 LPS, and it can be used to detect other LPS serogroups thanks to the high binding affinity of PMB to any kind of LPS.
These three examples demonstrate that colorimetric assays are reliable methods to detect LPS based on its interaction with AuNPs and their optical properties, with several advantages. These tests are cost-effective, quick and direct, as they allow for a visual detection of the LPS presence. However, they require special instrumentation able to translate a band intensity and spectral position to a given LPS concentration. Furthermore, the sensitivity is variable, depending on the LPS affinity for the ligand on NPs, and the system does not allow for detecting and quantitating LPS concentrations that cause little NP aggregation. The main disadvantages are related to limited detection sensitivity of transmitted light (i.e. low concentrations of dispersed AuNPs cannot be detected and do not significantly affect optical density) by instruments such as plate readers, optical microscopes and UV-Vis spectrometers ().
Consequently, despite the use of efficient ligands such as aptamers, the colorimetric methods show poor sensitivity, with a LOD of 1 µg/mL (Zhu et al. Citation2019). This sensitivity slightly improved in the case of the cysteamine, but the method described cannot detect LPS concentrations lower that 3.3 ng/mL, roughly corresponding to 33 EU/mL, i.e. still a very high biological activity. The highest sensitivity achieved with image analysis (5–50 fg/mL, corresponding to 0.05–0.5 mEU/mL) is excellent for detecting bioactive LPS levels, but it implies a complex elaboration of images that makes it difficult to apply in quantitative experiments.
NP electrochemical assays
Electrochemical sensors measure the conductivity changes of an electrode due to the selective absorption of the analyte on the conductive surfaces. Since the electrical signal is concentration-dependent, it is used to determine the concentration of the analyte. In Electrochemical Impedance Spectroscopy (EIS), a sinusoidal voltage is applied by a potentiostat across an electrode cell, and the analyte molecules are placed on the electrode surface (Randviir and Banks Citation2013). The current flows through the electrochemical device and gains information about its impedance properties, being conductivity of the system affected by the presence of analyte molecules. The current is then recorded by the potentiostat, and converted by a software into an impedance value with a real and imaginary component (impedance spectra). Real and imaginary impedance components are generally plotted against one another in Nyquist plots (), which have to be interpreted properly to deduce analyte molecule resistances and, then, concentrations (Randviir and Banks Citation2013). This type of electrochemical sensors has been used to measure the LPS concentration with the aid of NPs. Three examples of LPS electrochemical sensors with different immobilization procedures are described below.
An electrochemical biosensor for LPS, based on the use of CramoLL and cysteine-coated AuNPs (AuNPCys) was reported (Oliveira et al. Citation2011). CramoLL is a lectin isolated from Cratylia mollis seeds that can bind to the carbohydrate moieties of LPS. The sensor is formed by a gold electrode coated with the poly(vinylchloride-co-vinyl acetate-co-maleic acid) (PVM) on which AuNPCys are absorbed and CramoLL added to them. The biosensor was tested with LPS from E. coli, Serratia marcescens, Salmonella enterica, and Klebsiella pneumoniae, by measuring the charge transfer resistance changes upon LPS binding. Depending on the LPS composition, the biosensor showed different charge transfer responses. The biosensor showed a good response for 200 µg/mL of LPS of each tested species, meaning that its sensitivity for LPS recognition is unsatisfactory. In addition, the PVM–AuNpCys CramoLL system cannot discriminate between LPS and other molecules with glycosyl residues.
Aptamer-assisted electrochemical biosensors for LPS detection, which exploit aptamers able to bind LPS, showed improved sensitivity and selectivity (Su et al. Citation2013). Su et al. proposed the use of AuNPs to immobilize a thiol-modified aptamer that recognizes LPS. A scheme of the sensor is reported in . The biosensor sensitivity was evaluated by measuring the Nyquist plot at different endotoxin concentrations. The semi-circle of the Nyquist plot increases linearly with the LPS concentration due to the attraction between the aptamers and their targets (). The presence of AuNPs dramatically increased the conducting capacity of the electrode, ensuring an excellent linear response in a concentration range from 0.1 pg to 1 ng/mL of LPS, with a LOD of about 0.05–0.1 pg/mL.
Recently, the performance of the aptamer assisted electrochemical biosensors has been further improved (Posha and Sandhyarani Citation2020). A novel nano-probe for LPS detection was designed, based on an AuNP-loaded, water-soluble layered molybdenum disulfide-polyacrylic acid (Au/MoS2-PAA) nanocomposite. Basically, AuNPs loaded over MoS2-PPA substrate enable the immobilization of the thiol-terminated LPS binding aptamers (LBA) on MoS2 nanosheets, with strong affinity (nanomolar range). The presence of the substrate and NPs, amplify the current response of the electrode, allowing the detection of the LPS with an excellent linear response in a concentration range from 100 ag/mL to 100 pg/mL of LPS. Compared with the existing approaches, this approch showed a broad detection range, a low limit of detection (LOD of 29 ag/mL), and high reproducibility. This sensor was also tested to determine the LPS concentration in clinical-grade insulin, showing results within an error of 2%.
Despite excellent sensitivity, the use of EIS needs advanced expertise, and therefore it is not accessible by all users (). Real and imaginary impedance plots need to be interpreted properly to deduce solution resistances, charge transfer resistance, and other parameters. Moreover, these sensors can be difficult to fabricate, and can be made only with NPs that are able to conduct properly the current (i.e. metallic NPs) and that allow measuring impedance changes of the electrochemical sensor. As for the colorimetric assays, the LPS detection is indirect and the immobilization of the LPS on NPs has direct implications for the development and properties of the proposed biosensors. Finally, electrode stability, charge and purity of the analyte solution, may affect the reproducibility and selectivity of the biosensor.
NP fluorescence assays
NPs can also be used to set up new LPS detection strategies based on fluorescence. In these type of biosensors different NP types (magnetic, metallic) can be employed, the selectivity strongly depending on the LPS immobilization strategy, and a fluorophore is used to identify and quantify the presence of LPS. Two examples are reported below.
An interesting method is based on the use of magnetic NPs coated with an LPS-capture aptamer and an LPS-detection aptamer functionalized with a fluorophore (Zuo et al. Citation2014). Flow cytometry was used to measure and quantify the green fluorescence emission (at 520 nm) of the endotoxin-conjugated sandwich complex when detecting endotoxin with magnetic aptasensor in the range from 10 fg to 1 mg/mL. This assay requires a small amount of LPS solution (only 2 μl), shows a good reproducibility (5.5% variations after several regenerations), and fast response (detection can be performed in less than a minute).
Another LPS fluorescence sensor was developed based on the use of liposomes and AuNPs (Gao et al. Citation2017) (). The authors synthesized liposomes functionalized with Rhodamine B and exploited the ability of both LPS and AuNPs to bind liposomes. Their strategy consists in incubating the analyzed sample first with liposomes and then with AuNPs. If LPS is present in the analyzed sample it will insert into the liposome phospholipid bilayer, due to its amphiphilic nature, compete and limit the binding of AuNPs to liposomes (). AuNPs will not be able to completely cover liposomes because their phospholipid bilayer strengthened by LPS can limit diffusion and penetration of hydrophobic substances. This will avoid the fluorescence quenching of the fluorophore-labelled liposomes caused by the binding of AuNPs. Conversely, if the LPS is not present AuNPs will be free to bind to fluorescent liposomes, and the fluorescence will be effectively quenched. The sensor was successfully used to detect LPS dissolved in cell culture medium and showed a LOD of 6.5 ng/mL.
NP-based sensors that exploit fluorescence, although providing fast response, are indirect methods because of the difficulties in directly tagging LPS with a fluorophore. The selection of the fluorophore or fluorescent dye is a key element of the assay, and particular attention should be paid to selecting NPs that do not interfere with the fluorescent dyes during measurements (). The fluorescence assays require a series of functionalization and sample preparation steps, as well as an accurate choice of NPs, which must be individually tested for validating the sensor performance. On the other hand, it requires a small amount of solution, the reproducibility is high, the analysis is compatible with the use of solvents (PBS, DMEM etc.) generally used in cell culture experiments, and could be easily adapted to 96-well plates for high-throughput and automated analysis.
Conclusions and future perspective
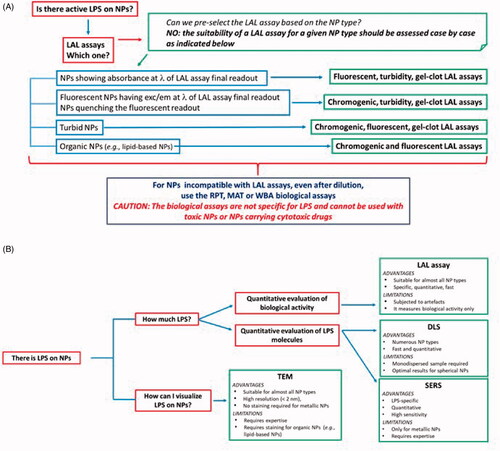
The early identification of bioactive LPS in NP preparations would avoid misinterpretation of toxicity data and inappropriate attribution to NPs of LPS-dependent inflammatory/toxic effects, thereby promoting a knowledge-based development of safe-by-design nanotechnology. Since NPs can interfere with the current LPS detection methods and each NP type/size/shape can have different effects, special attention should be paid to selecting the appropriate assay and running the appropriate controls, in order to obtain reliable results. In addition to adapting the currently available LPS detection assays, a number of new methods that can be used in support. We propose here a ‘decision tree’ () that can help researchers in selecting the most suitable detection assays for their NP preparations.
Figure 4. Decision tree. (A) In order to detect LPS contamination in NP samples, the first choice is generally the LAL assay. The LAL assay format is chosen depending on NP characteristics and behaviour in the assay conditions. Here we reported a synthetic guide on how to choose the most suitable LAL assay. Note that in general the suitability of a specific LAL assay for NP samples should be verified empirically case by case. If NPs interfere with LAL assay components or final readout, diluting NPs until the interference disappear can be an efficient solution. When NPs are not suitable for any LAL assay format, other functional assays (RPT, MAT or WBA) are used, which however are not specific for LPS and cannot be used with cytotoxic NPs. (B) If NPs are contaminated by LPS, the contamination can be quantified by LAL (if you are interested to determine the LPS biological activity) or by DLS or SERS, to determine the number of LPS molecules, the choice of technique depending on the NP physico-chemical characteristcs. The presence of the LPS on NPs can be visualized by TEM. Note that in this figure the NP-based LPS detection assays have not been included since they are intended for different types of samples and cannot be applied to NP-containing samples. Information on such assays is reported in the paragraph ‘NPs for Detection and Quantitation of LPS’ and in the . LAL: Limulus amoebocyte lysate; exc/em: excitation/emission; RPT: rabbit pyrogen test; MAT: monocyte activation test; WBA: whole blood assay; TEM: transmission electron microscopy: DLS: dynamic light scattering; SERS: surface-enhanced Raman spectroscopy.
Future perspectives go in two directions. One, partly addressed above, consists in the exploitation of the NP characteristics for developing more precise and robust LPS detection assays, which are a general need. The current attempts still have limitations either in sensitivity or affordability, feasibility, reproducibility, specificity. It is also notable that these assays do not measure the LPS biological activity on human cells, which not necessarily correlates with LPS amount. On the other hand, these systems of NP-based LPS recognition and binding can be the basis for other promising applications both in the area of decontamination (from solutions and samples of clinical/experimental use to environmental applications). Lastly, new nanomedical applications can be envisaged for LPS-carrying NPs to achieve a controlled localized inflammatory/immune response with high efficacy and limited side effects. This would be particularly useful in the implementation of novel immunotherapeutic approaches to cancer, but it could also be of great value in obtaining limited activation of innate/inflammatory reactions in immunostimulatory and vaccination strategies.
Acknowledgements
The authors aknowledge DiSTABiF and Università della Campania Luigi Vanvitelli that coordinates the PhD program of AV.
Disclosure statement
The authors declare no conflict of interest.
Correction Statement
This article has been corrected with minor changes. These changes do not impact the academic content of the article.
Additional information
Funding
References
- Barrett, T. W. 1981. “Laser Raman Spectra of Mono-, Oligo- and Polysaccharides in Solution.” Spectrochimica Acta Part A: Molecular Spectroscopy 37: 7.
- Begum, R., Z. H. Farooqi, K. Naseem, F. Ali, M. Batool, J. Xiao, and A. Irfan. 2018. “Applications of UV/Vis Spectroscopy in Characterization and Catalytic Activity of Noble Metal Nanoparticles Fabricated in Responsive Polymer Microgels: A Review.” Critical Reviews in Analytical Chemistry 48 (6): 503–516. doi:10.1080/10408347.2018.1451299.
- Bhattacharjee, S. 2016. “DLS and Zeta Potential – What They Are and What They Are Not?” Journal of Controlled Release 235: 337–351. doi:10.1016/j.jconrel.2016.06.017.
- Bianchi, M. G., M. Allegri, M. Chiu, A. L. Costa, M. Blosi, S. Ortelli, O. Bussolati, and E. Bergamaschi. 2017. “Lipopolysaccharide Adsorbed to the Bio-Corona of TiO2 Nanoparticles Powerfully Activates Selected Pro-Inflammatory Transduction Pathways.” Frontiers in Immunology 8: 866 doi:10.3389/fimmu.2017.00866.
- Bobo, D., K. J. Robinson, J. Islam, K. J. Thurecht, and S. R. Corrie. 2016. “Nanoparticle-Based Medicines: A Review of FDA-Approved Materials and Clinical Trials to Date.” Pharmaceutical Research 33 (10): 2373–2387. doi:10.1007/s11095-016-1958-5.
- Boonen, B.,. Y. A. Alpizar, V. M. Meseguer, and K. Talavera. 2018. “TRP Channels as Sensors of Bacterial Endotoxins.” Toxins 10 (8): 326. doi:10.3390/toxins10080326.
- Bromberg, Lev, Emily P. Chang, Carmen Alvarez-Lorenzo, Beatriz Magarinos, Angel Concheiro, and T. Alan Hatton. 2010. “Binding of Functionalized Paramagnetic Nanoparticles to Bacterial Lipopolysaccharides and DNA.” Langmuir 26 (11): 8829–8835. doi:10.1021/la904589p.
- Campion, A., and P. Kambhampati. 1998. “Surface-Enhanced Raman Scattering.” Chemical Society Reviews 27 (4): 241–250. doi:10.1039/a827241z.
- Casson, C. N., A. M. Copenhaver, E. E. Zwack, H. T. Nguyen, T. Strowig, B. Javdan, W. P. Bradley, et al. 2013. “Caspase-11 Activation in Response to Bacterial Secretion Systems That Access the Host Cytosol.” PLOS Pathogens 9 (6): e1003400 doi:10.1371/journal.ppat.1003400.
- Chen J, A. V. 2013. “Low Endotoxin Recovery in Common Biologics Products.” Paper presented at Proceedings of the PDA Annual Meeting, Orlando, FL, USA, 3.
- Czamara, K., K. Majzner, M. Z. Pacia, K. Kochan, A. Kaczor, and M. Baranska. 2015. “Raman Spectroscopy of Lipids: A Review.” Journal of Raman Spectroscopy 46 (1): 4–20. doi:10.1002/jrs.4607.
- Danner, R. L., R. J. Elin, J. M. Hosseini, R. A. Wesley, J. M. Reilly, and J. E. Parillo. 1991. “Endotoxemia in Human Septic Shock.” Chest 99 (1): 169–175. doi:10.1378/chest.99.1.169.
- Darkow, R., T. Groth, W. Albrecht, K. Lutzow, and D. Paul. 1999. “Functionalized Nanoparticles for Endotoxin Binding in Aqueous Solutions.” Biomaterials 20 (14): 1277–1283. doi:10.1016/S0142-9612(99)00022-8.
- De Luca, A. C., P. Reader-Harris, M. Mazilu, S. Mariggio, D. Corda, and A. Di Falco. 2014. “Reproducible Surface-Enhanced Raman Quantification of Biomarkers in Multicomponent Mixtures.” ACS Nano 8 (3): 2575–2583. doi:10.1021/nn406200y.
- Dobrovolskaia, M. A., B. W. Neun, J. D. Clogston, H. Ding, J. Ljubimova, and S. E. Mcneil. 2010. “Ambiguities in Applying Traditional Limulus Amebocyte Lysate Tests to Quantify Endotoxin in Nanoparticle Formulations.” Nanomedicine 5 (4): 555–562. doi:10.2217/nnm.10.29.
- Dobrovolskaia, M. A., B. W. Neun, J. D. Clogston, J. H. Grossman, and S. E. Mcneil. 2014. “Choice of Method for Endotoxin Detection Depends on Nanoformulation.” Nanomedicine 9 (12): 1847–1856. doi:10.2217/nnm.13.157.
- Gao, J., Z. Li, O. Zhang, C. Wu, and Y. Zhao. 2017. “Tunable Accessibility of Dye-Doped Liposomes Towards Gold Nanoparticles for Fluorescence Sensing of Lipopolysaccharide.” The Analyst 142 (7): 1084–1090. doi:10.1039/c7an00019g.
- Giannakou, C., K. Aimonen, L. V. Bloois, J. Catalan, R. E. Geertsma, E. R. Gremmer, W. H. De Jong, et al. 2019. “Sensitive Method for Endotoxin Determination in Nanomedicinal Product Samples.” Nanomedicine 14 (10): 1231–1246., doi:10.2217/nnm-2018-0339.
- Hartung, T., and A. Wendel. 1995. “Detection of Pyrogens Using Human Whole Blood.” ALTEX 12 (2): 70–75.
- Holst, O., A. J. Ulmer, H. Brade, H. D. Flad, and E. T. Rietschel. 1996. “Biochemistry and Cell Biology of Bacterial Endotoxins.” FEMS Immunology and Medical Microbiology 16 (2): 83–104. doi:10.1111/j.1574-695X.1996.tb00126.x.
- Hort, E. C., and W. J. Penfold. 1912. “Microorganisms and Their Relation to Fever: Preliminary Communication.” The Journal of Hygiene 12 (3): 361–390. doi:10.1017/s0022172400005052.
- Jones, C. F., and D. W. Grainger. 2009. “In Vitro Assessments of Nanomaterial Toxicity.” Advanced Drug Delivery Reviews 61 (6): 438–456. doi:10.1016/j.addr.2009.03.005.
- Kalita, P., A. Dasgupta, V. Sritharan, and S. Gupta. 2015. “Nanoparticle-Drug Bioconjugate as Dual Functional Affinity Ligand for Rapid Point-of-Care Detection of Endotoxin in Water and Serum.” Analytical Chemistry 87 (21): 11007–11012. doi:10.1021/acs.analchem.5b02957.
- Krug, H. F. 2014. “Nanosafety Research – Are We on the Right Track??” Angewandte Chemie (International ed. in English) 53 (46): 12304–12319. doi:10.1002/anie.201403367.
- Kucki, M., C. Cavelius, and A. Kraegeloh. 2014. “Interference of Silica Nanoparticles with the Traditional Limulus Amebocyte Lysate Gel Clot Assay.” Innate Immunity 20 (3): 327–336. doi:10.1177/1753425913492833.
- Lei, C., Z. Qiao, Y. Fu, and Y. Li. 2016. “Colorimetric Detection of Lipopolysaccharides Based on a Lipopolysaccharide-Binding Peptide and AuNPs.” Analytical Methods 8 (45): 8079–8083. doi:10.1039/C6AY02371A.
- Levin, J., and F. B. Bang. 1964a. “A Description of Cellular Coagulation in the Limulus.” Bulletin of the Johns Hopkins Hospital 115: 337–345.
- Levin, J., and F. B. Bang. 1964b. “The Role of Endotoxin in the Extracellular Coagulation of Limulus Blood.” Bulletin of the Johns Hopkins Hospital 115: 265–274.
- Li, Y., P. Italiani, E. Casals, N. Tran, V. F. Puntes, and D. Boraschi. 2015. “Optimising the Use of Commercial LAL Assays for the Analysis of Endotoxin Contamination in Metal Colloids and Metal Oxide Nanoparticles.” Nanotoxicology 9 (4): 462–473. doi:10.3109/17435390.2014.948090.
- Li, Y., Z. Shi, I. Radauer-Preiml, A. Andosch, E. Casals, U. Luetz-Meindl, M. Cobaleda, et al. 2017. “Bacterial Endotoxin (Lipopolysaccharide) Binds to the Surface of Gold Nanoparticles, Interferes with Biocorona Formation and Induces Human Monocyte Inflammatory Activation.” Nanotoxicology 11 (9-10): 1157–1175., doi:10.1080/17435390.2017.1401142.
- Manago, S., N. Migliaccio, M. Terracciano, M. Napolitano, N. M. Martucci, L. De Stefano, I. Rendina, A. C. De Luca, A. Lamberti, and I. Rea. 2018. “Internalization Kinetics and Cytoplasmic Localization of Functionalized Diatomite Nanoparticles in Cancer Cells by Raman Imaging.” Journal of Biophotonics 11 (4): e201700207 doi:10.1002/jbio.201700207.
- Mano, S. S., K. Kanehira, and A. Taniguchi. 2013. “Comparison of Cellular Uptake and Inflammatory Response via Toll-like Receptor 4 to Lipopolysaccharide and Titanium Dioxide nanoparticles.” International Journal of Molecular Sciences 14 (7): 13154–13170. doi:10.3390/ijms140713154.
- Morita, T., S. Tanaka, T. Nakamura, and S. Iwanaga. 1981. “A New (1 → 3)-β-D-Glucan-Mediated Coagulation Pathway Found in Limulus Amebocytes.” FEBS Letters 129 (2): 318–321. doi:10.1016/0014-5793(81)80192-5.
- Mukherjee, S. P., N. Lozano, M. Kucki, A. E. Del Rio-Castillo, L. Newman, E. Vazquez, K. Kostarelos, P. Wick, and B. Fadeel. 2016. “Detection of Endotoxin Contamination of Graphene Based Materials Using the TNF-α Expression Test and Guidelines for Endotoxin-Free Graphene Oxide Production.” PLOS One 11 (11): e0166816 doi:10.1371/journal.pone.0166816.
- Neun, B. W., and M. A. Dobrovolskaia. 2019. “Detection of Endotoxin in Nano-Formulations Using Limulus Amoebocyte Lysate (LAL) Assays.” Journal of Visualized Experiments
- Ogata, H., I. Su, K. Miyake, Y. Nagai, S. Akashi, I. Mecklenbrauker, K. Rajewsky, M. Kimoto, and A. Tarakhovsky. 2000. “The Toll-like Receptor Protein RP105 Regulates Lipopolysaccharide Signaling in B cells.” Journal of Experimental Medicine 192 (1): 23–29. doi:10.1084/jem.192.1.23.
- Oliveira, M. D., C. A. Andrade, M. T. Correia, L. C. Coelho, P. R. Singh, and X. Zeng. 2011. “Impedimetric Biosensor Based on Self-Assembled Hybrid Cystein-Gold Nanoparticles and CramoLL Lectin for Bacterial Lipopolysaccharide Recognition.” Journal of Colloid and Interface Science 362 (1): 194–201. doi:10.1016/j.jcis.2011.06.042.
- Oostingh, G. J., E. Casals, P. Italiani, R. Colognato, R. Stritzinger, J. Ponti, T. Pfaller, et al. 2011. “Problems and Challenges in the Development and Validation of Human Cell-Based Assays to Determine Nanoparticle-Induced Immunomodulatory Effects.” Particle and Fibre Toxicology 8 (1): 8 doi:10.1186/1743-8977-8-8.
- Osorio-Roman, I. O., R. F. Aroca, J. Astudillo, B. Matsuhiro, C. Vasquez, and J. M. Perez. 2010. “Characterization of Bacteria Using Its O-antigen with surface-enhanced Raman scattering.” The Analyst 135 (8): 1997–2001. doi:10.1039/c0an00061b.
- Peula-Garcia, J. M., J. A. Molina-Bolivar, J. Velasco, A. Rojas, and F. Galisteo-Gonzalez. 2002. “Interaction of Bacterial Endotoxine (Lipopolysaccharide) with Latex Particles: application to Latex Agglutination Immunoassays.” Journal of Colloid and Interface Science 245 (2): 230–236. doi:10.1006/jcis.2001.7958.
- Piluso, L. G., and M. Y. Martinez. 1999. “Resolving Liposomal Inhibition of Quantitative LAL Methods.” PDA Journal of Pharmaceutical Science and Technology 53 (5): 260–263.
- Pober, J. S., and R. S. Cotran. 1990. “Cytokines and Endothelial Cell Biology.” Physiological Reviews 70 (2): 427–451. doi:10.1152/physrev.1990.70.2.427.
- Posha, B., and N. Sandhyarani. 2020. “Highly Sensitive Endotoxin Detection Using a Gold Nanoparticle Loaded Layered Molybdenum Disulfide-Polyacrylic Acid Nanocomposite.” The Analyst 145 (11): 3939–3947. doi:10.1039/D0AN00567C.
- Quero, G., G. Zito, S. Manago, F. Galeotti, M. Pisco, A. C. De Luca, and A. Cusano. 2018. “Nanosphere Lithography on Fiber: Towards Engineered Lab-On-Fiber SERS Optrodes.” Sensors 18 (3): 680. doi:10.3390/s18030680.
- Randviir, E. P., and C. E. Banks. 2013. “Electrochemical Impedance Spectroscopy: An Overview of Bioanalytical Applications.” Analytical Methods 5 (5): 1098–1115. doi:10.1039/c3ay26476a.
- Rietschel, E. T., H. Brade, O. Holst, L. Brade, S. Muller-Loennies, U. Mamat, U. Zahringer, et al. 1996. “Bacterial Endotoxin: Chemical Constitution, Biological Recognition, Host Response, and Immunological Detoxification.” Current Topics in Microbiology and Immunology 216: 39–81. doi:10.1007/978-3-642-80186-0_3.
- Schwarz, H., J. Gornicec, T. Neuper, M. A. Parigiani, M. Wallner, A. Duschl, and J. Horejs-Hoeck. 2017. “Biological Activity of Masked Endotoxin.” Scientific Reports 7: 44750. doi:10.1038/srep44750.
- Seibert, F. B. 1925. “The Cause of Many Febrile Reactions following Intravenous Injections. I.” American Journal of Physiology-Legacy Content 71 (3): 621–651. doi:10.1152/ajplegacy.1925.71.3.621.
- Smulders, S.,. J. P. Kaiser, S. Zuin, K. L. Van Landuyt, L. Golanski, J. Vanoirbeek, P. Wick, and P. H. Hoet. 2012. “Contamination of Nanoparticles by Endotoxin: Evaluation of Different Test Methods.” Particle and Fibre Toxicology 9: 41 doi:10.1186/1743-8977-9-41.
- Su, W., M. Cho, J.-D. Nam, W.-S. Choe, and Y. Lee. 2013. “Aptamer-Assisted Gold Nanoparticles/PEDOT Platform for Ultrasensitive Detection of LPS.” Electroanalysis 25 (2): 380–386. doi:10.1002/elan.201200453.
- Su, W., and X. Ding. 2015. “Methods of Endotoxin Detection.” Journal of Laboratory Automation 20 (4): 354–364. doi:10.1177/2211068215572136.
- Sun, J., J. Ge, W. Liu, X. Wang, Z. Fan, W. Zhao, H. Zhang, P. Wang, and S.-T. Lee. 2012. “A Facile Assay for Direct Colorimetric Visualization of Lipopolysaccharides at Low Nanomolar Level.” Nano Research 5 (7): 486–493. doi:10.1007/s12274-012-0234-1.
- Unites States Pharmacopoeia. 2007. Chapter 85 Bacterial Endotoxin Test.
- Vallhov, H., J. Qin, S. M. Johansson, N. Ahlborg, M. A. Muhammed, A. Scheynius, and S. Gabrielsson. 2006. “The Importance of an Endotoxin-Free Environment during the Production of Nanoparticles Used in Medical Applications.” Nano Letters 6 (8): 1682–1686. doi:10.1021/nl060860z.
- Vigano, E., C. E. Diamond, R. Spreafico, A. Balachander, R. M. Sobota, and A. Mortellaro. 2015. “Human Caspase-4 and Caspase-5 Regulate the One-Step Non-Canonical Inflammasome Activation in Monocytes.” Nature Communications 6: 8761 doi:10.1038/ncomms9761.
- Weller, T., R. Kragseth, R. Dullinger, H. Illum, and A. Perry. 2015. “Dry-Heat Depyrogenation Ovens for Pharmaceutical Compounding Facilities.” International Journal of Pharmaceutical Compounding 19: 182–192.
- Winey, M., J. B. Meehl, E. T. O'toole, and T. H. Giddings. Jr., 2014. “Conventional Transmission Electron microscopy.” Molecular Biology of the Cell 25 (3): 319–323. doi:10.1091/mbc.E12-12-0863.
- Yang, R. B., M. R. Mark, A. Gray, A. Huang, M. H. Xie, M. Zhang, A. Goddard, W. I. Wood, A. L. Gurney, and P. J. Godowski. 1998. “Toll-like Receptor-2 Mediates Lipopolysaccharide-Induced Cellular Signalling.” Nature 395 (6699): 284–288. doi:10.1038/26239.
- Yang, M., X. Nie, J. Meng, J. Liu, Z. Sun, and H. Xu. 2017. “Carbon Nanotubes Activate Limulus Amebocyte Lysate Coagulation by Interface Adsorption.” ACS Applied Materials and Interfaces 9 (10): 8450–8454. doi:10.1021/acsami.7b00543.
- Yu, C. Y., G. Y. Ang, A. L. Chua, E. H. Tan, S. Y. Lee, G. Falero-Diaz, O. Otero, et al. 2011. “Dry-Reagent Gold Nanoparticle-Based Lateral Flow Biosensor for the Simultaneous Detection of Vibrio Cholerae Serogroups O1 and O139.” Journal of Microbiological Methods 86 (3): 277–282., doi:10.1016/j.mimet.2011.04.020.
- Zhou, H., D. Yang, N. P. Ivleva, N. E. Mircescu, S. Schubert, R. Niessner, A. Wieser, and C. Haisch. 2015. “Label-Free in Situ Discrimination of Live and Dead Bacteria by Surface-Enhanced Raman Scattering.” Analytical Chemistry 87 (13): 6553–6561. doi:10.1021/acs.analchem.5b01271.
- Zhu, L., S. Li, X. Shao, Y. Feng, P. Xie, Y. Luo, K. Huang, and W. Xu. 2019. “Colorimetric Detection and Typing of E. coli Lipopolysaccharides Based on a Dual Aptamer-functionalized Gold nanoparticle probe .” Mikrochimica Acta 186 (2): 111 doi:10.1007/s00604-018-3212-9.
- Zuo, M. Y., L. J. Chen, H. Jiang, L. Tan, Z. F. Luo, and Y. M. Wang. 2014. “Detecting Endotoxin with a Flow Cytometry-Based Magnetic Aptasensor.” Analytical Biochemistry 466: 38–43. doi:10.1016/j.ab.2014.08.018.