
Abstract
Synthetic amorphous silica (SAS) is applied in food products as food additive E 551. It consists of constituent amorphous silicon dioxide (SiO2) nanoparticles that form aggregates and agglomerates. We reviewed recent oral toxicity studies with SAS. Some of those report tissue concentrations of silicon (Si). The results of those studies were compared with recently determined tissue concentrations of Si (and Si-particles) in human postmortem tissues. We noticed inconsistent results of the various toxicity studies regarding toxicity and reported tissue concentrations, which hamper the risk assessment of SAS. A broad range of Si concentrations is reported in control animals in toxicity studies. The Si concentrations found in human postmortem tissues fall within this range. On the other hand, the mean concentration found in human liver is higher than the reported concentrations causing liver effects in some animal toxicity studies after oral exposure to SAS. Also higher liver concentrations are observed in other, negative animal studies. Those inconsistencies could be caused by the presence of other Si-containing chemical substances or particles (which potentially also includes background SAS) and/or different sample preparation and analytical techniques that were used. Other factors which could explain the inconsistencies in outcome between the toxicity studies are the distinct SAS used and different dosing regimes, such as way of administration (dietary, via drinking water, oral gavage), dispersion of SAS and dose. More research is needed to address these issues and to perform a proper risk assessment for SAS in food. The current review will help to progress research on the toxicity of SAS and the associated risk assessment.
Introduction
Synthetic Amorphous Silica (SAS) is applied in production of food and feed products as a clearing agent, stabilizer, carrier, anticaking agent or flow aid (EFSA ANS Panel et al. Citation2018; Fruijtier-Pölloth Citation2016; Villota, Hawkes, and Cochrane Citation1986). It is known as food additive E 551. As an anticaking agent or flow aid, SAS covers the surface of host powders in the food product, thereby reducing attracting Van-der Waals forces and/or absorbing the liquid film covering the host particles. In addition to its use as food additive, its use in dietary supplements, medicines and toothpaste can result in direct oral exposure (Aureli et al. Citation2020). SAS has many other applications, including in personal care products (i.e. cosmetics) other than toothpaste, as biocidal active substance, and in food contact materials.
SAS added to food consists of amorphous silicon dioxide (SiO2) particles. Dependent on different production processes, SAS exists as pyrogenic silica, precipitated silica, silica gel and colloidal silica (Fruijtier-Pölloth Citation2012). Colloidal silica is not authorized as food additive E 551 (EFSA ANS Panel et al. Citation2018; EU Citation2012). SAS is also allowed as animal feed additive (EC Citation2020; RIKILT and JRC Citation2014). SAS in feed is divided into E 551a, E 551b and E 551c, consisting of precipitated silica, colloidal silica, and kieselguhr (diatomaceous earth), respectively (EC Citation2020).
SAS should be considered as a nanomaterial according to the EU Recommendation on the Definition of a Nanomaterial (Bleeker et al. Citation2013; EU Citation2011). The size of its constituent particles range between 5 and 100 nm and the material usually forms small aggregates and larger agglomerates (Fruijtier-Pölloth Citation2012). As a result of the conditions in the gastrointestinal tract, the SAS nanoparticles (NPs) were shown to form larger agglomerates in the stomach (Peters et al. Citation2012). These agglomerates were observed to fall apart again in smaller NPs under intestinal conditions, leading to exposure to SAS NPs in the gastrointestinal tract (Peters et al. Citation2012). In principle, SAS particles could dissolve at a higher rate in an alkaline environment (pH > 7.5) or in the presence of certain biomolecules too, and precipitate again under acidic conditions (Sohal et al. Citation2018). However, at the physiologically relevant pH’s and transit times of the intestinal tract, dissolution is not conceived to play an important issue (Peters et al. Citation2012).
Although it is sometimes assumed that aggregates and agglomerates are less toxic (Fruijtier-Pölloth Citation2012), aggregates of SAS were recently shown to cause similar effects with regard to cytotoxicity as SAS NPs in certain in vitro assays (Murugadoss et al. Citation2020). The safety of SAS has been addressed by several reviews (Croissant et al. Citation2020; Fruijtier-Pölloth Citation2016; Murugadoss et al. Citation2017; van Kesteren et al. Citation2015; Winkler, Suter, and Naegeli Citation2016).
Until recently, the acceptable daily oral intake (ADI) for SiO2 (and certain aluminum, calcium and sodium silicates) in the EU was ‘not specified’, as it was considered inert (SCF Citation1991). This meant that on the basis of the available data, the total daily intake of the substance via food did not represent a hazard to health. However, in 2018, the European Food Safety Authority (EFSA) concluded it was unable to confirm this status. The need to derive an ADI was indicated and additional information was requested because of the limitations in the toxicological database (EFSA ANS Panel et al. Citation2018).
In the past decade, we have taken several steps in the human risk assessment of SAS ingested via food (Figure S1 in the Supplemental Material illustrates this process). Our first studies demonstrated that nanosized SiO2 is present in food products and remains present as particles in the gastrointestinal tract, showing the need for further toxicological investigations taking insights on the effects of NPs into account (Dekkers et al. Citation2011; Peters et al. Citation2012). The initial risk assessments indicated that a health risk related to SAS in food could not be excluded (Dekkers et al. Citation2013; Dekkers et al. Citation2011). In 2015, we refined the risk assessment approach by using new oral toxicity data (van der Zande et al. Citation2014), kinetic information (Jacobsen et al. Citation2013), and modeled internal concentrations (van Kesteren et al. Citation2015). The latter allowed us to incorporate a non-linear oral absorption rate of SAS in the risk assessment, as an oral in vivo rat study showed a higher oral absorption fraction for SAS at lower, dietary relevant doses and a lower absorption at higher doses (van der Zande et al. Citation2014). In addition, the use of kinetic modeling allowed us to incorporate tissue accumulation of SAS following prolonged exposure (van Kesteren et al. Citation2015). Based on the obtained internal concentrations an improved risk assessment could be performed, which confirmed our previous conclusion that a health risk of SAS in food could not be excluded (van Kesteren et al. Citation2015).
Yet, this conclusion includes a number of uncertainties and assumptions. Part of these uncertainties are related to the actual human exposure via dietary intake and to the corresponding estimated SAS burden of the human liver as the critical effect organ. With new data, we try to further address these uncertainties in the current paper. Recently, the presence of the element Si and of Si-containing particles (interpreted as SiO2 particles), which include aggregates and agglomerates, was determined in human postmortem tissues (Peters et al. Citation2020). These included liver, spleen, kidney and intestinal tissues. In addition, also a number of new oral toxicity studies and other (animal) studies reporting tissue concentrations of Si were published since our risk assessment by van Kesteren et al. (Citation2015). Most of these new oral toxicity studies were not included in the re-evaluation of E 551 (EFSA ANS Panel et al. Citation2018), because they were not yet published or finished too late to be taken into account by EFSA. Recently, it has also become more clear what issues are critical in the risk assessment of nanomaterials (EFSA Scientific Committee et al. Citation2018; EFSA Scientific Committee et al. Citation2020).
In the present review, we interpreted all above mentioned relevant new data for risk assessment of oral exposure to SAS. We compiled, structured and critically assessed the available toxicity studies. We also compared the reported tissue concentrations of Si as observed in animal toxicity studies with the concentrations found in humans in the same tissues. Exposure to Si from other sources than SAS are discussed to put the findings into perspective. Furthermore, several other issues appeared to complicate the risk assessment. These include background exposure to soluble Si and Si-particles, analytical issues, the silica used, the dosing regime and dispersion in animal toxicity studies. These issues are discussed as well. Altogether, this manuscript presents a comprehensive overview and assessment on the available information on the toxicity of SAS and the associated risk assessment upon oral exposure to SAS, and a way forward to progress research in this field.
Toxicity studies
In our previous risk assessment by van Kesteren et al. (Citation2015), the key oral and intravenous in vivo toxicity studies were collected and evaluated to determine the target tissues and their critical internal effect level, i.e. the critical organ burden, of SAS. Those studies indicated the liver to be the main target organ. The oral in vivo rat study by van der Zande et al. (Citation2014), in which rats were exposed for 84 days to a commercially available food-grade, pyrogenic SAS or to a pyrogenic SAS reference material (NM-202) via their diet, was determined to be the key study for risk assessment (van Kesteren et al. Citation2015). As a result of exposure to NM-202, van der Zande et al. (Citation2014) observed mild periportal fibrosis in the liver by histopathology, which was supported by whole genome gene expression analysis that demonstrated induced gene expression in a fibrosis-related gene set. However, such an effect was not (significantly) observed for the other pyrogenic SAS used. Those findings provided a Lowest Observed Adverse Effect Level (LOAEL) of 1000 mg/kg bw/d (van der Zande et al. Citation2014). Results of other, intravenous toxicity studies also showed indications for liver fibrosis after intravenous exposure to SAS (Hasezaki et al. Citation2011; Isoda et al. Citation2011; Nishimori et al. Citation2009a, b).
New oral toxicity studies
Since our previous work, several new oral animal toxicity studies with SAS were published. These have been summarized in (Table S1 in the Supplemental information provides a more detailed version). Note that these studies use different SAS (not all compliant with the specifications of food additive E 551), focused on different endpoints and differ in level of detail and quality, and outcome. Aspects that might play a role and affect the differences in outcome are discussed in the discussion section. Part of the studies (i.e. Hofmann et al. (Citation2015), Tarantini et al. (Citation2015), Wolterbeek et al. (Citation2015), Yoshida et al. (Citation2014), Yun et al. (Citation2015)) were also included in the re-evaluation of E 551 by EFSA published in 2018. EFSA concluded there was no indication for toxicity of SiO2 (E 551) at the reported uses and use levels, but that there were limitations in the toxicity data. Those limitations included the lack of a chronic exposure study with SiO2 representative for SAS used as food additive (EFSA ANS Panel et al. Citation2018). The data from the study by van der Zande et al. (Citation2014) was regarded by EFSA as not sufficiently robust to conclude on the reliability and relevance of the effects reported. The studies listed in were clustered in (sub)chronic studies and subacute studies and have been summarized below.
Table 1. Overview of recent in vivo, oral toxicity studies performed with SAS (published after June 2014), in addition to the study by van der Zande et al. (Citation2014).
(Sub)chronic oral toxicity studies
Six new oral (sub)chronic toxicity studies were published since our previous risk assessment in 2015. Among those are three traditional OECD guideline 90-day oral toxicity studies applying relatively high doses, from 167 up to 2000 mg/kg bw/d. Those studies did not report adverse effects of exposure to SAS (), as studied amongst others by histopathology and blood biomarkers (Y. R. Kim et al. Citation2014; Liang et al. Citation2018; Yun et al. Citation2015). The study by Y. R. Kim et al. (Citation2014) raises some questions about the dispersion of SAS and reported alveolar effects (see discussion below). EFSA did not take the study into account in its re-evaluation, possibly because of those questions. Note that in the study by Liang et al. (Citation2018) the larger SAS microparticles (MPs) studied were not well dispersed, as they settled during the preparation of suspensions, and their hydrodynamic size could not be determined (). It is not clear whether the SAS used by Liang et al. (Citation2018) and Yun et al. (Citation2015) is compliant with the E 551 specifications.
Three recent studies using relatively low dose levels (from 2 up to 200 mg/kg bw/d), however, did report effects, including effects on the liver (Boudard et al. Citation2019; Hu et al. Citation2019; Tassinari et al. Citation2020). The study by Boudard et al. (Citation2019) demonstrated that chronic exposure (18 months) of mice to 4.8 mg/kg bw/d precipitated SAS (NM-200) via the drinking water triggered renal and liver inflammation accompanied by amyloidosis in kidney glomeruli and in perivascular regions. However, the study was performed with only one dose level, a limited number of animals and focused on a limited number of endpoints, i.e. on liver and kidney (Boudard et al. Citation2019; Boudard et al. Citation2020). A subchronic study using relatively low dose levels was performed by Hu et al. (Citation2019), in which mice were treated for 18 weeks with different doses pyrogenic or colloidal silica particles (both NPs and MPs) focusing on endocrine effects and blood glucose levels. Exposure to 100 mg/kg bw/d (the only tested dose) of pyrogenic NPs resulted in lowered superoxide dismutase (SOD) and glutathione (GSH) levels and increased malonyl dialdehyde (MDA) levels after 7 weeks in serum and in the liver, indicating reactive oxygen species (ROS) generation in the liver. In addition, exposure to both pyrogenic or colloidal SAS NPs affected the expression of genes associated with ROS production and endoplasmatic reticulum (ER) stress in the liver (as detected by RNA sequencing). Those effects were not seen as a result of exposure to silica MPs (Hu et al. Citation2019). Unfortunately, histopathology was not performed in this study by Hu et al. (Citation2019). Tassinari et al. (Citation2020) performed an OECD guideline 90-day toxicity study with low doses of pyrogenic SAS (NM-203) and demonstrated several histopathological effects in male rats’ liver including dose-related enlarged sinusoids at 10, 20 and 50 mg/kg bw/d. Therefore, the authors derived a NOAEL of 5 mg/kg bw/d for male rats (Tassinari et al. Citation2020). Remarkedly, this effect was not shown in female rats. In female rats, however, decreased creatinine (CREA) and increased thyroid-stimulating hormone (TSH) levels led the authors to derive a LOAEL for female rats of 2 mg/kg bw/d (Tassinari et al. Citation2020).
(Sub)acute oral toxicity studies
Recently also several (sub)acute toxicity studies with SAS were published (). Note that also the studies by van der Zande et al. (Citation2014) and Yun et al. (Citation2015), which are listed under the (sub)chronic studies, ran a 28-day and 14-day rat study, respectively. No effects were found in these two studies. Two 28-day studies in rats or mice focusing on surface-modified colloidal silica particles did not report any particle-related and relevant treatment-related adverse effects either (Buesen et al. Citation2014; Yoshida et al. Citation2014). Also two shorter studies, including a 7-day study with an 11-week follow-up upon administering 100 or 1000 mg/kg bw/d colloidal silica particles via feed to rats (Kim et al. Citation2017), and a 5-day study up administering 100 or 1000 mg/kg bw/d of two sizes of colloidal silica to mice (Cabellos et al. Citation2020), were negative.
In contrast, Li et al. (Citation2018) studied the effects of 30-day exposure of silica NPs in male Kun-Ming mice, some co-exposed to fructose in order to induce metabolic syndrome. Only a dose level of 10 mg/kg bw/d silica NPs (physicochemical properties not specified) was tested. As a result liver injury was reported (infiltration of inflammatory cells, indications of fibrosis, increased mRNA levels of hepatic IL-1β and TNF-α, and indications of apoptosis). Those effects were stronger in mice with fructose-induced metabolic syndrome (Li et al. Citation2018). Also histopathological effects in the liver have been reported after 5 days of oral exposure to 333 mg/kg bw/d (unspecified) SAS (Hassankhani et al. Citation2015). The particularly study was performed with only one dose level (of minimally characterized material) and a very limited number of animals, and therefore not considered reliable for risk assessment.
Other studies
In addition to (sub)chronic and (sub)acute oral toxicity studies, some other repeated-dose studies were published since our previous work (See Table S1 in the Supplementary information). Those included OECD guideline studies for reproduction toxicity (Wolterbeek et al. Citation2015) and developmental toxicity (Hofmann et al. Citation2015) with precipitated SAS (NM-200). The studies reported no dose-related and relevant treatment-related adverse effects up to a dose of 1000 mg/kg bw/d. Genotoxicity in vivo studies with low doses (up to 20 mg/kg bw/d) precipitated (NM-200, NM-201) or pyrogenic SAS (NM-203, NM-203) reference materials (Tarantini et al. Citation2015), or higher doses of colloidal SAS (Cabellos et al. Citation2020), were negative as well.
Remarkable effects on lung
As mentioned above, the sub-chronic study by Y. R. Kim et al. (Citation2014) reported alveolar effects. They observed granulomatous and bronchio-alveolar inflammation in the lungs, after 90 days of exposure to a dose of 1000 or 2000 mg/kg bw/d of 20 nm colloidal silica given by oral gavage. Systemic exposure of nanoparticles, also resulting from oral exposure, could lead to distribution to the lungs and cause adverse effects (Landsiedel et al. Citation2012). The possibility of treatment-related adverse effects in the lung is supported by findings of Xie et al. (Citation2010), who showed prolonged retention of radio-labeled SiO2 in the lung (and liver and spleen) after a single intravenous injection of 10 mg/kg bw of 20 nm and 80 nm sized particles (Xie et al. Citation2010). On the other hand, especially in extended repeated-dose studies, the possibility that silica might get into the respiratory tract as a result of the gavage administration (i.e. by gavage-related reflux or technical gavage errors) causing adverse effects, should be taken into account (Damsch et al. Citation2011).
According to the authors, the alveolar effects reported by Y. R. Kim et al. (Citation2014) were not treatment-related as the number of animals in which they occurred was too little. The lesions were observed in only one out of five 1000 mg/kg bw/d and in three out of five 2000 mg/kg bw/d dosed male animals while no effects were seen in female animals, and the lesions were minimal to mild in severity. However, a treatment-related effect cannot just be excluded as such effects usually not appear spontaneously, but also gavage-related reflux or gavage errors should have been considered as a cause. Remarkably, the effects were not seen in the animals exposed to 100 nm colloidal silica (Y. R. Kim et al. Citation2014). Interestingly, also other studies report similar lung lesions. Liang et al. (Citation2018) reported lesions in the lung (focal epithelial cell proliferation, foreign body granulomas, and mild alveolar septum widening) after 90 days of exposure to precipitated SAS (both NPs and MPs, at all dose levels starting at 167 mg/kg bw/d) given by oral gavage, which was considered not exposure route-related according to the authors. They indeed speculated that silica might have entered the lungs via the gavage administration (Liang et al. Citation2018). Also the study by Hassankhani et al. (Citation2015), which is not considered reliable for risk assessment, reported lung lesions (congestion, interstitial pneumonia, thickness of the alveolar, infiltration of the inflammatory exudates in the alveoli, and bronchopneumonia) after 5 days of exposure to 333 mg/kg bw/d SAS given by oral gavage.
Lung effects have not been investigated in most oral toxicity studies. Though the reported effects on the lung after oral exposure by three studies are remarkable, this review further focusses on liver effects, as the liver is considered the critical target organ and more relevant with regard to oral exposure to the low, dietary dose levels of SAS.
Altogether, there are several recent toxicity studies, including six (sub)chronic studies, testing the effects upon oral exposure to SAS. These studies differ both in set-up, including quality, and outcome (). Aspects that might play a role and affect the differences in outcome are discussed in the discussion section.
Presence of Si in animal tissues
van der Zande et al. (Citation2014) reported concentrations of SiO2 in rat liver, spleen, kidney, brain and testis after 28-day exposure to different dose levels of two pyrogenic silicas (NM-202 and Aerosil 380), and after 84-day exposure to the highest dose level. Apart from the study by Y. R. Kim et al. (Citation2014), all new (sub)chronic animal toxicity studies reported tissue concentrations (of silicon (Si), i.e. total-Si) after oral exposure to silica (Boudard et al. Citation2019; Hu et al. Citation2019; Liang et al. Citation2018; Tassinari et al. Citation2020; Yun et al. Citation2015). The six (sub)chronic animal studies reporting tissue concentrations were already described in the toxicity study section above (including in ). presents an overview of the reported tissue concentrations in liver and spleen reported by those studies. For comparison also the tissue concentration (total-Si) determined in human postmortem tissues from the study by Peters et al. (Citation2020) is included in (in the final row below the animal tissue measurements). Tissue concentrations in kidney and intestinal tissue reported by those studies can be found in Table S2 of the Supplementary information. Reported tissue concentrations after short sub-acute or single-dose studies (Jacobsen et al. Citation2013; Lee et al. Citation2014) were not taken into account, as steady state tissue concentrations as a result of (sub)chronic exposure ought to better represent the human levels, as determined by Peters et al. (Citation2020), after life-long exposure (van Kesteren et al. Citation2015).
Table 2. Reported mean Si (or SiO2) concentrations (mg/kg) in liver (A) and spleen (B) as a result of different dose levels of different SAS as reported in the different recent (sub)chronic animal (toxicity) studies with oral exposure.
In general, inorganic nanomaterials are detected by their elemental composition via inductively coupled plasma mass spectrometry (ICP-MS), or related similar techniques. ICP-MS offers the detection power needed for measuring even low amounts of particles via the concentration of their characteristic chemical elements (Aureli et al. Citation2020). It can also be used to directly detect particles and analyze their chemical composition when used in single particle mode (sp-ICP-MS) (Peters et al. Citation2015) or coupled with asymmetric flow field fractionation (Aureli et al. Citation2015). Usually total-Si is quantified in tissues as a measure for the concentration of SiO2.
Boudard et al. (Citation2019) determined Si concentrations in mice liver and kidney by ICP-MS after 18 months exposure to one dose level (4.8 mg/kg bw/d) of precipitated SAS (NM-200) particles via drinking water. Hu et al. (Citation2019) determined Si concentrations in mice liver, spleen, kidney and small intestine (and in pancreas and muscle tissue) using ICP-OES after 18-weeks exposure to different dose levels of pyrogenic silica NPs, or one dose level (100 mg/kg bw/d) of pyrogenic MPs, colloidal silica NPs or pyrogenic silica MPs, via oral gavage. Tassinari et al. (Citation2020) determined Si concentrations in rat liver, spleen and small intestine (and brain) by ICP-MS after 90-day exposure to different, low dose levels of pyrogenic silica NPs (NM-203) after oral gavage. Yun et al. (Citation2015) determined Si concentrations in rat liver, spleen and kidney (and brain) using ICP-MS after 90-day exposure to three, medium-high dose levels of unspecified SAS NPs via oral exposure. Although not reported, the SAS used is likely colloidal, as it has been dispersed already by the supplier. Finally, Liang et al. (Citation2018) determined Si concentrations in rat liver and kidney (and blood and testis) by ICP-AES after 90-day exposure to three, medium-high dose levels of precipitated SAS NPs or MPs ().
Compared to the reported control values, only a few significantly increased tissue concentrations were reported as a result of (sub)chronic exposure to SAS (). Looking at the reported levels within individual studies that tested more than one dose level, some studies do not report significantly increased tissue concentrations with increased administered doses (Liang et al. Citation2018; Yun et al. Citation2015). In case of the 1088 nm precipitated SAS MPs tested by Liang et al. (Citation2018), this could be expected, as these particles did not disperse properly in the solution as noted by the authors. Note that Liang et al. (Citation2018) even reported significantly decreased Si-concentrations in the liver of female rats. In two other studies, in which a significant increase in tissue concentration with administration of SAS is observed, this does not seem to increase dose-dependently (Tassinari et al. Citation2020; van der Zande et al. Citation2014). An exception is the study by Hu et al. (Citation2019) that reports a clear dose-responsive increase as a result of exposure to pyrogenic SAS NPs. It can therefore be concluded that the relationship between external dose and internal tissue concentration is not straightforward. It should be noted that in the study by van der Zande et al. (Citation2014), for example, the reported total-Si levels in spleen in control animals vary between <75 and ∼175 mg/kg (), and that this variation is mostly larger than between the reported values after exposure to SAS and the respective controls. In addition, the LOD in the study by van der Zande et al. (Citation2014) can be too high to distinguish increased organ concentrations from the background. Altogether, the present evidence for a real increase of total-Si in organs in animal studies is limited.
Measuring total-Si by ICP-MS is challenging because of contamination due to the ubiquitous presence of Si in reagents and of silica in labware and analytical equipment (Aureli et al. Citation2020; Peters et al. Citation2020). Also, a substantial endogenous background exists as Si naturally-occurs in biological tissues. It has also to be noted that for total-Si silica measurements particles need to be converted into soluble Si and, when ICP-MS detection is opted for, there are severe spectral interferences affecting the accuracy of analytical determinations unless specific methodologies are used to deal with them. Quality control is also limited due to the lack of reference materials with a biological matrix (Aureli et al. Citation2020). These factors need to be taken into account as they affect the quantification of Si and the interpretation of the results. The studies by van der Zande et al. (Citation2014), Boudard et al. (Citation2019), and Tassinari et al. (Citation2020) address at least some of these issues, although the LOD of the analytical method by van der Zande et al. (Citation2014) is too high. The procedures used by Hu et al. (Citation2019) Liang et al. (Citation2018) and Yun et al. (Citation2015) have been reported much more briefly, and their description does not address these issues. This uncertainty should be considered in the interpretation of data of these studies.
Background Total-Si in animals
Across all studies reporting tissue concentrations in , a wide range of Si concentrations is reported, even in the control tissues. For example, the apparent background levels reported (i.e. concentrations in the tissues of the experimentally unexposed control animals) in liver varied from ∼0.1 mg Si/kg up to ∼95 mg SiO2/kg (the latter corresponding with ∼44 mg Si/kg) (). In spleen, a range of apparent background levels from ∼1.4 mg Si/kg up to ∼175 mg SiO2/kg (the latter corresponding with ∼81 mg Si/kg) were reported (). As in the control animals those levels cannot result from the administered dose of SAS, these must already be present as background, e.g. as a result from the presence of Si containing chemical substances (including Si-particles such as SAS) in feed or drinking water, or be the result of contamination due to experimental procedures of analytical equipment.
Si could originate from the biological background in feed or drinking water, but because SAS is also allowed as feed additive, i.e. E 551a, E 551b and E 551c (EC Citation2020; Reeves Citation1997; RIKILT and JRC Citation2014), the total-Si detected in animal studies may also (partly) consist of added SiO2 particles. Total-Si analysis cannot differentiate between Si containing chemical substances (including Si-particles such as SAS). Aureli et al. (Citation2020) studied the Si content in 5 different, commercially available pelleted standard rodent feeds, and found a 10-fold difference. According to the authors, the Si consists of naturally occurring soluble Si, i.e. orthosilicic acid and associated Si-containing species with high bioavailability, and some polymeric or phytolithic silica in vegetable food (thought to be hydrolyzed to orthosilicic acid in the gastro-intestinal tract) (Aureli et al. Citation2020). The presence of particulate Si has not been studied, or speculated upon by the authors. In addition, silicon (as orthosilicic acid and associated Si-containing species) can be regarded as a bio-element involved in bone formation (Chappell, Jugdaohsingh, and Powell Citation2020).
Because the detection of total-Si is challenging, as mentioned above, also experimental procedures related to the analysis have been pointed out as a source of Si in measurements (Aureli et al. Citation2020). Therefore, it is expected that differences in both experimental procedures including sample preparation and analytical techniques are also a likely cause of the differences in the reported Si background levels in . Especially the high total-Si concentrations in tissues of control animals reported (i.e. by van der Zande et al. (Citation2014), and to a lesser extent by Hu et al. (Citation2019) and Liang et al. (Citation2018)), seem implausible as background compared to physiologically total-Si concentrations in rats (Jugdaohsingh et al. Citation2015). This indicates the suitability of the experimental procedures and/or analytical method used by such studies to determine background concentrations and somewhat increased tissue concentrations due to exposure to SAS is limited.
Measurements in human tissues
Information about human tissue concentrations of Si is limited, and only one, recent study quantitively reported particulate concentrations (Peters et al. Citation2020). Peters et al. (Citation2020) examined the Si concentration in organs known for distribution/accumulation of NPs, i.e. the liver, spleen, kidney and two sections of intestinal tissue by (single particle) Inductively Coupled Plasma High Resolution Mass Spectrometry (sp-ICP-HRMS) techniques. These findings were substantiated with a few EM-energy dispersive X-ray spectroscopy (EDX) images. The postmortem tissues were obtained from 15 individuals (8 females and 7 males, age 64–98 years) whose bodies were donated to the Department of Anatomy of the University Medical Center Utrecht for educational and research purposes (Peters et al. Citation2020). Total-Si concentrations of 3.2–26 mg/kg liver, 3.0–47 mg/kg spleen, 4.4–21 mg/kg kidney and 2.7–191 mg/kg small intestinal tissue were demonstrated (). Although the intestinal tissues were rinsed with Milli-Q water, in cannot be excluded that a (limited) part of the total-Si determined present at the lumen side of the intestinal tissues, i.e. entrapped in the crypts of Lieberkuhn and/or around the intestinal villi.
Table 3. Concentrations of total silicon (Total-Si) and silicon particles (Si-particles) in postmortem human tissues (both measured as mg Si/kg) as reported by Peters et al. (Citation2020).
As with the quantification of the presence of Si in animal tissues mentioned above, measuring total-Si is troubled because of potential contamination of other sources of Si, i.e. from reagents, labware and analytical equipment. For the determinations by Peters et al. (Citation2020), all materials that have been in contact with the organs, including scalpels and knives, and materials and utensils to process and homogenize the organs the total-Si concentrations in these materials, or released by these materials, were determined to determine potential sample contamination. The sum of the blank contributions of each of the materials was equal to or lower than the limit of detection (LOD). Also the contribution by formaldehyde used to fix the body tissues, a known source of Si contamination, was determined. Formaldehyde contributed to the total-Si concentration about 2 times the LOD, and the total-Si values reported by Peters et al. (Citation2020) were corrected for this contribution.
As can be seen in , only about 10% of the total-Si concentrations in the study by Peters et al. (Citation2020) can be explained by the measured concentrations of Si-particles (). This can be explained by three reasons. First, non-particulate Si (e.g. orthosilicic acid) could be present (Aureli et al. Citation2020; Powell et al. Citation1996). Second, the presence of micro-sized SiO2 particles or other Si-containing particles, i.e. aggregates/agglomerates, which were not analyzed with the approach used because the particle size detection range was between 100 nm and about 1000 nm (Peters et al. Citation2020). Third, any smaller SiO2 or other Si-containing particles <100 nm being missed. However, although these might be high in number, they could be contributing little to the total particulate Si mass and concentration.
Another study by Locci et al. (Citation2019) detected the presence of Si-particles in human liver and kidney, but in a qualitative manner. In that study, size, shape and elemental composition of particles was determined in postmortem liver and kidney from 35 subjects from Sardinia, Italy (Locci et al. Citation2019). Quantitative determinations of particles, e.g. number or mass per kg tissue, were not performed. Instead, the number of particles in a defined area of a field-emission scanning electron microscopy (FESEM) sample, as prepared from a slice of 5 g tissue sample, was determined. The elemental composition of the particles was determined by EDX. No major differences in the determined number of particles, size and morphology between liver and kidney were observed. In addition, no relationship between gender, age and detected particles was observed either. The presence of particles was reported, as aggregates or agglomerates, ranging between 50 nm and 100 µm and often consisting of multiple associations of elements. Si comprised about 61% of the elemental composition over all particles determined (note that the element oxygen (O) was not included in the determination). However, as the study was directed at larger particles, the potential presence of silica NPs smaller than 50 nm is missed. Interestingly, there was a large number of different Si aggregates/agglomerates comprising of different elements, such as AlSi, FeAlSi, FeSi, SiAlAs, SiAlFeHgTi, SiAlFeTi, SiAlSFe, SiAlPbS, SiFeAl, SiGeAl, SSiAl, and SiAlTi (Locci et al. Citation2019).
Sources of human Si exposure
It is still uncertain what the main origin of the Si in human tissues is. Oral exposure is assumed to be the major route of exposure to both total-Si and SiO2 particles in the non-occupational setting. Though it may be high in certain occupational settings (including agriculture), air usually contains only a very limited amount of Si containing minerals such as silica or silicates (Bhagia Citation2012). Though highly variable, the concentration of silica (quartz) in air (indoor and outdoor) for instance was estimated to be up to 15.8 µg/m3 (Davis et al. Citation1984; USEPA Citation1996), equivalent to an exposure of 4.6 µg/kg bw/d via inhalation. There is no or negligible dermal uptake of SiO2 (Ryu et al. Citation2014).
Deliberate oral exposure to Si and SAS can occur via food, food supplements and medicinal products, whereas soil and dust may be ingested unintentionally. Default values for the average daily soil ingestion via hand-to-mouth contact are 50 mg/d for adults and 100 mg/d for children (1–7 years of age) (Lijzen et al. Citation2001; Otte et al. Citation2001). As sand consists almost fully of silica (quartz), the intake from hand-to-mouth contact can be up to about 0.7 mg SiO2/kg bw/d for adults and 10 mg SiO2/kg bw/d for children. Deliberate oral exposure via soil is generally considered to be rare, but could considerably contribute to the exposure of young children ingesting soil at a certain age (pica behavior). Since the silica in soil consists mainly of larger particles with low solubility, the absorption of soil is considered a limited source of Si in human tissues. The deliberate oral exposure via food, supplements and medicinal products consists of added Si-particles such as SAS, or naturally present other Si-containing chemical substances.
The presence of (aggregated) nano-sized SiO2 particles in commercially available food products or dietary supplements has been demonstrated in various studies (Athinarayanan et al. Citation2015; Contado et al. Citation2016; Contado, Ravani, and Passarella Citation2013; Lim et al. Citation2015). Dekkers et al. (Citation2011) measured concentrations of SiO2 particles in food products, and estimated the average-to-worst-case daily dietary intake to be 9.4 mg SAS/kg bw/d for adults. This value is in line with the dietary exposure to E 551 for six different age groups as estimated by EFSA. They reported a mean dietary intake ranging from 0.7 to 18.4 mg SiO2/kg bw/d, with a 95th percentile ranging from 1.7 to 49.7 mg SiO2/kg bw/d, based on the lowest minimum and highest maximum values from these six age groups) (EFSA ANS Panel et al. Citation2018).
In biological samples, including food, often total-Si is measured rather than SiO2 particles. Part of the detected Si in food could result from other sources than added E 551. Si can be also present in food originating from other additives such as silicate particles (e.g. E 552). And Si can also be naturally present in food in the form of orthosilicic acid, SiO2 (quartz or diatomaceous earth, also called kieselguhr), and silicates. Higher levels of naturally present Si are found in plant-based foods compared to foods of animal origin (Sadowska and Świderski Citation2020). Major sources of naturally present Si in the diet are cereals, such as barley, oats, wheat, and rice, which contain up to 425 mg Si/100 g (Jugdaohsingh et al. Citation2002; Pennington Citation1991; Powell et al. Citation2005; Prescha, Zabłocka-Słowińska, and Grajeta Citation2019; Robberecht et al. Citation2008). Fruits and vegetables vary in Si content, with higher amount in green beans (raw up to 44 mg Si/100 g), bananas (4.8–6.2 mg Si/100 g) and raisins (10–14 mg Si/100 g) (Jugdaohsingh et al. Citation2002; Pennington Citation1991; Powell et al. Citation2005; Prescha, Zabłocka-Słowińska, and Grajeta Citation2019; Robberecht et al. Citation2008). Also alcoholic beverages, especially beer, contribute with a considerable Si content (1–6 mg/100 ml) (Jugdaohsingh et al. Citation2002; Pennington Citation1991; Powell et al. Citation2005; Prescha, Zabłocka-Słowińska, and Grajeta Citation2019; Robberecht et al. Citation2008). Drinking water (0.02–1.5 mg/100 ml) may also be an important source of Si (i.e. as orthosilicic acid), because of its daily consumption and wide spread use in other dietary products. Overall, cereals seem to be the major source of naturally present Si intake via food, followed by vegetables, (dried) fruits, beverages and nuts (Sadowska and Świderski Citation2020).
Altogether, the Si intake may originate from both naturally present Si and SiO2 particles, as well as Si-containing particles added to products, including SAS (E 551) and silicates (such as E 552). It is unknown to what extent these sources contribute to the total-Si detected in human tissues. The analysis of total-Si cannot distinguish between natural or added Si, and for most Si-containing food products, the Si characteristics such as its form (soluble or particulate) and the particle size are not analyzed. In addition it should be noted that the Si-containing chemical substances potentially differ with regard to their kinetics leading to differences in absorption, distribution and subsequently in the contribution to the Si detected in specific organs.
Roughly estimated, the exposure of Si-containing chemical substances via the diet will be one order of magnitude higher than the exposure via soil, based on an ingestion of 0.7 mg SiO2/kg bw/d for soil for adults. Hence, food is considered the major source of Si-particles in human tissues. The average-to-worst-case dietary intake estimate of 9.4 mg SAS/kg bw/d will result in a daily intake of 562 mg SAS in a 60 kg individual. This is more or less in the same order of magnitude as the daily intake of naturally present Si, based on the content reported for the food products above, and plausible daily intake of such products.
Although only 10% of the total-Si concentrations in human tissue can be explained by the measured concentrations of Si-particles, it is likely that the detection excluded larger aggregates/agglomerates and is therefore an underestimation (Peters et al. Citation2020). Overall, taken into account the estimated dietary intake values of SAS, and the assumption that a large part of the Si measured in human tissue are particles, it is plausible that at least a considerable part of the Si-particles present in human tissues originates from the consumption of food, toothpaste and/or medicines to which SAS is added
Comparing Si concentrations in human and animal tissues and the relation between Si concentrations and effects
A comparison between the reported tissue concentrations in animal studies and the Si concentrations detected in human postmortem studies was performed. Aspects that might play a role and affect the differences in outcome between the animal studies are discussed in the discussion section. In case the reported Si concentrations in animal tissues are accompanied by adverse effects, these are mentioned, although these cannot be directly translated to the human situation. It should also be kept in mind that it remains unknown to which extent the total-Si concentrations detected in the human postmortem tissues originate from SAS. The apparent total-Si background in control animals of toxicity studies should also be present in the SAS-exposed animals. However, sample preparation and analytical techniques could also have contributed to the apparent total-Si background detected. This contributes to the uncertainty in the internal concentration resulting from exposure, and the toxicological effects that can be regarded as a result. This should be kept in mind when comparing total-Si concentrations in tissues between different studies and the relationship between these concentrations and effects.
Liver
The total-Si concentrations detected in human liver (3.2–26 mg Si/kg) fall within the range of reported apparent background values (0.1–44 mg Si/kg) detected in the animal studies (, ). It cannot be excluded that the higher background levels in the animal studies, e.g. by Hu et al. (Citation2019) and van der Zande et al. (Citation2014), could be the result of the presence of Si or SiO2 in the animal feed, however, by both experimental procedures and analytical techniques can also be a cause. At least Tassinari et al. (Citation2020) used a diet with a relatively low silica content in order to reduce the background level, apparently with success, as the reported background level in tissues was very limited ().
Figure 1. Concentration ranges of total-Si in liver and spleen as found in control animals from different toxicity studies (‘liver background’), in exposed animals from different toxicity studies differentiated in positive (‘adverse effect’) and negative effect levels (‘no effect’), or in human postmortem tissues (‘human background’) based on information listed in . Note that tissue concentrations reported by van der Zande et al. (Citation2014) have been converted from SiO2 to Si, and in case values were < LOD this has been indicate by an open bullet or square.
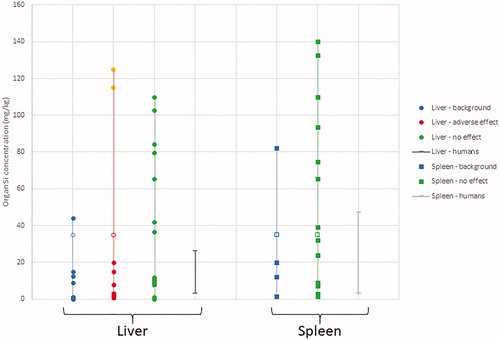
The mean total-Si level detected in human liver (7.8 mg/kg) is similar to the reported significantly increased level of ∼3.2 mg/kg in female rats accompanied by congestion of sinusoids (Tassinari et al. Citation2020). It should be noted that the dose-related enlarged sinusoids in male rats found by Tassinari et al. (Citation2020) were not accompanied by significantly increased Si concentrations in the liver. The mean total-Si level detected in human liver is also similar to the ∼8 mg/kg liver in mice which was accompanied by inflammation accompanied by amyloidosis in perivascular regions in liver (Boudard et al. Citation2019; Boudard et al. Citation2020). These liver concentrations where found in animals after a (sub)chronic exposure to only about 5 mg/kg bw/d of specific, SAS particles (pyrogenic and precipitated NPs, respectively), which are compliant with E 551 specifications. Note that a dose of 5 mg/kg bw/d is a very realistic daily intake level, as it is a factor 2 lower than the estimated average-to-worst-case daily dietary intake of 9.4 mg SAS/kg bw/d for adults (Dekkers et al. Citation2011).
In two other studies effects are only seen at internal concentrations that are much higher than the Si concentrations detected in human livers: Hu et al. (Citation2019) and van der Zande et al. (Citation2014). Hu et al. (Citation2019) demonstrated significantly increased liver concentrations up to ∼115–125 mg/kg after exposure to 100 mg/kg bw/d pyrogenic or colloidal SiO2 NPs (but not by SiO2 MPs). These increased concentrations were associated with serum and liver biomarkers or gene expression changes related to ROS generation associated with ER stress. Hu et al. (Citation2019) did not investigate histopathology in liver. Van der Zande et al. (Citation2014) found an induction of fibrosis in the liver after 84 days of dietary exposure to 1000 mg/kg bw/d specific pyrogenic SiO2 NPs (NM-202), but SiO2 liver concentrations were below the LOD (<75 mg SiO2/kg). In the 28-day study by van der Zande et al. (Citation2014), however, significantly increased liver concentrations of ∼220 and ∼235 mg SiO2/kg were reported after exposure to 100 and 500 mg/kg bw/d pyrogenic SiO2 NPs, respectively, but not after exposure to 1000 mg/kg bw/d (van der Zande et al. Citation2014). Therefore, no consistent view can be derived from the multiple studies on whether adverse liver effects are induced by SAS, or at which external dose level or internal concentration liver effects are induced.
Spleen
The total-Si concentrations detected in human spleen (3.0–47 mg Si/kg) also fall within the range of reported apparent background values (1.4–81 mg Si/kg) detected in control animals (, ). The significantly increased concentrations of ∼2.9 mg Si/kg spleen found by Tassinari et al. (Citation2020) in female rats after 90-day exposure to the highest dose of 50 mg/kg bw/d pyrogenic SiO2 NPs was not accompanied with any histopathological changes in the spleen. At other, lower doses in both females and males, histomorphological changes (changes in red/white pulp ratio) were noted, without significantly increased Si concentrations in spleen (and therefore indicated as negative in ). The lack of a clear trend led the authors to postulate there can be an inhomogeneous distribution of SAS in spleen, leading to local adverse effects not matching the Si concentration (Tassinari et al. Citation2020). Dose-dependent, significantly increased spleen concentrations from ∼30 mg/kg up to ∼170 mg/kg were detected by Hu et al. (Citation2019) as a result of 18 months exposure to 25 mg/kg bw/d up to 200 mg kw/bw/d pyrogenic SiO2 NPs. In that study no histopathology was performed, and no spleen specific biomarkers were studied. Van der Zande et al. (Citation2014) only reported a significantly increased concentrations of 284 mg SiO2/kg (corresponding with ∼131 mg Si/kg) in spleen after 84-day dietary exposure to 2500 mg/kg bw/d pyrogenic SAS (Aerosil 380). However, no histopathological differences between the treated animals and the controls were found. Hence, despite unclarity about the relationship between external dose level and internal spleen concentration of Si, there are no indications for (adverse) effects on the spleen.
Kidney
The reported apparent background concentrations in kidney ranged from 0.7 mg Si/kg (Yun et al. Citation2015) up to 100 mg SiO2/kg (corresponding with ∼46 mg Si/kg) in the 28-day study by van der Zande et al. (Citation2014) (Table S2 in the Supplementary Information). This means that the total-Si concentrations detected in human kidney (4.4–21 mg Si/kg) fall within the reported apparent background levels found in the animal studies. Nevertheless, the mean human kidney concentration of 8.2 mg/kg is higher than the significantly increased kidney concentration of ∼5.5 mg/kg reported in mice after exposure to 4.8 mg precipitated SiO2 NPs for 18 months through drinking water (Boudard et al. Citation2019). This exposure was accompanied with inflammation and vacuolization of tubular epithelial cells. Dose-dependent, significantly increased kidney concentrations from ∼40 mg/kg up to ∼250 mg/kg were detected by Hu et al. (Citation2019) as a result of 18 months exposure to 25 to 200 mg/kg bw/d pyrogenic SiO2 NPs. However, in that study no histopathology was performed, and no kidney specific biomarkers were studied. The single study by Boudard et al. (Citation2019) indicates that chronic exposure to a low dose of SAS could result in adverse renal effects at a lower effect concentration in kidney than the mean concentration found in postmortem human kidneys. However, in general, no adverse effects on the kidney as a result of (sub)chronic oral exposure to SAS have been reported.
Intestinal tissue
Of all human tissues studied, the highest concentrations of total-Si were detected in human intestinal tissues (5.2–191 mg/kg) (). Note that it cannot be excluded that a part of the Si reported in intestinal tissues could be present in the outer mucus layer, and is not absorbed in the intestinal cells (Frey et al. Citation2019). The two regions analyzed, ileum and jejunum, contain Peyer’s patches, a gut associated lymphoid tissue where M-cells are located. M-cells are held responsible for the uptake of particles in the gut, in addition to endocytosis of smaller particles by enterocytes throughout the intestine (Frey et al. Citation2019; Powell et al. Citation2010). As mentioned before, the total-Si ingested orally can partly originate from other sources than SAS, including from other Si-particles (silicates, e.g. E 552). It has to be noted that Powell et al. (Citation1996) detected a relative large number of different silicate particles in the gut associated lymphoid tissue (Powell et al. Citation1996).
In (sub)chronic animal studies, total-Si concentrations were only determined in the (sub)chronic studies by Tassinari et al. (Citation2020) and Hu et al. (Citation2019) (Table S2 in the Supplementary Information). Even though an increase in Si content was noticed by Tassinari et al. (Citation2020), no significantly increased Si concentrations were detected in the small intestine as a result of 90 days exposure to pyrogenic silica NPs compared to the control (∼1.4 mg/kg), nor any histopathological changes in the intestinal tissue. Much higher, dose-responsive, significantly increased concentrations from ∼120 mg/kg up to ∼330 mg/kg were detected by Hu et al. (Citation2019) as a result of 18 months exposure to 25 mg/kg bw/d up to 200 mg kw/bw/d pyrogenic SiO2 NPs. Unfortunately, no histopathology was performed in that study, nor other effects on the intestinal tissue were studied. Therefore, there is only very limited data from animal studies to which the total-Si detected in human intestinal tissues can be compared.
Discussion
We reviewed recent oral toxicity studies with SAS, including studies reporting tissue concentrations of Si. The results of these studies were compared with recently detected tissue concentrations of Si (and Si-particles) in human postmortem tissues. In addition to effects on the liver, oral exposure to SAS has been associated with other adverse effects and health syndromes. These include local effects on the intestine, inflammatory bowel diseases, effects on the immune system, and effects associated with microbiome alterations (Gmoshinski et al. Citation2020; Lamas, Martins Breyner, and Houdeau Citation2020; Siemer et al. Citation2018; Winkler, Suter, and Naegeli Citation2016; Yan et al. Citation2020), and effects on kidney (Boudard et al. Citation2019). In the current paper, we focused mainly on hepatotoxic effects, as multiple studies indicated liver as critical target organ.
Comparing Si concentrations in human liver and spleen with previously modeled values
In our previous work, we tried to compare Si/SiO2 concentrations in human tissues due to dietary intake with internal effect concentrations as obtained from animal studies. By using kinetic modeling, the estimated daily dietary intake of 9.4 mg SAS/kg bw/d by Dekkers et al. (Citation2011) was extrapolated to an internal organ concentration resulting in a modeled steady state concentration in humans of 21–23 mg Si/kg liver and 15–71 mg Si/kg spleen (van Kesteren et al. Citation2015). The modeled internal concentration was a major uncertainty in the previous performed risk assessment (van Kesteren et al. Citation2015). Dietary SAS intake was a rough estimate and the human oral absorption at relevant dietary conditions was uncertain because absorption appeared to be dose-proportional and absorption data were only available for rats. Further, extrapolation of the kinetic behavior of SAS between species (rats, mice and humans) was based on default allometric scaling although it is unclear if such scaling is applicable for nanomaterials. In addition, different SAS (e.g. pyrogenic or precipitated, or with regard to particle size) can differ in kinetics, and the consequent effect on internal concentration (e.g. in liver) is unknown. With the recent information on actual concentration in human liver and spleen these assumptions are overtaken. The new postmortem liver concentrations (Peters et al. Citation2020) allowed us to compare actually measured internal Si concentrations in human livers with the measured liver Si concentration in the rat toxicity study that resulted in mild liver fibrosis by van der Zande et al. (Citation2014), the toxicological endpoint in our previous risk assessment.
The measured human liver concentrations (3.2–26 mg Si/kg liver) are a bit lower than the earlier modeled liver concentrations of 21–23 mg Si/kg liver by van Kesteren et al. (Citation2015). Also, the measured human spleen concentration (3.0–47 mg Si/kg spleen) was lower than the modeled spleen concentrations of 15–71 mg Si/kg spleen. However, one should take into account that part of the Si detected in the human tissues may result from other sources than exposure to SAS, such as silicates. Although the present information is not sufficient for good comparison of the kinetic model with the human liver or spleen concentration (due to e.g. the limited number of individuals measured and knowledge on their intake behavior), the present data suggest that modeling of toxicokinetic behavior of nanomaterials extrapolated from the toxicokinetic behavior between species somewhat overestimated the actual internal organ concentrations.
Current issues complicating risk assessment of SAS
Since our earlier risk assessment, several new oral toxicity studies appeared (), of which some also analyzed tissue concentrations, including of liver and spleen. As described earlier, and illustrated in , the available studies do not provide a consistent view on whether adverse effects are induced by SAS, or at which external dose level this is induced. In most studies with shorter exposure periods, i.e. subacute studies, adverse effects were absent. Half of the six new (sub)chronic studies did not report effects as a result of high exposure to SAS, while some others report (adverse) histopathological changes in liver (and kidney) or generation of ROS as a result of relatively low SAS exposure.
It is generally acknowledged that repeated doses over longer exposure periods (longer than subacute toxicity studies of 28-days) are needed to cause SAS-induced toxicity in animal studies. However, the differences in the outcomes of (sub)chronic studies illustrate that there is still a lot of uncertainty on the risk assessment of SAS. According to EFSA, one of the approaches to reduce the limitations in chronic toxicity data is to conduct a chronic exposure study according to a recognized guideline and with an adequately characterized material representative of SAS used as a food additive E 551, in which some toxicokinetic assessment is included (EFSA ANS Panel et al. Citation2018). Although some of the existing studies more or less followed this line, these studies raised concerns on the relationship between external dose level, internal tissue concentrations and effects.
Most of the new (sub)chronic studies include measurements of Si tissue concentrations (). Overall, these studies demonstrate a wide range of reported total-Si concentrations in tissues in control animals (, ). The human postmortem tissue concentrations fall within the range of control values reported. This hampers the risk assessment as there is no clear relationship between tissue concentration and effect. Furthermore, within the individual animal studies, at least one study shows a clear dose-dependent increase of SAS in tissues (Hu et al. Citation2019), while results by others give the impression as if SAS exposure does not cause dose-dependent, elevated tissue concentrations. In addition, some studies report (adverse) effects without increased tissue concentrations, while others report increased tissue concentrations not accompanied by effects. Altogether, the relationship between SAS used, external dose, internal tissue concentration and toxicological effect is not clear. Due to the inconsistencies in the present data regarding toxicity and reported tissue concentrations, the performance of an adequate risk assessment is not possible. In addition to general issues (such as study setup and quality, test species used, endpoints studied), a number of factors that may influence studies on the relationship between external exposure, internal tissue concentration and effects are discussed below. These could help to explain the inconsistencies found.
Background exposure to Si and Si-Particles
The wide range of reported total-Si concentrations in tissues in control animals can be explained by variations in background levels of Si, caused by differences in animal diet and/or by differences in sample preparation and analytical techniques between studies (Aureli et al. Citation2020).
Animal feed can contain a naturally background of Si-containing chemical substances, but also feed additives may contribute to the presence of Si-particles. Total-Si analysis cannot differentiate between the various forms. The potential presence of Si-particles in the background in feed means that the background could already contribute to toxic effects. Therefore, for both analytical and toxicological reasons, the background of Si and Si-particles in animal feed should be kept as low as possible, i.e. by using a diet with an as low as possible naturally present Si background, and devoid of Si-containing additives. In toxicological studies the composition of animal feed should be better reported (including analysis). The origin of total-Si in the background levels of control animals should be further studied. To be able to connect the effect concentrations in animal studies with the human situation, this also counts for the origin of the total-Si and Si-particles present in human tissues.
Analytical issues
The analysis of total-Si is challenging. Also labware and analytical equipment are a potential source of Si in measurements. In addition, for total-Si measurements by ICP-MS there are severe spectral interferences affecting the accuracy of analytical determinations unless specific methodologies are used. As a result, differences in both experimental procedures, including sample preparation and analytical techniques, are a potential cause of differences in the reported total-Si values hampering the comparison between different studies. Therefore, attention should be paid to the quality and validity of the sample preparation and other analytical procedures, and the trueness of measurements.
Silica used
Different silica particles were used by the toxicity studies listed in , including precipitated, pyrogenic and colloidal SAS, and of different constituent particle sizes, and including different levels of aggregation. These particles originate from different production processes and thereby differ in surface properties and toxicity (Pavan and Fubini Citation2017). Note that colloidal SAS falls outside the specifications of SAS applied as E 551 (EFSA ANS Panel et al. Citation2018; EU Citation2012). There is no published (sub)chronic oral toxicity study which systematically examines differences in toxicity between precipitated and pyrogenic SAS upon oral exposure (as was performed to study genotoxicity (Tarantini et al. Citation2015)). It is also still not clear how the different characteristics of the various SAS used may affect the kinetics and toxicity of SAS. Differences have been observed, hampering direct comparison of risks between different SAS (Isoda et al. Citation2011; van Kesteren et al. Citation2015). Based on those differences it is assumed that pyrogenic SAS causes the highest toxicity (van Kesteren et al. Citation2015). This is strengthened by in vitro studies demonstrating a more pronounced effect for pyrogenic SAS compared to precipitated SAS (Bianchi et al. Citation2020). But surface modification or changes in shape may also affect toxicokinetic behavior and toxicity. Since pyrogenic SAS is allowed to be applied in food, though it is unknown to which extent this actually occurs, the toxicity information of pyrogenic SAS is considered most relevant for risk assessment of the application of SAS in food. Note that of the (sub)chronic and sub-acute toxicity studies only van der Zande et al. (Citation2014), Hu et al. (Citation2019) and Tassinari et al. (Citation2020) applied pyrogenic SAS, and all reported adverse effects as a result of this exposure, albeit under specific conditions ().
Differences in SAS-induced toxicity also include differences in constituent particle size and degree of aggregation/agglomeration. Regarding particle size, of all the studies in , this is illustrated in the study by Hu et al. (Citation2019), where ROS generation associated with ER stress was increased after exposure to pyrogenic or colloidal SAS NPs, but no such effects were observed upon exposure to the larger pyrogenic or colloidal SAS MPs. Also van der Zande reported mild liver fibrosis and induced fibrosis-related gene expression as a result of exposure to specific pyrogenic SAS particles (NM-202; constituent particle size: 10–25 nm), while these effects were not significantly changed as a result of exposure (up to a higher dose) to smaller pyrogenic SAS particles (Aerosil 380; constituent particle size: 7 nm).
In many studies, including several of the recent toxicity studies, the SAS used is poorly characterized (Murugadoss et al. Citation2017). In some cases it is not even clear whether the SAS used is food grade. Physicochemical properties of SAS used should be clearly described, to allow conclusions to be drawn on the SAS induced toxicity, and to aid the risk assessment of SAS used as food additive.
Dosing regimen and dispersion
It seems that animal toxicity studies in which low dose levels of SAS are administered, are often those reporting effects, while those administering high dose levels are mostly negative (). Apart from these apparent differences between high and low dosed studies, it is also remarkable that the two (sub)chronic studies using other dosing regimens than by oral gavage, i.e. via the diet (van der Zande et al. Citation2014) or via drinking water (Boudard et al. Citation2019), both report adverse effects as a result of exposure to SAS, in contrast to all negative (sub)chronic studies that were dosed by oral gavage (). Note that also a short-term (30-day), dietary exposed study was negative (Kim et al. Citation2017), and also (sub)chronic studies using oral gavage report (adverse) effects, i.e. Hu et al. (Citation2019) and Tassinari et al. (Citation2020) which showed ROS generation associated with ER stress, and several histopathological effects, respectively. Presence of a feed matrix could lead to differences in the agglomeration and/or deagglomeration in the gastrointestinal tract, and also result in interactions with food constituents. This may affect the contact with and uptake by the intestinal barrier. Administration via feed, or drinking water for that matter, also leads to a more gradually, prolonged exposure of SAS and different kinetics as compared to a daily administration of a bolus during oral gavage.
For titanium dioxide (TiO2) we recently postulated that high dose levels could negatively affect the uptake and subsequent effects (Brand et al. Citation2020). We also postulated administration via the diet could negatively affect the uptake of TiO2, in contrast to the impression given by SAS in the present study. Still, matrix-effects could exist for silica, for example due to gel formation at higher concentrations, and have been suggested earlier (van der Zande et al. Citation2014). We are not aware of studies systematically comparing different administration dosing regimens for SAS. A recent study by Rodríguez-Escamilla et al. (Citation2019) reported toxicological effects on testis in mice after 10 week exposure to TiO2, comparing oral gavage of a suspension in water (5 mg/kg bw/d) with much higher exposures levels through feed pellets (equivalent to 102, 682 or 1379 mg/kg bw/d). The study found effects through oral gavage similar to up to a 260 times higher dose through pelleted feed, illustrating the importance of the dosing regimen (Rodríguez-Escamilla et al. Citation2019). Unfortunately, the study did not take biokinetics of tissue distribution into account.
Interactions with the (feed) matrix could affect the uptake and subsequent effects of SAS, for example through protein corona formation or attachment to food constituents. But SAS can also interact with itself, especially in watery solutions used for oral gavage, in which SAS particles can agglomerate. The degree of agglomeration can decrease the oral uptake, and therefore it is important that SAS is dispersed well. Within the NANOGENOTOX project, a dispersion protocol has been developed in order to harmonize the method and to prevent unreliable results due to erroneous dispersions (Jensen et al. Citation2011). Of the (sub)chronic studies, Boudard et al. (Citation2019) and Tassinari et al. (Citation2020), reporting effects at low doses, use this NANOGENOTOX protocol specifically. Also other studies at least disperse the SAS by sonication, and analyze the hydrodynamic diameter of the SAS in suspension to examine the dispersion quality, while some other studies are questionable in this respect, e.g. the study by Y. R. Kim et al. (Citation2014) (). Note that in the study by Liang et al. (Citation2018) the 1088 nm precipitated SAS MPs studied were not well dispersed, as they settled and their hydrodynamic size could not be determined (). It is believed the degree of agglomeration may increase at higher doses, which might explain why studies at high doses fail to find effects.
Therefore, the dosing regime, including the effects of administration by oral gavage versus via feed or drinking water, but also dose level (i.e. magnitude of exposure), and the dispersion of the testing material before administration could affect the physicochemical properties of the SAS particles in the gastro-intestinal tract. Subsequently, this can have an effect on the toxicokinetics and SAS-induced toxicity. Attention is also drawn to these aspects in the public consultation on the draft EFSA Guidance on technical requirements for regulated food and feed product applications to establish the presence of small particles including NPs (EFSA Scientific Committee et al. Citation2020).
Mode of action
For a long time, oral exposure to food-grade SAS has been considered safe as it was assumed that its bioavailability was neglectable and toxicity studies in which high doses were applied were usually negative (Fruijtier-Pölloth Citation2016). The induction of mild liver (periportal) fibrosis and induced gene expression in fibrosis-related gene sets as a result of subchronic exposure to a pyrogenic SAS, as demonstrated by van der Zande et al. (Citation2014) was therefore received critically. However, recently also other studies demonstrated adverse effects on the liver, already at low doses of exposure, including liver inflammation and lesions, i.e. perivascular amyloid accumulation, but also congestion of sinusoids, focal intralobular necrosis, hepatocyte vacuolization/steatosis, and indications of fibrosis (collagen deposition and increased mRNA levels indicative of apoptosis) (Boudard et al. Citation2019; Li et al. Citation2018; Tassinari et al. Citation2020). Although the toxicity data are inconsistent regarding their outcome, and contradictory studies exist (), those studies demonstrate that liver effects due to oral exposure to SAS cannot be excluded. Also the study by Hu et al. (Citation2019) adds to this weight of evidence. Though the study was not directed at liver toxicity (and therefore histopathology was not performed), ROS generation in serum and liver was studied weekly within the 90-day study in which mice were exposure to 4 different SAS (including two types of NPs; unclear whether food-grade) at 100 mg/kg bw/d. Pyrogenic SAS NPs (tested at 100 mg/kg bw/d) affected serum and liver biomarkers indicative of liver ROS after 7 weeks of exposure. This was combined with the altered expression of genes associated with ROS production and ER stress in liver, an effect also seen as a result of exposure to colloidal SAS NPs (Hu et al. Citation2019).
Chronically increased ROS could result in irreversible adverse effects, including liver fibrosis (Brand et al. Citation2020; Cichoż-Lach and Michalak Citation2014; Richter and Kietzmann Citation2016; Yu et al. Citation2020). Liver fibrosis is driven by ongoing liver injury and goes through several stages ultimately resulting in irreversible damage. This process starts with inflammation, which can be triggered by ROS generation, and continues with increased production of the extracellular matrix, and subsequently the formation of fibrotic material. Although, most of the histopathological findings in the positive studies in do not demonstrate a definitive, irreversible adverse outcome such as liver fibrosis (or any effects at all), these findings can potentially progress to liver fibrosis due to further prolonged exposure. However, the exact mechanism of hepatic toxicity caused by SAS is unknown and a topic of present research (Kermanizadeh, Powell, and Stone Citation2020; Medina-Reyes et al. Citation2020; Murugadoss et al. Citation2017; Qi et al. Citation2020). Yet, as SAS is present in many everyday products, humans will be exposed to SAS on a daily basis over a prolonged period. This indicates that effects on liver cannot be excluded and further studies to the safety and effects resulting from chronic, oral exposure to food-grade SAS are warranted.
Conclusions and recommendations
There are many studies examining the toxicity of SAS upon oral exposure. Recently, several studies were published with analysis of internal tissue concentrations. However, inconsistencies and differences in the findings from these studies, both with regard to toxicity as well as to internal tissue concentrations hamper the performance of an adequate risk assessment. More specifically, the Si concentration found in human postmortem tissues falls within the broad range of background concentrations as reported in control animals in different toxicity studies. At the same time, the mean concentration found in human postmortem liver is higher than the concentrations causing liver effects in some animal toxicity studies after oral exposure to SAS. However, also higher liver concentrations are observed in other, negative animal studies. These inconsistencies could be explained by the following factors:
the origin of the background Si-concentration in animal tissues in toxicity studies, the origin of the liver Si and Si-particle concentrations in humans, and the contribution of SAS in these concentrations. This includes differences in experimental procedures, including sample preparation and analytical techniques, which are an additional potential source of background Si-concentrations and could affect the validity of the measurements;
differences due to the SAS used (pyrogenic, precipitated or colloidal SAS) as well as its particle size and level of aggregation; and
the dosing regime, which includes the way of administration (dietary or via drinking water vs oral gavage), dispersion and dose.
For human risk assessment of SAS upon oral exposure, more information about all these factors is needed to address the observed inconsistencies regarding toxicity and reported tissue concentrations. The following recommendations for future studies to progress research on the toxicity of SAS and the associated risk assessment should be considered:
to perform long-term, i.e. subchronic or chronic studies, better representing human, life-long exposure to SAS;
to use an animal diet low in Si, devoid of Si-containing additives, to minimize background exposure as much as possible for both analytical as well as toxicological reasons. It is advisable to analyze the background Si in feed;
to study the origin of the presence of Si (and Si-particles) in humans;
to assure the quality and validity of the analytical methods used in order to achieve an appropriate LOD and to avoid unnecessary contribution by the experimental procedures to the Si background;
to use low SAS doses representative of realistic human exposure, as well as high SAS doses to increase chances to find adverse effects;
to systematically study differences between SAS being used;
to thoroughly characterize the physicochemical properties of the SAS being used, both with regard to the pristine material as well as in the matrix provided to the animals, considering physicochemical properties as found in food products, using different techniques, and to use proper dispersions;
to systematically study different SAS, and to use SAS close to the specifications of E 551. A (sub)chronic toxicity study, for instance, comparing pyrogenic and precipitated SAS, both allowed as food additive, is presently absent. There are indications that pyrogenic SAS is more toxic than precipitated SAS, and therefore this should be taken into consideration in the risk assessment of SAS in food;
to perform studies comparing dietary exposure with oral gavage and/or exposure via drinking water to be able to draw conclusions on the effect of different methods of administration;
to perform studies on the toxicokinetics of SAS after oral exposure, with validated analytical techniques, which could contribute to the interpretation of toxicity data; and
finally, it is recommended to always include the determination of tissue concentrations in toxicity studies to clarify the relationship between external exposure, internal tissue concentration and potential toxicological effect in key organs. When feasible Si-particle determination in tissues is recommended.
The presence of particles in human tissues confirms that the present ADI being ‘not specified’, is not sufficient – as noted by EFSA in 2018 (EFSA ANS Panel et al. Citation2018). Although several toxicity studies with SAS are negative, other studies observed (adverse) effects as a result of oral exposure to food-grade SAS at doses below the estimated daily intake for humans from food, and/or at liver concentrations similar to those found in humans.
Altogether, this indicates that there are a lot of uncertainties and inconsistencies associated to the oral risk assessment of SAS. Yet, because different studies show effects at low external dose levels and at tissue concentrations that also occur in humans, a human health risk as a result of oral exposure to SAS presently cannot be excluded. The current review structured the available information and discussed the potential causes of these uncertainties and inconsistencies regarding toxicity and reported tissue concentrations. It thereby aimed to progress research on SAS in a focused manner, to feed into international agreement on a scientifically based acceptable daily intake (ADI).
TNAN-2021-RA-0028-File003.docx
Download MS Word (242.5 KB)Acknowledgments
The authors thank Jacqueline Castenmiller of the Netherlands Food and Consumer Product Safety Authority (NVWA-BuRO) for support and fruitful discussions. Joke Herremans, Corinne Sprong and Susan Wijnhoven (all from RIVM) are acknowledged for their useful comments on the paper. In addition, the authors thank the reviewers for their valuable comments and constructive criticism in order to improve the manuscript.
Disclosure statement
The authors declare that they have no competing interests.
References
- Athinarayanan, J., A. A. Alshatwi, V. S. Periasamy, and A. A. Al-Warthan. 2015. “Identification of Nanoscale Ingredients in Commercial Food Products and Their Induction of Mitochondrially Mediated Cytotoxic Effects on Human Mesenchymal Stem Cells.” Journal of Food Science 80 (2): N459–464. doi:10.1111/1750-3841.12760.
- Aureli, Federica, Maria Ciprotti, Marilena D’Amato, Emanueli do Nascimento da Silva, Stefano Nisi, Daniele Passeri, Angela Sorbo, Andrea Raggi, Marco Rossi, and Francesco Cubadda. 2020. “Determination of Total Silicon and SiO2 Particles Using an ICP-MS Based Analytical Platform for Toxicokinetic Studies of Synthetic Amorphous Silica.” Nanomaterials 10 (5): 888. doi:10.3390/nano10050888.
- Aureli, Federica, Marilena D'Amato, Andrea Raggi, and Francesco Cubadda. 2015. “Quantitative Characterization of Silica Nanoparticles by Asymmetric Flow Field Flow Fractionation Coupled with Online Multiangle Light Scattering and ICP-MS/MS Detection.” Journal of Analytical Atomic Spectrometry 30 (6): 1266–1273. doi:10.1039/C4JA00478G.
- Bhagia, L. J. 2012. “Non-Occupational Exposure Limit to Silica Dust.” Indian Journal of Occupational and Environmental Medicine 16 (3): 95–100. doi:10.4103/0019-5278.111744.
- Bianchi, M. G., M. Chiu, G. Taurino, R. Ruotolo, N. Marmiroli, E. Bergamaschi, F. Cubadda, and O. Bussolati. 2020. “Pyrogenic and Precipitated Amorphous Silica Nanoparticles Differentially Affect Cell Responses to LPS in Human Macrophages.” Nanomaterials 10 (7): 1395. doi:10.3390/nano10071395.
- Bleeker, E. A., W. H. de Jong, R. E. Geertsma, M. Groenewold, E. H. Heugens, M. Koers-Jacquemijns, D. van de Meent, et al. 2013. “Considerations on the EU Definition of a Nanomaterial: science to Support Policy Making.” Regulatory Toxicology and Pharmacology 65 (1): 119–125. doi:10.1016/j.yrtph.2012.11.007.
- Boudard, D., F. Aureli, B. Laurent, N. Sturm, A. Raggi, E. Antier, L. Lakhdar, et al. 2019. “Chronic Oral Exposure to Synthetic Amorphous Silica (NM-200) Results in Renal and Liver Lesions in Mice.” Kidney International Reports 4 (10): 1463–1471. doi:10.1016/j.ekir.2019.06.007.
- Boudard, D., F. Aureli, B. Laurent, N. Sturm, A. Raggi, E. Antier, L. Lakhdar, et al. 2020. “The Authors Reply.” Kidney International Reports 5 (4): 554–558. doi:10.1016/j.ekir.2019.12.005.
- Brand, W., R. J. B. Peters, H. M. Braakhuis, L. Maślankiewicz, and A. G. Oomen. 2020. “Possible Effects of Titanium Dioxide Particles on Human Liver, Intestinal Tissue, Spleen and Kidney after Oral Exposure.” Nanotoxicology 14 (7): 985–1007. doi:10.1080/17435390.2020.1778809.
- Buesen, R., R. Landsiedel, U. G. Sauer, W. Wohlleben, S. Groeters, V. Strauss, H. Kamp, and B. van Ravenzwaay. 2014. “Effects of SiO2, ZrO2, and BaSO4 Nanomaterials with or without Surface Functionalization upon 28-Day Oral Exposure to Rats.” Archives of Toxicology 88 (10): 1881–1906. doi:10.1007/s00204-014-1337-0.
- Cabellos, J., I. Gimeno-Benito, J. Catalán, H. K. Lindberg, G. Vales, E. Fernandez-Rosas, R. Ghemis, et al. 2020. “Short-Term Oral Administration of Non-Porous and Mesoporous Silica Did Not Induce Local or Systemic Toxicity in Mice.” Nanotoxicology 14 (10): 1324–1341. doi:10.1080/17435390.2020.1818325.
- Chappell, H. F., R. Jugdaohsingh, and J. J. Powell. 2020. “Physiological Silicon Incorporation into Bone Mineral Requires Orthosilicic Acid Metabolism to SiO44.” Journal of the Royal Society, Interface 17 (167): 20200145. doi:10.1098/rsif.2020.0145.
- Cichoż-Lach, H., and A. Michalak. 2014. “Oxidative Stress as a Crucial Factor in Liver Diseases.” World Journal of Gastroenterology 20 (25): 8082–8091. doi:10.3748/wjg.v20.i25.8082.
- Contado, C., J. Mejia, O. Lozano García, J. P. Piret, E. Dumortier, O. Toussaint, and S. Lucas. 2016. “Physicochemical and Toxicological Evaluation of Silica Nanoparticles Suitable for Food and Consumer Products Collected by following the EC Recommendation.” Analytical and Bioanalytical Chemistry 408 (1): 271–286. doi:10.1007/s00216-015-9101-8.
- Contado, C., L. Ravani, and M. Passarella. 2013. “Size Characterization by Sedimentation Field Flow Fractionation of Silica Particles Used as Food Additives.” Analytica Chimica Acta 788: 183–192. doi:10.1016/j.aca.2013.05.056.
- Croissant, J. G., K. S. Butler, J. I. Zink, and C. J. Brinker. 2020. “Synthetic Amorphous Silica Nanoparticles: toxicity, Biomedical and Environmental Implications.” Nature Reviews Materials 5 (12): 886–909. doi:10.1038/s41578-020-0230-0.
- Damsch, S., G. Eichenbaum, A. Tonelli, L. Lammens, K. Van den Bulck, B. Feyen, J. Vandenberghe, A. Megens, E. Knight, and M. Kelley. 2011. “Gavage-Related Reflux in Rats: identification, Pathogenesis, and Toxicological Implications (Review).” Toxicologic Pathology 39 (2): 348–360. doi:10.1177/0192623310388431.
- Davis, B. L., L. R. Johnson, R. K. Stevens, W. J. Courtney, and D. W. Safriet. 1984. “The Quartz Content and Elemental Composition of Aerosols from Selected Sites of the EPA Inhalable Particulate Network.” Atmospheric Environment. 18 (4): 771–782. doi:10.1016/0004-6981(84)90261-0.
- Dekkers, S., H. Bouwmeester, P. M. Bos, R. J. Peters, A. G. Rietveld, and A. G. Oomen. 2013. “Knowledge Gaps in Risk Assessment of Nanosilica in Food: evaluation of the Dissolution and Toxicity of Different Forms of Silica.” Nanotoxicology 7 (4): 367–377. doi:10.3109/17435390.2012.662250.
- Dekkers, S., P. Krystek, R. J. Peters, D. P. Lankveld, B. G. Bokkers, P. H. van Hoeven-Arentzen, H. Bouwmeester, and A. G. Oomen. 2011. “Presence and Risks of Nanosilica in Food Products.” Nanotoxicology 5 (3): 393–405. doi:10.3109/17435390.2010.519836.
- EC 2020. Register of feed additives. Pursuant to regulation (EC) No 1831/2003. Annex I: List of additives. https://ec.europa.eu/food/sites/food/files/safety/docs/animal-feed_additives_eu-register_1831-03.pdf.
- EFSA ANS Panel, Younes, M., P. Aggett, F. Aguilar, R. Crebelli, B. Dusemund, M. Filipič, M. J. Frutos, et al. 2018. “Re-Evaluation of Silicon Dioxide (E 551) as a Food Additive.” EFSA Journal. 16 (1): e05088.
- EFSA Scientific Committee, Hardy, A., D. Benford, T. Halldorsson, M. J. Jeger, H. K. Knutsen, S. More, H. Naegeli, et al. 2018. “Guidance on Risk Assessment of the Application of Nanoscience and Nanotechnologies in the Food and Feed Chain: Part 1, Human and Animal Health.” EFSA Journal. 16 (7): 5327. doi:10.2903/j.efsa.2018.5327.
- EFSA Scientific Committee, More, S., V. Bampidis, D. Benford, C. Bragard, T. Halldorsson, A. Hernández-Jerez, S. H. Bennekou, et al. 2020. Public consultation on the draft EFSA Guidance on technical requirements for regulated food and feed product applications to establish the presence of small particles including nanoparticles. https://www.efsa.europa.eu/en/consultations/call/public-consultation-draft-efsa-guidance-technical-requirements.
- EU 2011. Commission recommendation of 18 October 2011 on the definition of nanomaterial (2011/696/EU).
- EU 2012. Commission Regulation (EU) No 231/2012 of 9 March 2012 laying down specifications for food additives listed in Annexes II and III to Regulation (EC) No 1333/2008 of the European Parliament and of the Council.
- Frey, A., K. Ramaker, N. Röckendorf, B. Wollenberg, I. Lautenschläger, G. Gébel, A. Giemsa, M. Heine, D. Bargheer, and P. Nielsen. 2019. Biological Responses to Nanoscale Particles. Gehr, P. and Zellner, R. (eds), 281–327. Springer Nature, Switzerland.
- Fruijtier-Pölloth, C. 2012. “The Toxicological Mode of Action and the Safety of Synthetic Amorphous Silica-a Nanostructured Material.” Toxicology 294 (2-3): 61–79. doi:10.1016/j.tox.2012.02.001.
- Fruijtier-Pölloth, C. 2016. “The Safety of Nanostructured Synthetic Amorphous Silica (SAS) as a Food Additive (E 551).” Archives of Toxicology 90 (12): 2885–2916. doi:10.1007/s00204-016-1850-4.
- Gmoshinski, I. V., V. A. Shipelin, A. A. Shumakova, E. N. Trushina, O. K. Mustafina, I. V. Safenkova, S. A. Khotimchenko, D. B. Nikityuk, and V. A. Tutelyan. 2020. “Toxicity Evaluation of Nanostructured Silica Orally Administered to Rats: Influence on Immune System Function.” Nanomaterials (Nanomaterials 10 (11): 2126. doi:10.3390/nano10112126.
- Hasezaki, T., K. Isoda, M. Kondoh, Y. Tsutsumi, and K. Yagi. 2011. “Hepatotoxicity of Silica Nanoparticles with a Diameter of 100 nm.” Die Pharmazie 66 (9): 698–703.
- Hassankhani, R., M. Esmaeillou, A. A. Tehrani, K. Nasirzadeh, F. Khadir, and H. Maadi. 2015. “In Vivo Toxicity of Orally Administrated Silicon Dioxide Nanoparticles in Healthy Adult Mice.” Environmental Science and Pollution Research International 22 (2): 1127–1132. doi:10.1007/s11356-014-3413-7.
- Hofmann, T., S. Schneider, A. Wolterbeek, H. van de Sandt, R. Landsiedel, and B. van Ravenzwaay. 2015. “Prenatal Toxicity of Synthetic Amorphous Silica Nanomaterial in Rats.” Reproductive Toxicology (Elmsford, N.Y.) 56: 141–146. doi:10.1016/j.reprotox.2015.04.006.
- Hu, H., X. Fan, Q. Guo, X. Wei, D. Yang, B. Zhang, J. Liu, et al. 2019. “Silicon Dioxide Nanoparticles Induce Insulin Resistance through Endoplasmic Reticulum Stress and Generation of Reactive Oxygen Species.” Particle and Fibre Toxicology 16 (1): 41. doi:10.1186/s12989-019-0327-z.
- Isoda, K., T. Hasezaki, M. Kondoh, Y. Tsutsumi, and K. Yagi. 2011. “Effect of Surface Charge on Nano-Sized Silica Particles-Induced Liver Injury.” Die Pharmazie 66 (4): 278–281.
- Jacobsen, N. R., H. Wallin, W. de Jong, A. Oomen, E. Brandon, P. Krystek, M. Apostolova, et al. 2013. NANOGENOTOX. Deliverable 7: identification of target organs and biodistribution including ADME parameters. https://www.anses.fr/en/content/deliverable-7-identification-taget-organs-and-biodistribution-including-adme-parameters.
- Jensen, K. A., Y. Kembouche, E. Christiansen, N. R. Jacobsen, and H. Wallin. 2011. NANOGENOTOX. Final protocol for producing suitable manufactured nanomaterial exposure media. https://www.anses.fr/en/system/files/nanogenotox_deliverable_5.pdf.
- Jugdaohsingh, R., A. I. E. Watson, L. Pedro, and J. J. Powell. 2015. “The Decrease in Silicon Concentration of the Connective Tissueswith Age in Rats is a Marker of Connective Tissue Turnover.” Bone 75: 40–48. doi:10.1016/j.bone.2015.02.004.
- Jugdaohsingh, R., S. H. Anderson, K. L. Tucker, H. Elliott, D. P. Kiel, R. P. Thompson, and J. J. Powell. 2002. “Dietary Silicon Intake and Absorption.” The American Journal of Clinical Nutrition 75 (5): 887–893. doi:10.1093/ajcn/75.5.887.
- Kermanizadeh, A., L. G. Powell, and V. Stone. 2020. “A Review of Hepatic Nanotoxicology - Summation of Recent Findings and Considerations for the Next Generation of Study Designs.” Journal of Toxicology and Environmental Health. Part B, Critical Reviews 23 (4): 137–176. doi:10.1080/10937404.2020.1751756.
- Kim, K. M., H. M. Kim, M. H. Choi, J. K. Lee, J. Jeong, M. H. Lee, Y. S. Kim, S. M. Paek, and J. M. Oh. 2014. “Colloidal Properties of Surface Coated Colloidal Silica Nanoparticles in Aqueous and Physiological Solutions.” Science of Advanced Materials 6 (7): 1573–1581. doi:10.1166/sam.2014.1837.
- Kim, M., J. H. Park, H. Jeong, J. Hong, W. S. Choi, B. H. Lee, and C. Y. Park. 2017. “An Evaluation of the in Vivo Safety of Nonporous Silica Nanoparticles: Ocular Topical Administration versus Oral Administration.” Scientific Reports 7 (1): 8238. doi:10.1038/s41598-017-08843-9.
- Kim, Y. R., S. Y. Lee, E. J. Lee, S. H. Park, N. W. Seong, H. S. Seo, S. S. Shin, et al. 2014. “Toxicity of Colloidal Silica Nanoparticles Administered Orally for 90 Days in Rats.” Int J Nanomedicine 9 (Suppl 2): 67–78.
- Lamas, B., N. Martins Breyner, and E. Houdeau. 2020. “Impacts of Foodborne Inorganic Nanoparticles on the Gut Microbiota-Immune Axis: potential Consequences for Host Health.” Particle and Fibre Toxicology 17 (1): 19. doi:10.1186/s12989-020-00349-z.
- Landsiedel, R., E. Fabian, L. Ma-Hock, W. Wohlleben, K. Wiench, F. Oesch, and B. van Ravenzwaay. 2012. “Toxico-/Biokinetics of Nanomaterials.” Archives of Toxicology 86 (7): 1021–1060. doi:10.1007/s00204-012-0858-7.
- Lee, J. A., M. K. Kim, H. J. Paek, Y. R. Kim, M. K. Kim, J. K. Lee, J. Jeong, and S. J. Choi. 2014. “Tissue Distribution and Excretion Kinetics of Orally Administered Silica Nanoparticles in Rats.” Int J Nanomedicine 9 (Suppl 2): 251–260.
- Li, J., X. He, Y. Yang, M. Li, C. Xu, and R. Yu. 2018. “Risk Assessment of Silica Nanoparticles on Liver Injury in Metabolic Syndrome Mice Induced by Fructose.” The Science of the Total Environment 628-629: 366–374. doi:10.1016/j.scitotenv.2018.02.047.
- Liang, C. L., Q. Xiang, W. M. Cui, J. Fang, N. N. Sun, X. P. Zhang, Y. N. Li, H. Yang, Z. Yu, and X. D. Jia. 2018. “Subchronic Oral Toxicity of Silica Nanoparticles and Silica Microparticles in Rats.” Biomedical and Environmental Sciences : BES 31 (3): 197–207. doi:10.3967/bes2018.025.
- Lijzen, J. P. A., A. J. Baars, P. F. Otte, M. G. J. Rikken, F. A. Swaertjes, E. M. J. Verbruggen, and A. P. van Wezel. 2001. Technical evaluation of the intervention values for soil/sediment and groundwater. Human and ecotoxicological risk assessment and derivation of risk limits for soil, aquatic sediment and groundwater. RIVM report 711701023 https://www.rivm.nl/bibliotheek/rapporten/711701023.pdf.
- Lim, J. H., P. Sisco, T. K. Mudalige, G. Sánchez-Pomales, P. C. Howard, and S. W. Linder. 2015. “Detection and Characterization of SiO2 and TiO2 Nanostructures in Dietary Supplements.” Journal of Agricultural and Food Chemistry 63 (12): 3144–3152. doi:10.1021/acs.jafc.5b00392.
- Locci, E., I. Pilia, R. Piras, S. Pili, G. Marcias, P. Cocco, F. De Giorgio, et al. 2019. “Particle Background Levels in Human Tissues—PABALIHT Project. Part I: A Nanometallomic Study of Metal-Based Micro- and Nanoparticles in Liver and Kidney in an Italian Population Group.” Journal of Nanoparticle Research 21 (3): 45. doi:10.1007/s11051-019-4480-y.
- Medina-Reyes, E. I., C. Rodríguez-Ibarra, A. Déciga-Alcaraz, D. Díaz-Urbina, Y. I. Chirino, and J. Pedraza-Chaverri. 2020. “Food Additives Containing Nanoparticles Induce Gastrotoxicity, Hepatotoxicity and Alterations in Animal Behavior: The Unknown Role of Oxidative Stress.” Food and Chemical Toxicology. 146: 111814. doi:10.1016/j.fct.2020.111814.
- Murugadoss, S., D. Lison, L. Godderis, S. Van Den Brule, J. Mast, F. Brassinne, N. Sebaihi, and P. H. Hoet. 2017. “Toxicology of Silica Nanoparticles: An Update.” Archives of Toxicology 91 (9): 2967–3010. doi:10.1007/s00204-017-1993-y.
- Murugadoss, S., S. van den Brule, F. Brassinne, N. Sebaihi, J. Mejia, S. Lucas, J. Petry, et al. 2020. “Is Aggregated Synthetic Amorphous Silica Toxicologically Relevant?” Particle and Fibre Toxicology 17 (1): 1. doi:10.1186/s12989-019-0331-3.
- Nishimori, H., M. Kondoh, K. Isoda, S. Tsunoda, Y. Tsutsumi, and K. Yagi. 2009a. “Histological Analysis of 70-nm Silica Particles-Induced Chronic Toxicity in Mice.” European Journal of Pharmaceutics and Biopharmaceutics 72 (3): 626–629. doi:10.1016/j.ejpb.2009.03.007.
- Nishimori, H., M. Kondoh, K. Isoda, S. Tsunoda, Y. Tsutsumi, and K. Yagi. 2009b. “Silica Nanoparticles as Hepatotoxicants.” European Journal of Pharmaceutics and Biopharmaceutics 72 (3): 496–501. doi:10.1016/j.ejpb.2009.02.005.
- Otte, P. F., J. P. A. Lijzen, J. G. Otte, F. A. Swaertjes, and C. W. Versluijs. 2001. Evaluation and revision of the CSOIL parameter set. Proposed parameter set for human exposure modelling and deriving Intervention Values for the first series of compounds. RIVM Rapport 711701021. https://www.rivm.nl/bibliotheek/rapporten/711701021.html.
- Park, J. H., H. Jeong, J. Hong, M. Chang, M. Kim, R. S. Chuck, J. K. Lee, and C. Y. Park. 2016. “The Effect of Silica Nanoparticles on Human Corneal Epithelial Cells.” Scientific Reports 6: 37762. doi:10.1038/srep37762.
- Pavan, C., and B. Fubini. 2017. “Unveiling the Variability of "Quartz Hazard" in Light of Recent Toxicological Findings.” Chemical Research in Toxicology 30 (1): 469–485. doi:10.1021/acs.chemrestox.6b00409.
- Pennington, J. A. 1991. “Silicon in Foods and Diets.” Food Additives and Contaminants 8 (1): 97–118. doi:10.1080/02652039109373959.
- Peters, R. J. B., A. G. Oomen, G. van Bemmel, L. van Vliet, A. K. Undas, S. Munniks, R. Bleys, P. C. Tromp, W. Brand, and M. van der Lee. 2020. “Silicon Dioxide and Titanium Dioxide Particles Found in Human Tissues.” Nanotoxicology 14 (3): 420–432. doi:10.1080/17435390.2020.1718232.
- Peters, R., E. Kramer, A. G. Oomen, Z. E. Rivera, G. Oegema, P. C. Tromp, R. Fokkink, et al. 2012. “Presence of Nano-Sized Silica during in Vitro Digestion of Foods Containing Silica as a Food Additive.” ACS Na 6 (3): 2441–2451. doi:10.1021/nn204728k.
- Peters, R., Z. Herrera-Rivera, A. Undas, M. van der Lee, H. Marvin, H. Bouwmeester, and S. Weigel. 2015. “Single Particle ICP-MS Combined with a Data Evaluation Tool as a Routine Technique for the Analysis of Nanoparticles in Complex Matrices.” Journal of Analytical Atomic Spectrometry 30 (6): 1274–1285. doi:10.1039/C4JA00357H.
- Powell, J. J., C. C. Ainley, R. S. Harvey, I. M. Mason, M. D. Kendall, E. A. Sankey, A. P. Dhillon, and R. P. Thompson. 1996. “Characterisation of Inorganic Microparticles in Pigment Cells of Human Gut Associated Lymphoid Tissue.” Gut 38 (3): 390–395. doi:10.1136/gut.38.3.390.
- Powell, J. J., N. Faria, E. Thomas-McKay, and L. C. Pele. 2010. “Origin and Fate of Dietary Nanoparticles and Microparticles in the Gastrointestinal Tract.” Journal of Autoimmunity 34 (3): J226–233. doi:10.1016/j.jaut.2009.11.006.
- Powell, J. J., S. A. McNaughton, R. Jugdaohsingh, S. H. Anderson, J. Dear, F. Khot, L. Mowatt, et al. 2005. “A Provisional Database for the Silicon Content of Foods in the United Kingdom.” The British Journal of Nutrition 94 (5): 804–812. doi:10.1079/bjn20051542.
- Prescha, A., K. Zabłocka-Słowińska, and H. Grajeta. 2019. “Dietary Silicon and Its Impact on Plasma Silicon Levels in the Polish Population.” Nutrients 11 (5): 980. doi:10.3390/nu11050980.
- Qi, Yi, Ru Ma, Xueyan Li, Songqing Lv, Xiaoying Liu, Alimire Abulikemu, Xinying Zhao, Yanbo Li, Caixia Guo, and Zhiwei Sun. 2020. “Disturbed Mitochondrial Quality Control Involved in Hepatocytotoxicity Induced by Silica Nanoparticles.” Nanoscale 12 (24): 13034–13045. doi:10.1039/d0nr01893g.
- Rasmussen, K., A. Mech, J. Mast, P.-J. De Temmerman, N. Waegeneers, F. Van Steen, J. P. Pizzolon, et al. 2013. Synthetic Amorphous Silicon Dioxide (NM-200, NM-201, NM-202, NM-203, NM-204): Characterisation and Physico-Chemical Properties. JRC Repository: NM-series of Representative Manufactured Nanomaterials. https://op.europa.eu/en/publication-detail/-/publication/7b93921d-e0be-4d73-beae-2061981861b2/language-en.
- Reeves, P. G. 1997. “Components of the AIN-93 Diets as Improvements in the AIN-76A Diet.” The Journal of Nutrition 127 (5 Suppl): 838s–841s. doi:10.1093/jn/127.5.838S.
- Richter, K., and T. Kietzmann. 2016. “Reactive Oxygen Species and Fibrosis: further Evidence of a Significant Liaison.” Cell and Tissue Research 365 (3): 591–605. doi:10.1007/s00441-016-2445-3.
- RIKILT and JRC 2014. Inventory of nanotechnology applications in the agricultural, feed and food sector. EFSA supporting publication 2014:EN-621. https://efsa.onlinelibrary.wiley.com/doi/abs/10.2903/sp.efsa.2014.EN-621.
- Robberecht, H., K. Van Dyck, D. Bosscher, and R. Van Cauwenbergh. 2008. “Silicon in Foods: Content and Bioavailability.” International Journal of Food Properties 11 (3): 638–645. doi:10.1080/10942910701584252.
- Rodríguez-Escamilla, J. C., E. I. Medina-Reyes, C. Rodríguez-Ibarra, A. Déciga-Alcaraz, J. O. Flores-Flores, A. Ganem-Rondero, M. Rodríguez-Sosa, L. I. Terrazas, N. L. Delgado-Buenrostro, and Y. I. Chirino. 2019. “Food-Grade Titanium Dioxide (E171) by Solid or Liquid Matrix Administration Induces Inflammation, Germ Cells Sloughing in Seminiferous Tubules and Blood-Testis Barrier Disruption in Mice.” Journal of Applied Toxicology : JAT 39 (11): 1586–1605. doi:10.1002/jat.3842.
- Ryu, H. J., N. W. Seong, B. J. So, H. S. Seo, J. H. Kim, J. S. Hong, M. K. Park, et al. 2014. “Evaluation of Silica Nanoparticle Toxicity after Topical Exposure for 90 Days.” Int J Nanomedicine 9 (Suppl 2): 127–136.
- Sadowska, A., and F. Świderski. 2020. “Sources, Bioavailability, and Safety of Silicon Derived from Foods and Other Sources Added for Nutritional Purposes in Food Supplements and Functional Foods.” Applied Sciences 10 (18): 6255. doi:10.3390/app10186255.
- SCF 1991. Opinions on the Scientific Committee for Food on: Silicate and silicon dioxide. Reports of the Scientific Committee for Food, Twenty-fifth Series.
- Siemer, S.,. A. Hahlbrock, C. Vallet, D. J. McClements, J. Balszuweit, J. Voskuhl, D. Docter, et al. 2018. “Nanosized Food Additives Impact Beneficial and Pathogenic Bacteria in the Human Gut: A Simulated Gastrointestinal Study.” NPJ Science of Food 2 (1): 22. doi:10.1038/s41538-018-0030-8.
- Sohal, I. S., Y. K. Cho, K. S. O’Fallon, P. Gaines, P. Demokritou, and D. Bello. 2018. “Dissolution Behavior and Biodurability of Ingested Engineered Nanomaterials in the Gastrointestinal Environment.” ACS Nano 12 (8): 8115–8128. doi:10.1021/acsnano.8b02978.
- Tarantini, A., S. Huet, G. Jarry, R. Lanceleur, M. Poul, A. Tavares, N. Vital, H. Louro, M. João Silva, and V. Fessard. 2015. “Genotoxicity of Synthetic Amorphous Silica Nanoparticles in Rats following Short-Term Exposure. Part 1: oral Route.” Environmental and Molecular Mutagenesis 56 (2): 218–227. doi:10.1002/em.21935.
- Tassinari, R., G. Di Felice, C. Butteroni, B. Barletta, S. Corinti, F. Cubadda, F. Aureli, et al. 2020. “Hazard Identification of Pyrogenic Synthetic Amorphous Silica (NM-203) after Sub-Chronic Oral Exposure in Rat: A Multitarget Approach.” Food and Chemical Toxicology. 137: 111168. doi:10.1016/j.fct.2020.111168.
- USEPA 1996. Ambient levels and noncancer health effects of inhaled crystalline and amorphous silica: health issue assessment. EPA/600/R-95/115.
- van der Zande, M., R. J. Vandebriel, M. J. Groot, E. Kramer, Z. E. Herrera Rivera, K. Rasmussen, J. S. Ossenkoppele, et al. 2014. “Sub-Chronic Toxicity Study in Rats Orally Exposed to Nanostructured Silica.” Particle and Fibre Toxicology 11 (1): 8. doi:10.1186/1743-8977-11-8.
- van Kesteren, P. C., F. Cubadda, H. Bouwmeester, J. C. van Eijkeren, S. Dekkers, W. H. de Jong, and A. G. Oomen. 2015. “Novel Insights into the Risk Assessment of the Nanomaterial Synthetic Amorphous Silica, Additive E551, in Food.” Nanotoxicology 9 (4): 442–452. doi:10.3109/17435390.2014.940408.
- Villota, R., J. G. Hawkes, and H. Cochrane. 1986. “Food Applications and the Toxicological and Nutritional Implications of Amorphous Silicon Dioxide.” Critical Reviews in Food Science and Nutrition. 23 (4): 289–321. doi:10.1080/10408398609527428.
- Winkler, H. C., M. Suter, and H. Naegeli. 2016. “Critical Review of the Safety Assessment of Nano-Structured Silica Additives in Food.” Journal of Nanobiotechnology 14 (1): 44. doi:10.1186/s12951-016-0189-6.
- Wolterbeek, A., T. Oosterwijk, S. Schneider, R. Landsiedel, D. de Groot, R. van Ee, M. Wouters, and H. van de Sandt. 2015. “Oral Two-Generation Reproduction Toxicity Study with NM-200 Synthetic Amorphous Silica in Wistar Rats.” Reproductive Toxicology. 56: 147–154. doi:10.1016/j.reprotox.2015.03.006.
- Xie, G., J. Sun, G. Zhong, L. Shi, and D. Zhang. 2010. “Biodistribution and Toxicity of Intravenously Administered Silica Nanoparticles in Mice.” Archives of Toxicology 84 (3): 183–190. doi:10.1007/s00204-009-0488-x.
- Yamashita, K., Y. Yoshioka, K. Higashisaka, K. Mimura, Y. Morishita, M. Nozaki, T. Yoshida, et al. 2011. “Silica and Titanium Dioxide Nanoparticles Cause Pregnancy Complications in Mice.” Nature Nanotechnology 6 (5): 321–328. doi:10.1038/nnano.2011.41.
- Yan, J., D. Wang, K. Li, Q. Chen, W. Lai, L. Tian, B. Lin, Y. Tan, X. Liu, and Z. Xi. 2020. “Toxic Effects of the Food Additives Titanium Dioxide and Silica on the Murine Intestinal Tract: Mechanisms Related to Intestinal Barrier Dysfunction Involved by Gut Microbiota.” Environmental Toxicology and Pharmacology 80: 103485. doi:10.1016/j.etap.2020.103485.
- Yoshida, T., Y. Yoshioka, H. Takahashi, K. Misato, T. Mori, T. Hirai, K. Nagano, et al. 2014. “Intestinal Absorption and Biological Effects of Orally Administered Amorphous Silica Particles.” Nanoscale Research Letters 9 (1): 532. doi:10.1186/1556-276X-9-532.
- Yu, Z., Q. Li, J. Wang, Y. Yu, Y. Wang, Q. Zhou, and P. Li. 2020. “Reactive Oxygen Species-Related Nanoparticle Toxicity in the Biomedical Field.” Nanoscale Research Letters 15 (1): 115. doi:10.1186/s11671-020-03344-7.
- Yun, J. W., S. H. Kim, J. R. You, W. H. Kim, J. J. Jang, S. K. Min, H. C. Kim, et al. 2015. “Comparative Toxicity of Silicon Dioxide, Silver and Iron Oxide Nanoparticles after Repeated Oral Administration to Rats.” Journal of Applied Toxicology 35 (6): 681–693. doi:10.1002/jat.3125.