
Abstract
Rodent studies on the effects of engineered nanomaterials (ENM) on the gut microbiome have revealed contradictory results. Our aim was to assess the effects of four well-investigated model ENM using a realistic exposure scenario. Two independent ad libitum feeding studies were performed. In study 1, female mice from the local breeding facility received feed pellets containing 1% CeO2 or 1% SiO2 for three weeks. In study 2, both female and male mice were purchased and exposed to 0.2% Ag-PVP or 1% TiO2 for four weeks. A next generation 16S rDNA sequencing-based approach was applied to assess impacts on the gut microbiome. None of the ENM had an effect on the α- or β-diversity. A decreased relative abundance of the phylum Actinobacteria was observed in SiO2 exposed mice. In female mice, the relative abundance of the genus Roseburia was increased with Ag exposure. Furthermore, in study 2, a sex-related difference in the β-diversity was observed. A difference in the β-diversity was also shown between the female control mice of the two studies. We did not find major effects on the gut microbiome. This contrast to other studies may be due to variations in the study design. Our investigation underlined the important role of the sex of test animals and their microbiome composition prior to ENM exposure initiation. Hence, standardization of microbiome studies is strongly required to increase comparability. The ENM-specific effects on Actinobacteria and Roseburia, two taxa pivotal for the human gut homeostasis, warrant further research on their relevance for health.
Introduction
With the increasing use of engineered nanomaterials (ENM) in food and food packaging applications, concerns about their potential health effects are growing. In the food industry sector, ENM are employed for various reasons, e.g. as antimicrobial agent or to improve color, flavor, taste and texture of food products (Maynard and Michelson Citation2005; Kessler Citation2011; Bouwmeester et al. Citation2014). Besides, indirect oral exposure to ENM may also arise from their release into the environment (Rico et al. Citation2011; Keller et al. Citation2013). Research into the effects of ingested ENM has long focused on systemic availability, addressed in toxicokinetic studies, as well as on potential toxic effects on the intestinal barrier, addressed in vivo and, increasingly, using advanced in vitro models (Kampfer, Busch, and Schins Citation2020). Only in recent years, awareness and interest have risen concerning possible perturbations of the gut microbiome induced by ENM (Bergin and Witzmann Citation2013; Pietroiusti, Magrini, and Campagnolo Citation2016).
Because of its diverse local and systemic effects, the gut microbiome was deemed the ‘forgotten organ’ by O'hara and Shanahan (Citation2006). In the intestine, the microbiome shapes the mucosal barrier including the functionality of the immune system (Szentkuti et al. Citation1990; Zelante et al. Citation2013). On the local and systemic levels, the microbiome plays a crucial role for the supply of short chain fatty acids (SCFA) and vitamins B and K (Wostmann Citation1981; Koh et al. Citation2016). Moreover, alterations of the human gut microbiome have been linked to various pathologies, such as inflammatory bowel disease, obesity, type II diabetes, and Alzheimer’s disease (Turnbaugh and Gordon Citation2009; Larsen et al. Citation2010; Vogt et al. Citation2017; Lamas et al. Citation2020).
Several rodent studies on the effects of ENM on the gut microbiome have already been performed, as has recently been reviewed for instance by Lamas et al. (Citation2020) and Zhang, Mortimer, and Guo (Citation2020). In many of the studies the ENM were applied via gavage (Hadrup et al. Citation2012; Wilding et al. Citation2016; Williams et al. Citation2015; Chen et al. Citation2017), whereas in other trials the administration with the food or drinking water was preferred as a more physiological way (van den Brule et al. Citation2015; Pinget et al. Citation2019). In those studies, contrasting outcomes have been reported, and the study design, including the method of particle application, has been discussed as a potential explanation for this inconsistency (van den Brule et al. Citation2015).
The present investigation was focused on four of the most-used and most-researched ENM, i.e. cerium dioxide (CeO2), silicon dioxide (SiO2), silver (Ag) and titanium dioxide (TiO2). Of these, Ag is the most abundantly used one in consumer products (Vance et al. Citation2015). According to the Food and Agriculture Organization of the United Nations (World Health Organization Citation2010), Ag ENM are employed as antimicrobial and anti-odorant supplement in food, water, food contact surfaces and food packaging materials. In the EU, food grade Ag, which partly consists of nanoparticles, is labeled as E174 (EFSA Citation2016b). Like Ag, TiO2 ENM are also used in food packages in which they block UV-light and act as antimicrobial agents via a photocatalytic mechanism (Chawengkijwanich and Hayata Citation2008). Regarding its addition in food and beverage, TiO2 is known as the food additive E171 containing variable fractions of nanosized particles (Verleysen et al. Citation2020). Also, synthetic amorphous SiO2 (E551) is a commonly used food additive (World Health Organization Citation2010; Dekkers et al. Citation2011). It is mainly employed as anti-caking agent in powdered food products (World Health Organization Citation2010; Ruiz-Rodriguez, Meshulam, and Lesmes Citation2014). In contrast, CeO2 is not used in food applications. As an outstanding catalyst, it is added to diesel and gasoline, leading to its emission with exhaust gases (Zhang et al. Citation2013; Zamankhan et al. Citation2018). Thus, CeO2 may be inhaled, allowing for translocation to the intestine after mucociliary clearance and swallowing (Heyder et al. Citation1986; Oberdorster, Oberdorster, and Oberdorster Citation2005). Moreover, a possible accumulation of CeO2 in agricultural crops has been reported (Rico et al. Citation2011). Once ingested, these ENM could interfere with the gut microbiome and the delicate host-microbiome-interplay.
The goal of our investigation was to test the impacts of CeO2, SiO2, Ag, and TiO2 on the mouse gut microbiome in a realistic exposure scenario, namely via their introduction in feed pellets. By direct comparison of the materials, we sought to understand if there are ENM-specific effects. In view of earlier contrasting findings with the selected ENM so far investigated, we additionally aimed to gain an insight into the influence of study parameters on the outcome.
Materials and methods
Engineered nanomaterials
The CeO2 ENM used in this study was the European Commission's Joint Research Center (JRC) reference material NM 212. The specific sample was purchased from the Fraunhofer Institute for Molecular Biology and Applied Ecology (IME, Schmallenberg, Germany). Fumed amorphous SiO2 ENM with a declared primary particle size of 7 nm (#S5130) and Polyvinylpyrrolidone-coated Ag (Ag-PVP) ENM (<100 nm, #576832) were purchased from Sigma-Aldrich. The TiO2 ENM used in this study represents P25 from Evonik (JRC NM 105), the specific sample used in this study was kindly provided by the Institute of Energy and Environmental Technology (IUTA, Duisburg, Germany). The morphology and size distribution of the pristine ENM was determined by scanning electron microscopy (Supplementary material 1) and the characteristics are listed in .
Table 1. Characteristics of pristine ENM.
Experimental design
Feed pellets containing the respective ENM were prepared and provided by ssniff GmbH (Soest, Germany). For CeO2, SiO2, and TiO2, pellets containing 1% ENM (w/w) were used, whereas for Ag 0.2% was chosen. A homogenous distribution of the ENM in the feed pellets has been verified as described in Sofranko et al. (Citation2021). The estimation of the daily ENM exposure of the animals was based on a bodyweight of 20 g and a daily food intake of 4 g. Considering the above mentioned ENM content of the feed pellets, the daily intake was ∼400 mg/kg body weight for Ag and ∼2000 mg/kg body weight of the other investigated ENM. The doses were based on the maximum permitted level of one percent in food as specified by the United States Food and Drug Administration for TiO2 (Fda Citation2020).
The fecal samples used for gut microbiota characterization originated form two independent feeding studies described below and illustrated in .
Figure 1. Design of feeding studies with ENM in C57BL/6J mice. In study 1, female mice from the local breeding facility were exposed to CeO2 or SiO2 until sacrificing and collection of stools on day 21. In study 2, purchased male and female mice were exposed to Ag-PVP or TiO2 P25 until sacrificing and collection of stools on day 28. Study 2 was divided into two rounds.
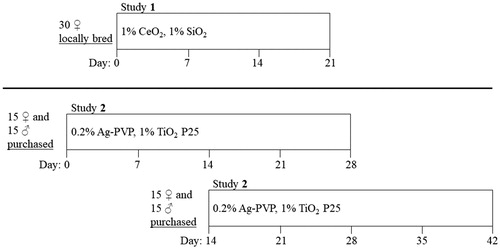
Study 1 was performed with CeO2 and SiO2 ENM (both at 1% w/w). The study was approved by the Landesamt für Natur, Umwelt und Verbraucherschutz (LANUV, NRW, Germany) with the reference number 84-02.04.2013.A443. A total of 30 female C57BL/6J mice from the local IUF breeding facility were randomized and acclimated in groups of five animals per cage and in total ten animals per exposure at least one week before starting the exposure. The oral exposures were started at an age of nine to ten weeks. The mice obtained food and water ad libitum. After exposure for 21 days, the mice were sacrificed by cervical dislocation. In alternating order between the control, SiO2 and CeO2 exposure group, one animal at a time was sacrificed and dissected.
Study 2 was performed with TiO2 (1% w/w) and Ag (0.2% w/w). This study was approved by the LANUV with reference number 84-02.04.2017.A338. A total of 30 male and 30 female C57BL/6J mice were ordered from Janvier Labs (Le Genest Saint Isle, France). The mice were randomized and acclimated in groups of five animals per cage and in total 20 animals per exposure (ten female/ten male) at least one week before starting the exposure. The oral exposure was started at an age of five to six weeks. The mice obtained food and water ad libitum. After exposure for 28 days, the mice were sacrificed by cervical dislocation. In alternating order between the control, TiO2 P25 exposure and Ag-PVP exposure group, one animal at a time was sacrificed and dissected. The second study was performed in two rounds of ten animals per exposure (five female/five male). The second round was started 14 days after the first round. Hence, each time 30 animals were sacrificed on the same day enabling comparable workflows for both studies.
In both studies, the mice were randomized based on the body weight, one week before starting the exposure. The weight of the mice was also determined at the start of the study, and after each week up to the sacrifice. For both studies the procedure to isolate the fecal samples was identical. According to the protocol of van den Brule et al. (Citation2015), stool was collected and pooled from the three distal centimeters of the ileum, the cecum and the three proximal centimeters of the colon. After isolation, the samples were immediately snap frozen in liquid nitrogen and stored at −80 °C until further use.
DNA extraction and 16S rRNA gene sequencing
The processing of the fecal samples was performed in the order of sacrificing. An equal number of samples per exposure group was processed in parallel. For the DNA preparation, the QIAamp PowerFecal Pro DNA (QIAGEN GmbH, Hilden, Germany, #51804) kit was used according to the instructions of the supplier. Briefly, homogenization of the stool samples was performed by shaking five minutes at 25 Hz twice using a Tissue Lyzer II (QIAGEN, #85300). Contaminating organic and inorganic matter was removed by precipitation and centrifugation. The DNA was bound to silica columns and further purified by washing with high-concentrated salt solutions until elution of pure DNA with 10 mM tris(hydroxymethyl)aminomethane (Tris) solution.
The subsequent preparatory steps as well as the sequencing were performed at the Genomics & Transcriptomics Laboratory of the Biologisch-Medizinisches Forschungszentrum at the Heinrich-Heine-University in Düsseldorf. According to the Illumina 16S metagenomics protocol Part #15044223 Rev. B, one library of the variable regions V3 and V4 of the rRNA gene was prepared for each sample. Briefly, a first stage PCR was performed to amplify the part of the bacterial rRNA gene comprising the V3 and V4 regions. For purification the amplicons were bound to magnetic beads, washed with 80% ethanol and detached with 10 mM Tris solution. Subsequently, a sample specific DNA-barcode, i.e. an index, was attached to each amplicon using the Nextera XT Index kit in a second stage PCR. The indexed amplicons were purified, quantified and normalized. Two multiplexed sequencing runs were performed on an Illumina MiSeq machine using v3 chemistry and a 2 × 300 bp setup. In each run, the libraries of 45 samples were measured at a depth of 200,000 reads per sample. The resulting sequences were trimmed and demultiplexed using standard Illumina procedures.
Next generation sequencing data analysis
All NGS reads were processed using R 3.6.3 and the DADA2 Bioconductor package (Callahan et al. Citation2016). Sequences were trimmed and filtered to tolerate a maximum of 2 expected errors per paired ends read. Amplicon Sequence Variants (ASV) were inferred using the high-resolution DADA2 method, which distinguishes sequencing errors from real biological variation. Chimeras as well as low abundance ASV making up <0.005% of reads were subsequently removed from the data set (Bokulich et al. Citation2013). Data from blank samples were analyzed to control for potential contamination in DNA extraction kits, as previously recommended (Hornung, Zwittink, and Kuijper Citation2019). Taxonomy was assigned with a naive Bayesian classifier implemented in the DADA2 package, using the GreenGenes (v.13.8) training set. Sequencing data were rarefied at sequencing depth of 80,000 reads using the phyloseq Bioconductor package (Mcmurdie and Holmes Citation2013). The α-diversity indexes (richness, Simpson, and Shannon) in the microbial communities were calculated using the phyloseq Bioconductor package.
Considering that multiple cages were used for each study group in both studies in order to account for a potential cage effect (Laukens et al. Citation2016), the impact of each ENM on α-diversity indexes was assessed through mixed effects models with cage as random effect and ENM and sex (in study 2) as fixed effects.
To investigate differences in community composition (β-diversity), weighted UniFrac distances were calculated and plotted using principal coordinates analysis with the GUniFrac R package.
In study 1, the impact of each ENM on β-diversity was assessed through a multivariate nested analysis of variance of the distance matrix by modeling the ENM study group and the nested cage effect in the nested.npmanova function of the BiodiversityR package. In study 2, weighted UniFrac distances were calculated on cage-average profiles and permutational multivariate analysis of variance (PERMANOVA) was computed using the ADONIS function of the vegan package in R in order to assess the impact of each ENM and sex.
To identify the bacterial phyla, families and genera impacted by ENM exposure, ASV were grouped at the phylum, family, and genus level. The counts were then normalized to their relative abundance before applying centered log-ratio (CLR) transformation for compositional data, as described previously (Kong et al. Citation2020). Mixed effect models were built on the transformed data with cage as random effect and ENM and sex (in study 2) as fixed effects.
In study 2, for each outcome (i.e. relative abundances, α- and β-diversities), the interaction between sex and ENM was also introduced as fixed effect in the models and removed when not significant. When the interaction was significant, ENM effects were calculated separately for both sexes and sex effects were calculated separately for control and exposure group.
p Values ≤0.05 were considered significant. When the effects of each ENM (and sex) were assessed on multiple outcomes (e.g. relative abundance of several families), p values were corrected (Q values) using the Benjamini–Hochberg methodology to control the false discovery rate (FDR) at 10% (i.e. Q values ≤0.10 were considered significant) (Benjamini et al. Citation2001).
Results
Absence of overt toxicity
In these feeding studies, mice were exposed to the four ENM CeO2, SiO2, Ag, and TiO2. In order to monitor the overall health status of the animals, the bodyweight was measured on a weekly basis. For none of the ENM a significant effect on the bodyweight development was observed ( and ). In addition, no exposure related changes in main organs were noted at gross necroscopy.
Table 2. Weekly development of the relative bodyweight in study 1, in percent of the bodyweight on the first day of exposure.
Table 3. Weekly development of the relative bodyweight in study 2, in percent of the bodyweight on the first day of exposure.
Effects of ENM on the β-diversity
The analysis of NGS data from both studies produced a total of 2753 ASVs. The latter were then filtrated resulting in 864 ASVs.
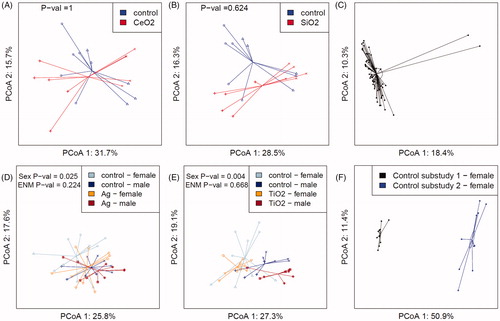
To assess potential changes of the microbial composition between the control and exposure groups, and differences between the sexes, the β-diversity was evaluated applying a weighted UniFrac analysis. In study 1, testing CeO2 and SiO2, no effect on the β-diversity was found (). In study 2, testing Ag and TiO2, one control sample and one TiO2 exposure sample were found to differ substantially from all the other samples (). These two samples were considered exposure-unrelated artifacts, and were excluded from subsequent analyses. No ENM related effect on the β-diversity was seen in study 2 either (). However, in this study, assessing both female and male mice, an exposure-independent sex-related difference of the β-diversity was observed. Notably, the greatest differences were found when comparing the female control animals of the two studies. ().
Figure 2. Weighted UniFrac distance analyses of the microbial β-diversity depicted as Principle Coordinates Analyses (PCoA). In study 1, female mice were fed with feed pellets containing either no additive, 1.0% CeO2 (A) or 1.0% SiO2 (B) (N = 10 each). All 60 animals of study 2, including two artifacts that were removed before doing further analyses, are depicted together in C. In study 2, female and male mice were fed with feed pellets containing either no additive (N = 19, 10 female and 9 male), 0.2 % Ag (D) (N = 20, 10 per sex) or 1.0% TiO2 (E) (N = 19, 10 female and 9 male). The comparison of the female control animals of study 1 and study 2 is shown in F. The different shapes of the dots represent the different cages. p Values were calculated using multivariate nested analysis of variance for study 1 and PERMANOVA based on cage average profiles for study 2.
Effects of ENM on phyla
Subsequently, changes in abundance were assessed on the taxonomic levels phylum and genus. In both studies the phyla Firmicutes and Bacteroidetes dominated the intestinal bacteria with a cumulative abundance of >95% (). With a prevalence of ∼70%, Firmicutes were ∼10% more abundant in the control animals of study 2 than in the control animals of study 1. Conversely, Bacteroidetes were more abundant in the control animals of study 1. This difference between the two studies was stronger than any ENM exposure associated difference within the studies.
Figure 3. Abundances of phyla in the intestinal microbiome of mice after ENM exposure. In study 1, female mice were fed with feed pellets containing either no additive, 1.0% CeO2 or 1.0% SiO2 (N = 10 each). In study 2, female and male mice were fed with feed pellets containing either no additive (N = 19, 10 female and 9 male), 0.2 % Ag (N = 20, 10 per sex) or 1.0% TiO2 (N = 19, 10 female and 9 male) (A). In the scatter plots (B–D) the abundances of selected phyla in ENM exposed mice are displayed compared to the respective control. The different shapes of the dots represent the different cages. p-Values were calculated based on mixed effect models. In study 2, the interaction between sex and ENM was removed when not significant. Q Values were obtained by FDR correction. p Values ≤0.05 and Q values ≤0.10 were considered significant. E = ENM, S = Sex, f = female, m = male, C = Control, T = Treatment.
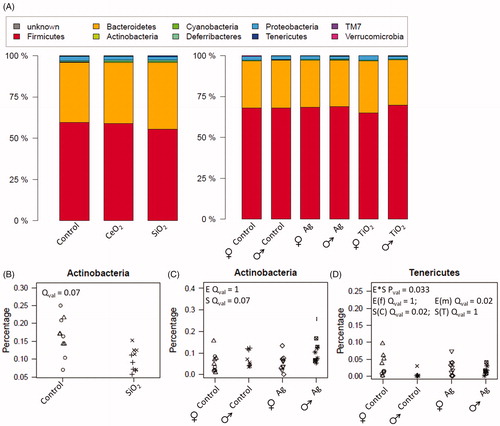
Across all analyzed animals, Actinobacteria represented less than 0.3% of total bacteria. After exposure with SiO2, their relative abundance was decreased significantly (). None of the relative abundances of the other phyla was modified after CeO2 or SiO2 exposure (Supplementary material 1).
Evaluating Ag exposed animals and the corresponding control animals, a higher relative abundance of Actinobacteria in males was found (). Another low abundance phylum was Tenericutes, representing less than 0.1% of all bacteria. For this phylum, an interaction between Ag exposure and sex was recorded (). Thus, the evaluation of exposure effects was performed separately for both sexes, and the analysis of sex effects was performed separately for the control and the exposure groups. The abundance of Tenericutes increased in the male mice following Ag exposure while there was no effect in female mice. Whereas in the female control mice Tenericutes were more abundant than in the male control mice, there was no sex specific difference in the Ag exposed mice. No further effect at the phylum level was observed following Ag exposure, and none was found related to the TiO2 exposure (Supplementary material 2).
Effects of ENM on genera
Subsequently, effects at the genus level were analyzed. About 30% of the microbiota could be assigned to a genus (). Again, differences were observed between the controls of the two studies. For instance, the genus Lactobacillus was about 8% prevalent in study 1 but only about 3–4% abundant in study 2. No significant impact on any genus was observed, neither for CeO2 exposure nor for SiO2 exposure (Supplementary material 3).
Figure 4. Abundances of genera in the intestinal microbiome of mice after ENM exposure. In study 1, female mice were fed with feed pellets containing either no additive, 1.0% CeO2 or 1.0% SiO2 (N = 10 each). In study 2, female and male mice were fed with feed pellets containing either no additive (N = 19, 10 female and 9 male), 0.2% Ag (N = 20, 10 per sex) or 1.0% TiO2 (N = 19, 10 female and 9 male) (A). In the scatter plots (B–D) the abundances of selected genera in ENM exposed mice are displayed compared to the respective control. The different shapes of the dots represent the different cages. p Values were calculated based on mixed effect models. In study 2, the interaction between sex and ENM was removed when not significant. Q Values were obtained by FDR correction. p Values ≤0.05 and Q values ≤0.10 were considered significant. E = ENM, S = Sex, f = female, m = male, C = Control, T = Treatment.
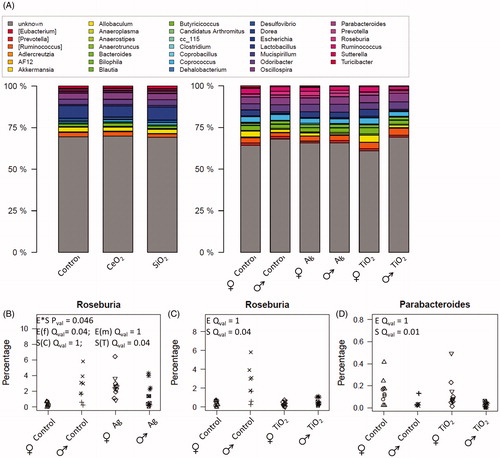
In male control animals and in female and male Ag exposed animals, the abundance of the genus Roseburia varied between close to 0% and 6% (). In female control animals as well as in female and male TiO2 exposed animals, Roseburia represented less than 1.5% of all bacteria. A significant interaction between Ag exposure and sex was recorded. In female mice, the abundance of Roseburia was significantly increased with Ag exposure. Amongst the Ag exposed mice, Roseburia was more abundant in female than in male mice. A significantly higher abundance of Roseburia in male compared to female mice was found, when analyzing the control and TiO2 exposure groups (). Evaluating the TiO2 exposure group and its control animals, a significantly higher abundance of Parabacteroides in female compared to male mice was seen ().
Effects of ENM on the α-diversity
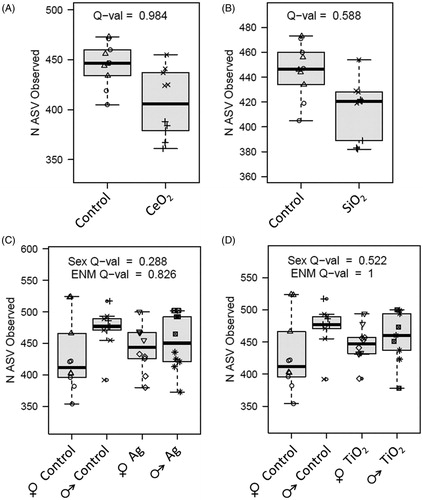
Following both CeO2 and SiO2 exposure, the richness decreased (). However, this trend did not reach significance. No further effect on the richness and evenness was observed for any of the ENM (, Supplementary material 4).
Figure 5. α-diversity of the intestinal microbiome of mice after ENM exposure. In study 1, female mice were fed with feed pellets containing either no additive, 1.0% CeO2 (A) or 1.0% SiO2 (B) (N = 10 each). In study 2, female and male mice were fed with feed pellets containing either no additive (N = 19, 10 female and 9 male), 0.2% Ag (C) (N = 20, 10 per sex) or 1.0% TiO2 (D) (N = 19, 10 female and 9 male). The richness presented as the number of ASVs observed per sample was assessed. p Values were calculated based on mixed effect models. In study 2 the interaction between sex and ENM was removed when not significant. Q values were obtained by FDR correction accounting for the three endpoints richness, Shannon entropy and Simpson's index. Q values ≤0.10 were considered significant.
Discussion
We have studied the effects of four of the most investigated and commercially relevant types of engineered nanomaterials (ENM) on the murine gut microbiome in a realistic exposure scenario. The doses of CeO2, SiO2, and TiO2 of 1% (w/w) were based on the maximum permitted level of TiO2 of one percent specified by the United States Food and Drug Administration (FDA Citation2020). In Europe the maximum permitted doses defined by the European Food Safety Authority (EFSA) as quantum satis, as much as needed but not more than necessary, may be even higher (EFSA Citation2016a). The latter will likely change in the near future based on the most recent opinion of EFSA that TiO2 can no longer be considered as safe food additive (Younes et al., Citation2021). For reasons of comparability, the same doses were applied for CeO2 and SiO2. While CeO2 is not used as a food additive and expected levels due to contamination are much lower than for TiO2, the amount of amorphous SiO2 may even exceed one percent. It is limited to two percent by the US FDA (Citation2021) and defined as quantum satis by EFSA (Hardy et al. Citation2018). Only for Ag a lower dose was chosen because of its relatively higher oral toxicity when compared to the other three ENM types (Buesen et al. Citation2014; Lee et al. Citation2019; Heo et al. Citation2020). Expected human exposure levels are again lower than for TiO2 (EFSA Citation2016b). It must be mentioned that we did not use food additives, but well-investigated model ENM in order to facilitate the comparability and linkage to other studies.
Absence of major effects
The absence of impacts on the α-diversity, β-diversity and the most abundant phyla coincided with the unimpaired development of the bodyweight as well as the absence of macroscopic pathologies. These outcomes at the relatively high test concentrations do not suggest a major hazard of ENM exposure. However, when analyzing phyla and genera of lower relative abundance, ENM-specific effects, which are highly relevant for intestinal health, were found as discussed below.
ENM specific effects on important taxa
Firstly, the phylum Actinobacteria was found to be of lower relative abundance following exposure with SiO2. Compared to the murine gut, Actinobacteria are of remarkably higher relative abundance in humans where they are the third most frequent phylum, representing about 5-10% of the microbiota (Arumugam et al. Citation2011; Hsu et al. Citation2018). As reviewed by Binda et al. (Citation2018), Actinobacteria are pivotal for the gut homeostasis because they ferment large polysaccharides, produce SCFA like butyrate, stimulate the mucin expression and balance the immune responses. The main genus of Actinobacteria in humans, Bifidobacterium (Arumugam et al. Citation2011), is one of the two most commonly used probiotics. It has the capability to decrease gut endotoxin levels, increase the intestinal barrier integrity and mitigate proinflammatory signals in mice (Griffiths et al. Citation2004; Wang et al. Citation2006; Cani et al. Citation2007). In elderly individuals, it has been shown that the intake of the lactic acid producers Bifidobacterium and Lactobacillus leads to a decreased colonic inflammatory infiltration (De Simone et al. Citation1992). Depending on the study, both increases as well as reductions of the abundance of Actinobacteria or Bifidobacterium have been observed in relation to obesity and intake of a high-fat diet (Murphy et al. Citation2010; Schwiertz et al. Citation2010). Decreased levels of intestinal Bifidobacterium have also been associated with type II diabetes and insulin resistance (Wu et al. Citation2010; Le et al. Citation2012). However, the causality between disease onset and change of Actinobacteria or Bifidobacterium abundance remains to be clarified. For this reason, it is uncertain whether a reduced relative abundance as observed after SiO2 exposure would cause an adverse effect in humans.
Another important taxon that was found to be altered is Roseburia. The relative abundance of this genus was increased in female mice, following Ag exposure. As Actinobacteria, Roseburia is more abundant in the human compared to the murine gut, representing between 3% and 15% of intestinal bacteria in humans (Aminov et al. Citation2006). Reduced abundances of this genus have been associated with both anorexia nervosa and consumption of a high-fat diet and type II diabetes (Neyrinck et al. Citation2012; Karlsson et al. Citation2013; De Clercq et al. Citation2016). As in the case of Actinobacteria, the causality between disease and change of the genus abundance have not yet been demonstrated. For breaking down dietary fibers, releasing B vitamins, and particularly for being a main producer of butyrate, Roseburia have been proposed as a marker of a healthy microbiome (Louis and Flint Citation2009; Tamanai-Shacoori et al. Citation2017; Hillman et al. Citation2020). The SCFA butyrate forms the main energy source of colonocytes and is crucial for the maintenance of mucosal homeostasis (Schwab et al. Citation2007; Chang et al. Citation2014; Liu et al. Citation2018). The literature on impacts of altered butyrate concentrations on the mucosal barrier integrity is controversial. Both increased and decreased expression levels of mucins, facilitated tight junction assembly as well as apoptosis of colonocytes have been reported (Augenlicht et al. Citation2003; Willemsen et al. Citation2003; Paassen et al. Citation2009; Peng et al. Citation2009; Huang et al. Citation2014). In in vitro investigations, strengthening effects have rather been related to lower concentrations of butyrate and vice versa. Furthermore, in some studies, butyrate is suggested to alleviate obesity, while others suspect it of inducing obesity (reviewed by Liu et al. Citation2018). The meaning of an elevated prevalence of Roseburia in the human gut remains to be clarified. Therefore, it is not yet possible to conclude whether the increased abundance of Roseburia seen in Ag exposed female points toward a beneficial or a harmful influence on health.
Finally, we observed an increased abundance of the phylum Tenericutes in Ag exposed male mice. Besides one study that found a higher abundance of Tenericutes in healthy subjects than in probands with metabolic syndrome, to our knowledge no information about the association of this phylum with health or disease is available (Lim et al. Citation2017).
Summing up, the uncertain toxicological significance of the observed effects, the absence of major impacts on the general health status and the microbiome does not suggest a major hazard of ENM intake for healthy individuals. Nevertheless, two of the ENM-specifically affected taxonomic groups (i.e. Actinobacteria by SiO2 and Roseburia by Ag) are of great importance for the intestinal homeostasis. In case these effects occur in human, they might lead to a higher susceptibility toward diseases like obesity or type II diabetes. Also, ENM exposure might exacerbate these diseases, pushing shifts in the microbiome forward. Further studies should address these issues. Mouse models with a humanized microbiome could mimic effects on Actinobacteria and Roseburia more realistically (Park and Im Citation2020). A better insight could also be achieved by a trial aiming to correlate the food-intake of ENM with the changes of the microbiome in humans. In this context, determining the concentration of butyrate in the intestinal lumen or in the stool would be of particular interest. In concurrent in vitro investigations with advanced models of the human gut (Kampfer, Busch, and Schins Citation2020) we are exploring the effects of the presence of butyrate and varying butyrate concentrations in combination with ENM exposure.
Comparison to ENM effects reported in literature
The number of ENM exposure studies assessing effects on the microbiome in rodents is steadily growing. In comparison to investigations with Ag and TiO2, published data on CeO2 and SiO2 are scarce. To our knowledge Bubnov et al. (Citation2019) are the only ones having investigated CeO2 effects. While they did not expose animals fed a normal diet, they described a CeO2-associated reversal of microbiome changes induced by a high-fat diet in female mice. In accordance with our study, no deviation from the normal microbiome composition due to CeO2 exposure was reported. Chen et al. (Citation2017) and Yan et al. (Citation2020) administered amorphous SiO2 to male mice by gavage for 7 d and 28 d, respectively. In contrast to our study, they found a change of the overall microbial composition, a disturbed Firmicutes to Bacteroidetes ratio and further influences on lower taxonomic levels while the phylum Actinobacteria was not affected.
Regarding Ag, the so far reported outcomes are exceptionally diverse. Similar to our results, Hadrup et al. (Citation2012) and Wilding et al. (Citation2016) reported that 28 d of gavage exposure had no impact on the microbiome of rats and mice, respectively. On the contrary, several other studies have recorded effects on the microbial composition, in particular on the ratio of Firmicutes to Bacteroidetes, following exposure of rats or mice to Ag ENM for periods between 7 d and 13 weeks (Williams et al. Citation2015; van den Brule et al. Citation2015; Chen et al. Citation2017; Wu et al. Citation2020). However, in none of the studies, an impact on the abundance of Roseburia has been reported. Importantly, all the studies on Ag applied doses at least ten times lower than in our study. Still, a correlation between the doses and the extent of effects could not be identified.
Within the last two years, a number of repeated dose studies has been published on the effects of TiO2 on the microbiome in rats and mice. Either the food additive E171, of which a variable number fraction is in nano-size range (Verleysen et al. Citation2020), or model TiO2 ENM were applied either via gavage or with the drinking water or in feed for exposure durations between 7 d and three months (Li et al. Citation2019; Mu et al. Citation2019; Pinget et al. Citation2019). Not surprisingly, the outcomes ranged from the change of the abundance of three bacterial strains to a decrease of the α-diversity, a shift of the β-diversity and changed abundance of 35 taxa (Chen et al. Citation2019; Zhang et al. Citation2020). Strikingly, in contrast to our results, none of the studies reported the absence of effects although the estimated oral exposure in our study exceeded the highest tested maximum daily dose of 200 mg/kg bodyweight by factor ten (Cao et al. Citation2020).
One particular advantage of our investigation is that it enables the direct comparison of four different ENM. The majority of rodent studies on particle effects on the microbiome published so far focused on a single material. Merely Chen et al. (Citation2017) tested SiO2, Ag, and TiO2 ENM and Yan et al. (Citation2020) investigated SiO2 and TiO2. Both found several distinct effects of the tested ENM, which did neither coincide with the SiO2-specific reduced abundance of Actinobacteria nor with the Ag-specific increased abundance of Roseburia in female and of Tenericutes in male in our study.
The impact of the study design on ENM effects
Finally, the different findings in our investigation compared to former reports may be explained by factors belonging to five categories: physicochemical parameters of ENM, dosing-regime, computation, technical aspect, and biology. Regarding the physicochemical properties and dose, apart from the material itself, ENM can possess further distinct characteristics such as morphology, surface coating, size, shape or agglomeration properties that may all influence the interaction with the microbiome (Mu et al. Citation2019). These characteristics are connected to the dose and vice versa. With the agglomeration status, the size and surface activity change while the dose also influences ENM agglomeration. When administering ENM with feed versus gavage, the surrounding matrix may change the retention time in the stomach and the dissolution behavior in the acidic gastric juice. Moreover, while a gavage is a bolus dose, ad libidum feeding leads to a more homogenous exposure during and after food consumption periods of mice. The other categories, i.e. computation, technical aspect and biology, are the three sources of so-called batch effects that may influence any kind of microbiome study (Wang and Lecao Citation2020). Computational batch effects include the software and the approach used for clustering of NGS reads. Technical batch effects comprise the DNA extraction method, storage conditions, and the laboratory itself. In the present studies, these computational and technical factors were kept consistent as far as possible. Biological batch effects include the feed, the housing, the age, and the sex of animals. An example for a sex effect in our investigation is given by the different influences of Ag on Roseburia and Tenericutes in male and female mice. Moreover, in study 2 sex-specific differences in the basal relative abundance of Actinobacteria were observed, raising the question if SiO2 would have caused the same decrease of the relative abundance of this phylum in males as in females. The sex-dependent differences of the β-diversity and the abundance of Parabacteroides add to the recommendation to include both sexes into microbiome studies on ENM. For Ag, Williams et al. (Citation2015) and Wu et al. (Citation2020) already described a sex-specificity of microbiome effects. The remarkable difference between the control mice of the two studies represents another biological batch effect. In this context the origins of the mice, derived from the local breeding facility in study 1 and purchased in study 2 may have played an important role since the early life exposure greatly influences the developed microbiome, thus leading to variable preconditions even before ENM exposure was started; the importance of early life exposure has been described across species (Bokulich et al. Citation2016; Snijders et al. Citation2017; Brinkmann et al. Citation2021).
Conclusion
In conclusion, the factors potentially influencing the outcome of a microbiome study on ENM are manifold, including ENM properties and dose, as well as computational, technical, and biological batch effects. Hence, it is highly challenging to associate results of different studies either to the ENM or to the study design. Therefore, we advocate for more standardization, particularly for computational and technical issues, as well as biological aspects such as the inclusion of both sexes. However, varying laboratories and differing origins of the animals, for instance, cannot be avoided. Solutions remain to be established for these cases. In our studies, investigating firstly CeO2 and SiO2, and secondly Ag and TiO2 within the same study allows for a direct comparison of the two ENM tested within the same study. Thus, we state with relative certainty that SiO2 but not CeO2 exposure led to a decrease in the relative abundance of Actinobacteria, and that Ag but not TiO2 had an impact on Roseburia in female mice. These ENM-specific effects on two taxa that are pivotal for the homeostasis of the human gut warrant further studies looking into the relevance of these finding for the human gut microbiome, and potentially associated health consequences, especially in susceptible individuals.
Supplemental Material
Download Zip (2 MB)Acknowledgments
The authors would like to thank Isabelle Masson, Mathias Busch, Julia Kolling, Paul M. Peeters, Miriam G. Hovest, Waluree Thongkam, Harm Heusinkveld, Christel Weishaupt, Gabriele Wick, and Petra Gross for technical support contributing to the animal studies. Furthermore, we are grateful for the contribution of Dr. Karl Köhrer and Dr. Patrick Petzsch from the Genomics & Transcriptomics Laboratory of the Biologisch-Medizinisches Forschungszentrum at the Heinrich-Heine-University in Düsseldorf, who performed the next generation sequencing.
Disclosure statement
No potential conflict of interest was reported by the author(s).
Data availability statement
The next generation sequencing raw data that were obtained in this investigation, are openly available in figshare at doi: 10.6084/m9.figshare.14499822.
Additional information
Funding
References
- Aminov, R. I., A. W. Walker, S. H. Duncan, H. J. Harmsen, G. W. Welling, and H. J. Flint. 2006. “Molecular Diversity, Cultivation, and Improved Detection by Fluorescent in Situ Hybridization of a Dominant Group of Human Gut Bacteria Related to Roseburia Spp. or Eubacterium rectale.” Applied and Environmental Microbiology 72: 6371–6376. doi:10.1128/AEM.00701-06.
- Arumugam, M., J. Raes, E. Pelletier, D. Le Paslier, T. Yamada, D. R. Mende, G. R. Fernandes, et al. MetaHIT Consortium (additional members). 2011. “Enterotypes of the Human Gut Microbiome.” Nature 473 (7346): 174–180. doi:10.1038/nature09944.
- Augenlicht, L., L. Shi, J. Mariadason, C. Laboisse, and A. Velcich, 2003. “Repression of MUC2 Gene Expression by Butyrate, a Physiological Regulator of Intestinal Cell Maturation.” Oncogene 22 (32): 4983–4992. doi:10.1038/sj.onc.1206521.
- Benjamini, Y., D. Drai, G. Elmer, N. Kafkafi, and I. Golani, 2001. “Controlling the False Discovery Rate in Behavior Genetics Research.” Behavioural Brain Research. 125 (1–2): 279–284. doi:10.1016/S0166-4328(01)00297-2.
- Bergin, I. L., and F. A. Witzmann, 2013. “Nanoparticle Toxicity by the Gastrointestinal Route: evidence and Knowledge Gaps.” International Journal of Biomedical Nanoscience and Nanotechnology 3 (1–2): 163–210. doi:10.1504/IJBNN.2013.054515.
- Binda, C., L. R. Lopetuso, G. Rizzatti, G. Gibiino, V. Cennamo, and A. Gasbarrini, 2018. “Actinobacteria: A Relevant Minority for the Maintenance of Gut Homeostasis.” Digestive and Liver Disease 50 (5): 421–428. doi:10.1016/j.dld.2018.02.012.
- Bokulich, N. A., Chung, J., Battaglia, T., Henderson, N., Jay, M., Li, H. A., Wu, D. L, et al. 2016. “Antibiotics, Birth Mode, and Diet Shape Microbiome Maturation during Early Life.” Science Translational Medicine 8 (343): 343ra82–343ra82. doi:10.1126/scitranslmed.aad7121.
- Bokulich, N. A., S. Subramanian, J. J. Faith, D. Gevers, J. I. Gordon, R. Knight, D. A. Mills, and J. G. Caporaso, 2013. “Quality-Filtering Vastly Improves Diversity Estimates from Illumina Amplicon Sequencing.” Nature Methods 10 (1): 57–59. doi:10.1038/nmeth.2276.
- Bouwmeester, H., P. Brandhoff, H. J. P. Marvin, S. Weigel, and R. J. B. Peters, 2014. “State of the Safety Assessment and Current Use of Nanomaterials in Food and Food Production.” Trends in Food Science & Technology 40 (2): 200–210. doi:10.1016/j.tifs.2014.08.009.
- Brinkmann, B. W., W. F. Beijk, R. C. Vlieg, S. J. T. Van Noort, J. Mejia, J. L. Colaux, S. Lucas, G. Lamers, W. Peijnenburg, and M. G. Vijver, 2021. “Adsorption of Titanium Dioxide Nanoparticles onto Zebrafish Eggs Affects Colonizing Microbiota.” Aquatic Toxicology 232: 105744. doi:10.1016/j.aquatox.2021.105744.
- Bubnov, R., L. Babenko, L. Lazarenko, M. Kryvtsova, O. Shcherbakov, N. Zholobak, O. Golubnitschaja, and M. Spivak, 2019. “Can Tailored Nanoceria Act as a Prebiotic? Report on Improved Lipid Profile and Gut Microbiota in Obese Mice.” EPMA Journal 10 (4): 317–335. doi:10.1007/s13167-019-00190-1.
- Buesen, R., R. Landsiedel, U. G. Sauer, W. Wohlleben, S. Groeters, V. Strauss, H. Kamp, and B. Van Ravenzwaay, 2014. “Effects of SiO(2), ZrO(2), and BaSO(4) Nanomaterials with or without Surface Functionalization upon 28-Day Oral Exposure to Rats.” Archives of Toxicology 88 (10): 1881–1906. doi:10.1007/s00204-014-1337-0.
- Callahan, B. J., P. J. Mcmurdie, M. J. Rosen, A. W. Han, A. J. Johnson, and S. P. Holmes, 2016. “DADA2: High-Resolution Sample Inference from Illumina Amplicon Data.” Nature Methods 13 (7): 581–583. doi:10.1038/nmeth.3869.
- Cani, P. D., A. M. Neyrinck, F. Fava, C. Knauf, R. G. Burcelin, K. M. Tuohy, G. R. Gibson, and N. M. Delzenne, 2007. “Selective Increases of Bifidobacteria in Gut Microflora Improve High-Fat-Diet-Induced Diabetes in Mice through a Mechanism Associated with Endotoxaemia.” Diabetologia 50 (11): 2374–2383. doi:10.1007/s00125-007-0791-0.
- Cao, X., Y. Han, M. Gu, H. Du, M. Song, X. Zhu, G. Ma, et al. 2020. “Foodborne Titanium Dioxide Nanoparticles Induce Stronger Adverse Effects in Obese Mice than Non-Obese Mice: Gut Microbiota Dysbiosis, Colonic Inflammation, and Proteome Alterations.” Small 16 (36): e2001858. doi:10.1002/smll.202001858.
- Chang, P. V., L. Hao, S. Offermanns, and R. Medzhitov, 2014. “The Microbial Metabolite Butyrate Regulates Intestinal Macrophage Function via Histone Deacetylase Inhibition.” Proceedings of the National Academy of Sciences 111 (6): 2247–2252. doi:10.1073/pnas.1322269111.
- Chawengkijwanich, C., and Y. Hayata, 2008. “Development of TiO2 Powder-Coated Food Packaging Film and Its Ability to Inactivate Escherichia coli in Vitro and in Actual Tests.” International Journal of Food Microbiology 123 (3): 288–292. doi:10.1016/j.ijfoodmicro.2007.12.017.
- Chen, H., R. Zhao, B. Wang, C. Cai, L. Zheng, H. Wang, M. Wang, et al. 2017. “The Effects of Orally Administered Ag, TiO 2 and SiO 2 Nanoparticles on Gut Microbiota Composition and Colitis Induction in Mice.” NanoImpact 8: 80–88. doi:10.1016/j.impact.2017.07.005.
- Chen, Z., S. Han, D. Zhou, S. Zhou, and G. Jia, 2019. “Effects of Oral Exposure to Titanium Dioxide Nanoparticles on Gut Microbiota and Gut-Associated Metabolism in Vivo.” Nanoscale 11 (46): 22398–22412. doi:10.1039/C9NR07580A.
- De Clercq, N. C., A. K. Groen, J. A. Romijn, and M. Nieuwdorp, 2016. “Gut Microbiota in Obesity and Undernutrition.” Advances in Nutrition 7 (6): 1080–1089. doi:10.3945/an.116.012914.
- De Simone, C., A. Ciardi, A. Grassi, S. Lambert Gardini, S. Tzantzoglou, V. Trinchieri, S. Moretti, and E. Jirillo, 1992. “Effect of Bifidobacterium bifidum and Lactobacillus acidophilus on Gut Mucosa and Peripheral Blood B Lymphocytes.” Immunopharmacology and Immunotoxicology 14 (1–2): 331–340. doi:10.3109/08923979209009228.
- Dekkers, S., P. Krystek, R. J. Peters, D. P. Lankveld, B. G. Bokkers, P. H. Van Hoeven-Arentzen, H. Bouwmeester, and A. G. Oomen, 2011. “Presence and Risks of Nanosilica in Food Products.” Nanotoxicology 5 (3): 393–405. doi:10.3109/17435390.2010.519836.
- EFSA. 2016a. “Re-Evaluation of Titanium Dioxide (E 171) as a Food Additive.” EFSA Journal 14 (9): e04545. doi:10.2903/j.efsa.2016.4545.
- EFSA. 2016b. “Scientific Opinion on the Re‐Evaluation of Silver (E 174) as Food Additive.” EFSA Journal 14 (1): 4364. doi:10.2903/j.efsa.2016.4364.
- FDA. 2020. Title 21 of Code of the Federal Regulations, CFR §73.575. Titanium dioxide.
- FDA. 2021. Title 21 of Code of the Federal Regulations, CFR §172.480. Silicon dioxide.
- Griffiths, E. A., L. C. Duffy, F. L. Schanbacher, H. Qiao, D. Dryja, A. Leavens, J. Rossman, G. Rich, D. Dirienzo, and P. L. Ogra, 2004. “In Vivo Effects of Bifidobacteria and Lactoferrin on Gut Endotoxin Concentration and Mucosal Immunity in Balb/c Mice.” Digestive Diseases and Sciences 49 (4): 579–589. doi:10.1023/B:DDAS.0000026302.92898.ae.
- Hadrup, N., K. Loeschner, A. Bergstrom, A. Wilcks, X. Gao, U. Vogel, H. L. Frandsen, E. H. Larsen, H. R. Lam, and A. Mortensen, 2012. “Subacute Oral Toxicity Investigation of Nanoparticulate and Ionic Silver in Rats.” Archives of Toxicology 86 (4): 543–551. doi:10.1007/s00204-011-0759-1.
- Hardy, A., D. Benford, T. Halldorsson, M. J. Jeger, H. K. Knutsen, S. More, H. Naegeli, et al. 2018. “Guidance on Risk Assessment of the Application of Nanoscience and Nanotechnologies in the Food and Feed Chain: Part 1, Human and Animal Health.” EFSA Journal. 16: e05327.
- Heo, M. B., M. Kwak, K. S. An, H. J. Kim, H. Y. Ryu, S. M. Lee, K. S. Song, I. Y. Kim, J. H. Kwon, and T. G. Lee, 2020. “Oral Toxicity of Titanium Dioxide P25 at Repeated Dose 28-Day and 90-Day in Rats.” Particle and Fibre Toxicology 17 (1): 34. doi:10.1186/s12989-020-00350-6.
- Heyder, J., J. Gebhart, G. Rudolf, C. F. Schiller, and W. Stahlhofen, 1986. “Deposition of Particles in the Human Respiratory Tract in the Size Range 0.005–15 µm.” Journal of Aerosol Science 17 (5): 811–825-811–825. doi:10.1016/0021-8502(86)90035-2.
- Hillman, E. T., A. J. Kozik, C. A. Hooker, J. L. Burnett, Y. Heo, V. A. Kiesel, C. J. Nevins, et al. 2020. “Comparative Genomics of the Genus Roseburia Reveals Divergent Biosynthetic Pathways That May Influence Colonic Competition among Species.” Microb Genom 6 (7). doi:10.1099/mgen.0.000399.
- Hornung, B. V. H., R. D. Zwittink, and E. J. Kuijper, 2019. “Issues and Current Standards of Controls in Microbiome Research.” FEMS Microbiology Ecology 95 (5). doi:10.1093/femsec/fiz045.
- Hsu, P. I., C. Y. Pan, J. Y. Kao, F. W. Tsay, N. J. Peng, S. S. Kao, H. M. Wang, Taiwan Acid-Related Disease Study, G, et al. 2018. “Helicobacter pylori Eradication with Bismuth Quadruple Therapy Leads to Dysbiosis of Gut Microbiota with an Increased Relative Abundance of Proteobacteria and Decreased Relative Abundances of Bacteroidetes and Actinobacteria.” Helicobacter 23 (4): e12498. doi:10.1111/hel.12498.
- Huang, X. Z., Z. R. Li, L. B. Zhu, H. Y. Huang, L. L. Hou, and J. Lin, 2014. “Inhibition of p38 Mitogen-Activated Protein Kinase Attenuates Butyrate-Induced Intestinal Barrier Impairment in a Caco-2 Cell Monolayer Model.” Journal of Pediatric Gastroenterology & Nutrition 59 (2): 264–269. doi:10.1097/MPG.0000000000000369.
- Kampfer, AaM, M. Busch, and R. P. F. Schins, 2020. “Advanced in Vitro Testing Strategies and Models of the Intestine for Nanosafety Research.” Chemical Research in Toxicology 33 (5): 1163–1178. doi:10.1021/acs.chemrestox.0c00079.
- Karlsson, F. H., V. Tremaroli, I. Nookaew, G. Bergstrom, C. J. Behre, B. Fagerberg, J. Nielsen, and F. Backhed, 2013. “Gut Metagenome in European Women with Normal, Impaired and Diabetic Glucose Control.” Nature 498 (7452): 99–103. doi:10.1038/nature12198.
- Keller, A. A., S. Mcferran, A. Lazareva, and S. Suh, 2013. “Global Life Cycle Releases of Engineered Nanomaterials.” Journal of Nanoparticle Research 15 (6): 1–17. doi:10.1007/s11051-013-1692-4.
- Kessler, R. 2011. “Engineered Nanoparticles in Consumer Products: Understanding a NewIngredient.” Environmental Health Perspectives 119 (3): A120–A125. doi:10.1289/ehp.119-a120.
- Koh, A., F. D. Vadder, P. Kovatcheva-Datchary, and F. Bäckhed, 2016. “From Dietary Fiber to Host Physiology: Short-Chain Fatty Acids as Key Bacterial Metabolites.” Cell 165 (6): 1332–1345-1332–1345. doi:10.1016/j.cell.2016.05.041.
- Kong, G., K. L. Cao, L. M. Judd, S. Li, T. Renoir, and A. J. Hannan, 2020. “Microbiome Profiling Reveals Gut Dysbiosis in a Transgenic Mouse Model of Huntington's Disease.” Neurobiology of Disease 135: 104268. doi:10.1016/j.nbd.2018.09.001.
- Lamas, B., N. Martins Breyner, and E. Houdeau, 2020. “Impacts of Foodborne Inorganic Nanoparticles on the Gut Microbiota-Immune Axis: potential Consequences for Host Health.” Particle and Fibre Toxicology 17 (1): 19. doi:10.1186/s12989-020-00349-z.
- Larsen, N., F. K. Vogensen, F. W. J. van den Berg, D. S. Nielsen, A. S. Andreasen, B. K. Pedersen, W. A. Al-Soud, S. J. Sørensen, L. H. Hansen, and M. Jakobsen, 2010. “Gut Microbiota in Human Adults with Type 2 Diabetes Differs from Non-Diabetic Adults.” PLOS One 5 (2): e9085. doi:10.1371/journal.pone.0009085.
- Laukens, D., B. M. Brinkman, J. Raes, M. De Vos, and P. Vandenabeele, 2016. “Heterogeneity of the Gut Microbiome in Mice: guidelines for Optimizing Experimental Design.” FEMS Microbiology Reviews 40 (1): 117–132. doi:10.1093/femsre/fuv036.
- Le, K. A., Y. Li, X. Xu, W. Yang, T. Liu, X. Zhao, Y. G. Tang, et al. 2012. “Alterations in Fecal Lactobacillus and Bifidobacterium Species in Type 2 Diabetic Patients in Southern China Population.” Frontiers in Physiology 3: 496.
- Lee, J., J.-S. Jeong, S. Y. Kim, S.-J. Lee, Y.-J. Shin, W.-J. Im, S.-H. Kim, et al. 2019. “Safety Assessment of Cerium Oxide Nanoparticles: Combined Repeated-Dose Toxicity With Reproductive/Developmental Toxicity Screening Andbiodistribution in Rats.” Nanotoxicology 14 (5): 696–710. doi:10.1080/17435390.2020.1751322.
- Li, X., Y. Zhang, B. Li, J. Cui, N. Gao, H. Sun, Q. Meng, et al. 2019. “Prebiotic Protects against Anatase Titanium Dioxide Nanoparticles-Induced Microbiota-Mediated Colonic Barrier Defects.” NanoImpact 14: 100164. doi:10.1016/j.impact.2019.100164.
- Lim, M. Y., H. J. You, H. S. Yoon, B. Kwon, J. Y. Lee, S. Lee, Y. M. Song, K. Lee, J. Sung, and G. Ko, 2017. “The Effect of Heritability and Host Genetics on the Gut Microbiota and Metabolic Syndrome.” Gut 66 (6): 1031–1038. doi:10.1136/gutjnl-2015-311326.
- Liu, H., J. Wang, T. He, S. Becker, G. Zhang, D. Li, and X. Ma, 2018. “Butyrate: A Double-Edged Sword for Health?” Advances in Nutrition 9 (1): 21–29. doi:10.1093/advances/nmx009.
- Louis, P., and H. J. Flint, 2009. “Diversity, Metabolism and Microbial Ecology of Butyrate-Producing Bacteria from the Human Large Intestine.” FEMS Microbiology Letters 294 (1): 1–8. doi:10.1111/j.1574-6968.2009.01514.x.
- Maynard, A., and E. Michelson, 2005. The Nanotechnology Consumer Products Inventory. Woodrow Wilson International Center for Scholars.
- Mcmurdie, P. J., and S. Holmes, 2013. “Phyloseq: An R Package for Reproducible Interactive Analysis and Graphics of Microbiome Census Data.” PLOS One. 8 (4): e61217. doi:10.1371/journal.pone.0061217.
- Mu, W., Y. Wang, C. Huang, Y. Fu, J. Li, H. Wang, X. Jia, and Q. Ba, 2019. “Effect of Long-Term Intake of Dietary Titanium Dioxide Nanoparticles on Intestine Inflammation in Mice.” Journal of Agricultural and Food Chemistry 67 (33): 9382–9389. doi:10.1021/acs.jafc.9b02391.
- Murphy, E. F., P. D. Cotter, S. Healy, T. M. Marques, O. O'sullivan, F. Fouhy, S. F. Clarke, et al. 2010. “Composition and Energy Harvesting Capacity of the Gut Microbiota: relationship to Diet, Obesity and Time in Mouse Models.” Gut 59 (12): 1635–1642. doi:10.1136/gut.2010.215665.
- Neyrinck, A. M., S. Possemiers, W. Verstraete, F. De Backer, P. D. Cani, and N. M. Delzenne, 2012. “Dietary Modulation of Clostridial Cluster XIVa Gut Bacteria (Roseburia Spp.) by Chitin-Glucan Fiber Improves Host Metabolic Alterations Induced by High-Fat Diet in Mice.” Journal of Nutritional Biochemistry 23 (1): 51–59. doi:10.1016/j.jnutbio.2010.10.008.
- O'hara, A. M., and F. Shanahan, 2006. “The Gut Flora as a Forgotten Organ.” EMBO Reports 7 (7): 688–693. doi:10.1038/sj.embor.7400731.
- Oberdorster, G., E. Oberdorster, and J. Oberdorster, 2005. “Nanotoxicology: An Emerging Discipline Evolving from Studies of Ultrafine Particles.” Environmental Health Perspectives 113: 823–839.
- Paassen, N. B.-V., A. Vincent, P. J. Puiman, M. Van Der Sluis, J. Bouma, G. Boehm, J. B. Van Goudoever, I. Van Seuningen, and I. B. Renes, 2009. “The Regulation of Intestinal Mucin MUC2 Expression by Short-Chain Fatty Acids: implications for Epithelial Protection.” Biochemical Journal 420 (2): 211–219. 211–219. doi:10.1042/BJ20082222.
- Park, J. C., and S. H. Im, 2020. “Of Men in Mice: The Development and Application of a Humanized Gnotobiotic Mouse Model for Microbiome Therapeutics.” Experimental & Molecular Medicine 52 (9): 1383–1396. doi:10.1038/s12276-020-0473-2.
- Peng, L., Z. R. Li, R. S. Green, I. R. Holzman, and J. Lin, 2009. “Butyrate Enhances the Intestinal Barrier by Facilitating Tight Junction Assembly via Activation of AMP-Activated Protein Kinase in Caco-2 Cell Monolayers.” The Journal of Nutrition 139 (9): 1619–1625. doi:10.3945/jn.109.104638.
- Pietroiusti, A., A. Magrini, and L. Campagnolo, 2016. “New Frontiers in Nanotoxicology: Gut Microbiota/Microbiome-Mediated Effects of Engineered Nanomaterials.” Toxicology and Applied Pharmacology 299: 90–95. doi:10.1016/j.taap.2015.12.017.
- Pinget, G., J. Tan, B. Janac, N. O. Kaakoush, A. S. Angelatos, J. O'Sullivan, Y. C. Koay, et al. 2019. “Impact of the Food Additive Titanium Dioxide (E171) on Gut Microbiota-Host Interaction.” Frontiers in Nutrition 6: 57. doi:10.3389/fnut.2019.00057.
- Rico, C. M., S. Majumdar, M. Duarte-Gardea, J. R. Peralta-Videa, and J. L. Gardea-Torresdey, 2011. “Interaction of Nanoparticles with Edible Plants and Their Possible Implications in the Food Chain.” Journal of Agricultural and Food Chemistry 59 (8): 3485–3498. doi:10.1021/jf104517j.
- Ruiz-Rodriguez, P. E., D. Meshulam, and U. Lesmes, 2014. “Characterization of Pickering O/W Emulsions Stabilized by Silica Nanoparticles and Their Responsiveness to in Vitro Digestion Conditions.” Food Biophysics 9 (4): 406–415. doi:10.1007/s11483-014-9346-3.
- Schwab, M., V. Reynders, S. Loitsch, D. Steinhilber, J. Stein, and O. Schroder, 2007. “Involvement of Different Nuclear Hormone Receptors in Butyrate-Mediated Inhibition of Inducible NF Kappa B Signalling.” Molecular Immunology 44 (15): 3625–3632. doi:10.1016/j.molimm.2007.04.010.
- Schwiertz, A., D. Taras, K. Schafer, S. Beijer, N. A. Bos, C. Donus, and P. D. Hardt, 2010. “Microbiota and SCFA in Lean and Overweight Healthy Subjects.” Obesity 18 (1): 190–195. doi:10.1038/oby.2009.167.
- Snijders, A. M., S. A. Langley, Y. M. Kim, C. J. Brislawn, C. Noecker, E. M. Zink, S. J. Fansler, et al. 2017. “Influence of Early Life Exposure, Host Genetics and Diet on the Mouse Gut Microbiome and Metabolome.” Nature Microbiology 2 (2): 16221. doi:10.1038/nmicrobiol.2016.221.
- Sofranko, A., T. Wahle, H. J. Heusinkveld, B. Stahlmecke, M. Dronov, D. Pijnenburg, R. Hilhorst, K. Lamann, C. Albrecht, and R. P. F. Schins, 2021. “Evaluation of the Neurotoxic Effects of Engineered Nanomaterials in C57BL/6J Mice in 28-Day Oral Exposure Studies.” Neurotoxicology 84: 155–171. doi:10.1016/j.neuro.2021.03.005.
- Szentkuti, L., H. Riedesel, M. L. Enss, K. Gaertner, and W. Von Engelhardt, 1990. “Pre-Epithelial Mucus Layer in the Colon of Conventional and Germ-Free Rats.” The Histochemical Journal 22 (9): 491–497. doi:10.1007/BF01007234.
- Tamanai-Shacoori, Z., I. Smida, L. Bousarghin, O. Loreal, V. Meuric, S. B. Fong, M. Bonnaure-Mallet, and A. Jolivet-Gougeon, 2017. “Roseburia Spp.: A Marker of Health?” Future Microbiology 12 (2): 157–170. doi:10.2217/fmb-2016-0130.
- Turnbaugh, P. J., and J. I. Gordon, 2009. “The Core Gut Microbiome, Energy Balance and Obesity.” The Journal of Physiology 587 (17): 4153–4158. doi:10.1113/jphysiol.2009.174136.
- van den Brule, S., J. Ambroise, H. Lecloux, C. Levard, R. Soulas, P.-J. D. Temmerman, M. Palmai-Pallag, E. Marbaix, and D. Lison, 2015. “Dietary Silver Nanoparticles Can Disturb the Gut Microbiota in Mice.” Particle and Fibre Toxicology 13 (1): 38. doi:10.1186/s12989-016-0149-1.
- Vance, M. E., T. Kuiken, E. P. Vejerano, S. P. Mcginnis, M. F. Hochella, Jr., D. Rejeski, and M. S. Hull, 2015. “Nanotechnology in the Real World: Redeveloping the Nanomaterial Consumer Products Inventory.” Beilstein Journal of Nanotechnology 6: 1769–1780. doi:10.3762/bjnano.6.181.
- Verleysen, E., N. Waegeneers, F. Brassinne, S. De Vos, I. O. Jimenez, S. Mathioudaki, and J. Mast, 2020. “Physicochemical Characterization of the Pristine E171 Food Additive by Standardized and Validated Methods.” Nanomaterials 10 (3): 592. doi:10.3390/nano10030592.
- Vogt, N. M., R. L. Kerby, K. A. Dill-Mcfarland, S. J. Harding, A. P. Merluzzi, S. C. Johnson, C. M. Carlsson, et al. 2017. “Gut Microbiome Alterations in Alzheimer's Disease.” Scientific Reports 7 (1): 13537. doi:10.1038/s41598-017-13601-y.
- Wang, Y., and K. A. Lecao, 2020. “Managing Batch Effects in Microbiome Data.” Briefings in Bioinformatics 21 (6): 1954–1970. doi:10.1093/bib/bbz105.
- Wang, Z., G. Xiao, Y. Yao, S. Guo, K. Lu, and Z. Sheng, 2006. “The Role of Bifidobacteria in Gut Barrier Function after Thermal Injury in Rats.” Journal of Trauma 61: 650–657.
- Wilding, L. A., C. M. Bassis, K. Walacavage, S. Hashway, P. R. Leroueil, M. Morishita, A. D. Maynard, M. A. Philbert, and I. L. Bergin, 2016. “Repeated Dose (28-Day) Administration of Silver Nanoparticles of Varied Size and Coating Does Not Significantly Alter the Indigenous Murine Gut Microbiome.” Nanotoxicology 10 (5): 513–520. doi:10.3109/17435390.2015.1078854.
- Willemsen, L. E., M. A. Koetsier, S. J. Van Deventer, and E. A. Van Tol, 2003. “Short Chain Fatty Acids Stimulate Epithelial Mucin 2 Expression through Differential Effects on Prostaglandin E(1) and E(2) Production by Intestinal Myofibroblasts.” Gut 52 (10): 1442–1447. doi:10.1136/gut.52.10.1442.
- Williams, K., J. Milner, M. D. Boudreau, K. Gokulan, C. E. Cerniglia, and S. Khare, 2015. “Effects of Subchronic Exposure of Silver Nanoparticles on Intestinal Microbiota and Gut-Associated Immune Responses in the Ileum of Sprague-Dawley Rats.” Nanotoxicology 9 (3): 279–289. doi:10.3109/17435390.2014.921346.
- World Health Organization. 2010. FAO/WHO Expert Meeting on the Application of Nanotechnologies in the Food and Agriculture Sectors: Potential Food Safety Implications: Meeting Report. Rome: World Health Organization.
- Wostmann, B. S. 1981. “The Germfree Animal in Nutritional Studies.” Annual Review of Nutrition 1 (1): 257–279. doi:10.1146/annurev.nu.01.070181.001353.
- Wu, J., C. Li, J. Zhang, N. W. Menzies, P. M. Bertsch, P. Wang, and P. M. Kopittke, 2020. “Release of Silver from Nanoparticle-Based Filter Paper and the Impacts to Mouse Gut Microbiota.” Environmental Science: NANO 7 (5): 1554–1565. doi:10.1039/C9EN01387C.
- Wu, X., C. Ma, L. Han, M. Nawaz, F. Gao, X. Zhang, P. Yu, et al. 2010. “Molecular Characterisation of the Faecal Microbiota in Patients with Type II Diabetes.” Current Microbiology 61 (1): 69–78. doi:10.1007/s00284-010-9582-9.
- Yan, J., D. Wang, K. Li, Q. Chen, W. Lai, L. Tian, B. Lin, Y. Tan, X. Liu, and Z. Xi, 2020. “Toxic Effects of the Food Additives Titanium Dioxide and Silica on the Murine Intestinal Tract: Mechanisms Related to Intestinal Barrier Dysfunction Involved by Gut Microbiota.” Environmental Toxicology and Pharmacology 80: 103485. doi:10.1016/j.etap.2020.103485.
- Younes, M., G. Aquilina, L. Castle, K. H. Engel, P. Fowler, M. J. Frutos Fernandez, P. Furst, et al. 2021. “Safety Assessment of Titanium Dioxide (E171) as a Food Additive.” EFSA Journal 19: e06585.
- Zamankhan, F., V. Pirouzfar, F. Ommi, and M. Valihesari, 2018. “Investigating the Effect of MgO and CeO2 Metal Nanoparticle on the Gasoline Fuel Properties: empirical Modeling and Process Optimization by Surface Methodology.” Environmental Science and Pollution Research 25 (23): 22889–22902. doi:10.1007/s11356-018-2066-3.
- Zelante, T., R. G. Iannitti, C. Cunha, A. De Luca, G. Giovannini, G. Pieraccini, R. Zecchi, et al. 2013. “Tryptophan Catabolites from Microbiota Engage Aryl Hydrocarbon Receptor and Balance Mucosal Reactivity via Interleukin-22.” Immunity 39 (2): 372–385. doi:10.1016/j.immuni.2013.08.003.
- Zhang, J., Y. Nazarenko, L. Zhang, L. Calderon, K. B. Lee, E. Garfunkel, S. Schwander, et al. 2013. “Impacts of a Nanosized Ceria Additive on Diesel Engine Emissions of Particulate and Gaseous Pollutants.” Environmental Science & Technology 47 (22): 13077–13085. doi:10.1021/es402140u.
- Zhang, S., X. Jiang, S. Cheng, J. Fan, X. Qin, T. Wang, Y. Zhang, et al. 2020. “Titanium Dioxide Nanoparticles via Oral Exposure Leads to Adverse Disturbance of Gut Microecology and Locomotor Activity in Adult Mice.” Archives of Toxicology 94 (4): 1173–1190. doi:10.1007/s00204-020-02698-2.
- Zhang, Y., M. Mortimer, and L.-H. Guo, 2020. “Interplay between Engineered Nanomaterials and Microbiota.” Environmental Science: Nano 7 (9): 2454–2485. doi:10.1039/D0EN00557F.