
 ?Mathematical formulae have been encoded as MathML and are displayed in this HTML version using MathJax in order to improve their display. Uncheck the box to turn MathJax off. This feature requires Javascript. Click on a formula to zoom.
Abstract
The main role of mitochondria is to generate the energy necessary for the cell to survive and adapt to different environmental stresses. Energy demand varies depending on the phenotype of the cell. To efficiently meet metabolic demands, mitochondria require a specific proton homeostasis and defined membrane structures to facilitate adenosine triphosphate production. This homeostatic environment is constantly challenged as mitochondria are a major target for damage after exposure to environmental contaminants. Here we report changes in mitochondrial structure profiles in different cell types using electron microscopy in response to particle stress exposure in three different representative lung cell types. Endpoint analyses include nanoparticle intracellular uptake; quantitation of mitochondrial size, shape, and ultrastructure; and confirmation of autophagosome formation. Results show that low-dose aluminum nanoparticles exposure (1 ppm; 1 µg/mL; 1.6 × 1 0−7 µg/cell)) to primary and asthma cells incurred significant mitochondrial deformation and increases in mitophagy, while cancer cells exhibited only slight changes in mitochondrial morphology and an increase in lipid body formation. These results show low-dose aluminum nanoparticle exposure induces subtle changes in the mitochondria of specific lung cells that can be quantified with microscopy techniques. Furthermore, within the lung, cell type by the nature of origin (i.e. primary vs. cancer vs. asthma) dictates mitochondrial morphology, metabolic health, and the metabolic stress response of the cell.
Introduction
The primary role of mitochondria is to produce adenosine triphosphate (ATP) as an energy source through the process of oxidative phosphorylation (OXPHOS) (Brevini et al. Citation2005; Schousboe et al. Citation2011). The energy production within mitochondria is directly dependent upon the structural integrity of the inner and outer mitochondrial membrane as OXPHOS occurs along the inner membrane (i.e. cristae structure) through the electron transport chain (ETC). A homeostatic proton gradient requires an intact cristae structure to function properly (Rampelt et al. Citation2017). The energy demand of the cell is predetermined by its phenotype and mitochondrial morphology. Primary cells (i.e. cells taken from healthy tissue) are translatable to a healthy human as compared to immortalized cell lines; however, using diseased cell type models offer a unique opportunity to decipher variable outcomes after nanomaterial exposures in sensitive subpopulations (Kirkpatrick and Mittermayer Citation1990; Esch, Bahinski, and Huh Citation2015; Huang et al. Citation2009). For example, excess oxidative stress and inflammation in asthmatic epithelial cells have been shown to cause mitochondrial dysfunction earlier than in primary lung epithelial cells (Mabalirajan and Ghosh Citation2013; Cloonan and Choi Citation2016). Observations of mitochondrial ultrastructure link mitochondrial fission and fusion imbalance to the loss of cristae structure in the asthma cell phenotype (Mabalirajan and Ghosh Citation2013). Other studies have shown that lung cells with other phenotypes have different baseline characteristics inclusive of proliferation, over-expressed versus inactive biochemical pathways, antioxidant capacity, and cell cycle distributions – all of which effect toxicological responses (Lujan et al. Citation2019). Probing these cellular health indices will define the mitochondrial health of different cell types.
Mitochondrial activity and bioenergetics are tightly linked to morphology and internal cristae structure (Zick, Rabl, and Reichert Citation2009). Examining these structures microscopically can unveil endpoints related to mitochondrial dysfunction based on ultrastructural changes before versus after exposure to environmental contaminants. As a way to establish a method to link environmental exposures to induced mitochondrial stress, we developed an in vitro model consisting of a series of lung cells and low-dose aluminum nanoparticle exposure. Aluminum nanoparticles (AlNPs) are an emerging contaminant of concern and the focus of this study (Darlington et al. Citation2009). Aluminum nanoparticles less than 100 nanometers in diameter aerosolize easily, transport across large distances, and are frequently inhaled in occupational settings causing concern for pulmonary toxicity (Brar et al. Citation2010; Darlington et al. Citation2009). AlNPs are currently in formulations for surface coatings, high combustion fuel, and explosives because these materials promote increased energy release in combustion reactions, thermal stability, corrosion resistance, and increased plasmonic resonance as compared to bulk aluminum (Kim et al. Citation2012). Aluminum negatively impacts mitochondrial health and charged with increasing the onset of metabolic diseases; however, the extent of mitochondrial damage induced by AlNP exposure has yet to be investigated (Niu et al. Citation2005; Murakami and Yoshino Citation2004; Ghribi et al. Citation2001; Mirshafa et al. Citation2018).
Studies have shown that mitochondria are central targets of a large number of environmental contaminants (Dreier et al. Citation2019). In this study, we identified morphological fingerprints of mitophagy and mitochondrial dysregulation caused by induced stress (Zhang et al. Citation2010). Mitophagy is the selective degradation of healthy or damaged mitochondria to either regulate under normal conditions or isolate damaged mitochondria into membranes bound vesicles (Youle and Narendra Citation2011). The process of mitophagy then continues by selectively degrading damaged mitochondria via shuttling into autophagosomes for fusion with lysosomes (Youle and Narendra Citation2011). AlNPs were selected as a benchmark material for this scenario where we applied state-of-the-art transmission electron microscopy (TEM) and confocal laser scanning microscopy (CLSM) to uncover morphological profiles of mitochondria. The data presented in the paper are the first evidence of aluminum nanoparticles as inducers of mitophagy.
Results
Aluminum nanoparticle properties
The aluminum nanoparticles used in this study have distinct physical and chemical properties as dry powders, particle suspension in ultrapure water, and as particle suspension in DMEM/F12 media (i.e. the cell culture medium used in these studies). The primary particle size as measured by transmission electron microscopy images is 92.2 nm. In ultrapure water and culture media, the dispersity index indicates that the nanoparticles are disperse with an average hydrodynamic diameter of 455 and 1340 nm, respectively. The zeta potential of 8.44 mV in ultrapure water and 1.89 mV in culture media is indicative of particle instability in suspension. The physicochemical properties change when the nanoparticle powders are suspended in ultrapure water and in cell culture media. This phenomenon is common among most metal and metal oxide nanoparticles (Shannahan et al. Citation2013; Zyuzin et al. Citation2016; Mulenos et al. Citation2020; Warheit et al. Citation2007; Sayes et al. Citation2009).
Heterodisperse aluminum nanoparticles induce mitophagy
The mechanism of mitochondrial dysregulation, along with the physicochemical properties of aluminum nanoparticles, is shown in . The polydisperse nature of aluminum nanoparticles (AlNPs) enables three different ways that nanoparticles can enter a cell. Individual nanoparticles can passively diffuse across the cytoplasmic membrane where nano particles less than 30 nm in diameter can undergo clathrin and caveolin mediated uptake and nanoparticles greater than 200 nm undergo phagocytosis and macro-pinocytosis (Davda and Labhasetwar Citation2002; Lujan and Sayes Citation2017) (Stern, Adiseshaiah, and Crist Citation2012; Twig and Shirihai Citation2011; Panariti, Miserocchi, and Rivolta Citation2012; Berg et al. Citation2010). Aggregates of nanoparticles are shuttled into the cell in a vesicle that is then fused with a lysosome. Within the lysosome nanoparticles become ionized due to the acid environment (Stern, Adiseshaiah, and Crist Citation2012). Degraded nanoparticles, resultant ion, and even individual nanoparticles (<20 nm in size) interact with mitochondria causing the induction of fission and fusion leading to mitophagy (Twig and Shirihai Citation2011).
Figure 1. Mechanisms of mitochondrial dysregulation after aluminum nanoparticle exposure. The hypothesized mechanism (A) shows the different routes of uptake and the possible pathway of aluminum nanoparticle toxicity to mitochondria. Steps along the pathway are denoted within the figure that visualize the step in the pathway. TEM micrographs of aluminum nanoparticles (B) show an average size of around 92.2 nm with different sizes due to agglomeration. Table (C) reports the physicochemical properties of the aluminum nanoparticles as a dry powder, as a particle suspension in ultrapure water, and as a particle suspension in DMEM/F-12 (i.e. the cell culture media used in these studies). In ultrapure water and culture media, the dispersity index indicates that the nanoparticles are disperse with an average hydrodynamic diameter of 455 nm and 1340 nm, respectively. The zeta potential of 8.44 mV in ultrapure water and 1.89 mV in culture media is indicative of particle instability in suspension. The purity of the nanoparticles was confirmed via ICP-MS to be 99.99% pure aluminum. Scale Bar = 100 nm.
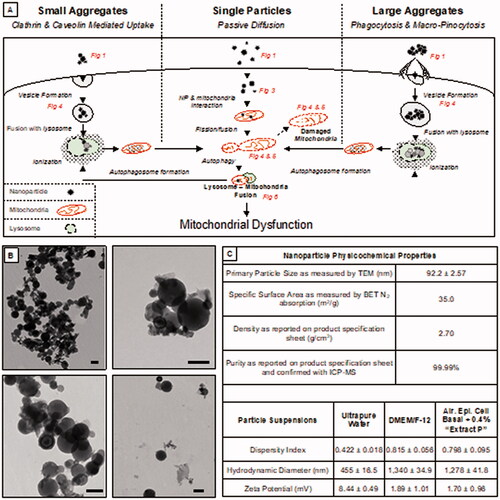
Each of these steps in the loop () - ranging aluminum exposure to mitochondrial dysfunction - was examined using microscopy techniques. The physicochemical characteristics of AlNPs were characterized before and after exposure to cells in culture. Before exposure, dynamic light scattering was used to measure the dispersity index (0.422 ± 0.018) which indicated a moderately disperse size population (i.e. value could range 0 to 1, where 0 indicates monodispersity and 1 indicates a highly heterogenous mixture). Dispersity index of nanoparticle suspensions as measured by dynamic light scattering was related to primary particle size of nanopowders as measured by transmission electron microscopy (TEM) (), where the average size of aluminum nanoparticles was 92.2 ± 2.57 nm. The hydrodynamic diameter was 455.77 ± 16.47 nm, indicating a high level of particle agglomeration. This was due to the hydrophobic nature of the nanopowder being force suspended in ultrapure water. Zeta potential was 8.44 ± 0.49 mV indicating colloidal instability (i.e. values >30 mV or <-30 mV indicate stability; values between −30 and 30 mV indicate instability). The particles were measured as 99.99% pure aluminum via inductively coupled plasma-mass spectrometry (). Taken together, the characteristics of the AlNPs demonstrate instability in solution and varied sizes that follow the proposed pathway in .
Primary, cancer, and asthma lung cell types exhibit differential mitochondrial morphologies
Representative transmission electron micrographs depicting the typical morphologies of mitochondria in primary (PTBE), cancer (A549), and asthma (DHBE-As) lung cell lines are shown in . Quantitative analyses of micrographs reveal differences in the size (i.e. diameter) and shape (i.e. roundness) among the different cells. Mitochondrial roundness was measured as a ratio of length to width, where x = 0 is representative of a perfect circle, 0 < x ≥ 0.4 represents an oval shape, and 0.4 < x > 1 represents an elongated shape. display mitochondrial roundness as either a histogram showing the frequency of the measured shapes or a box plot to visualize the distributions among the ratios. display the diameter measurements (i.e. the value used for length in the roundness measurements) of mitochondria, also as a histogram and a box plot. In regard to the box plots, the ends of each box represent 25 and 75% of the distributions, while the middle line represents the median. The whiskers show the minimum and maximum values measured and the symbols represent outlier values as defined by the Tukey method.
Figure 2. Characterization of mitochondrial morphology in untreated primary, cancer, and asthma lung cell types. TEM micrographs visualizing the typical baseline morphology of mitochondria are shown for (A) primary, (B) cancer, and (C) asthma cell types. The micrograph shows representative mitochondria with arrows indicating the unique morphologies seen in each cell type. Mitochondrial roundness (length and width ratio) is displayed through histograms (D) and corresponding boxplot (E). Compared to the primary cells, mitochondria in the cancer cells tend to be rounder while asthma cells have elongated mitochondria. Mitochondrial length is also displayed as a histogram (F) and boxplot (G). Compared to the primary cell type, mitochondria in cancer cells have a longer diameter and mitochondria in asthma cells have a longer diameter than the cancer cell type. *p ≤ 0.05; ****p ≤ 0.0001 versus control (primary cell type). The symbols above the box plots (i.e. circles, squares, and triangles) represent outliners as defined by the Tukey method. Scale bar = 500 nm.
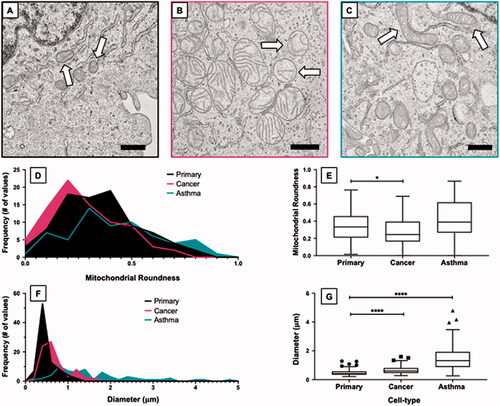
All three cell types have varied distributions in their size and shape. The primary cell type was seen to be the smallest in diameter (0.49 ± 0.02 µm), most of which were oval in shape (0.35 ± 0.02). When compared to the primary cell type, mitochondria within the cancer cells were significantly larger in diameter (0.68 ± 0.03 µm) where most of which were significantly more circular in shape (0.28 ± 0.02). In comparison to the primary cell type, the asthma cell type possessed the significantly longest mitochondria (1.59 ± 0.12 µm). Interestingly, the shape of asthma cell type mitochondria was not significant when compared to either the primary or cancer cells (0.42 ± 0.03). Data was corroborated through the Brown-Forsythe ANOVA test comparing shape and size. The p-values of 0.002 and <0.0001 for shape and size denote highly statistically significant differences in the morphology of mitochondria within the three cell types. All values, standard error of the mean (SEM), and p values from this analysis are cataloged in .
Table 1. Statistical analysis of mitochondrial size and shape among different cell types.
Uptake of aluminum nanoparticles
Enhanced darkfield hyperspectral imaging was used to confirm the uptake of AlNPs in primary, cancer, and asthma cell types. shows images of each cell exposed to AlNPs (1 ppm) and corresponding hyperspectral analysis. Over 30 regions of interest (ROIs) were selected of nanoparticles taken up into the cells. Nanoparticle spectra of lower wavelengths (520 nm and below) indicate discrete individual particles, while spectra of higher wavelength (720 nm and above) indicate agglomerated nanoparticles intracellularly (Mortimer et al. Citation2014; Zucker et al. Citation2019). Primary and asthma cell types internalize individual and agglomerated AlNPs as seen in the Gaussian-like distribution around 500 nm. Cancer cell type primarily internalize agglomerated AlNPs as seen in the predominant right shouldered spectrum.
Figure 3. Confirmation of aluminum nanoparticle intracellular internalization. Enhanced Dark-field microscopy was used to determine a region of interest (ROI) in all three cell lines (A–C). Hyperspectral imaging is presented (D–F) as spectra from aluminum nanoparticles exposed to the cells. From this data we can confirm the uptake of aluminum into the cells and be able to understand its phase and quantity. Aluminum in primary and asthma cells seem to be a mixture of discrete and agglomerated particles, at 520 and 720 nm, respectively. There is a Gaussian-like distribution between the wavelengths indicating that there are multiple forms. Aluminum in the cancer cells contains more agglomerated particle forms due to the right shoulder.
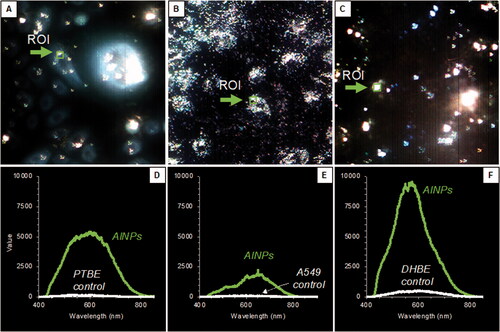
The intensity of the peak, or peak height, is related to the concentration of nanoparticles. Asthma cells internalized the most nanoparticles whereas cancer cells had the least amount of uptake in the cells which can be seen in the peak height in the spectra. This could be due to different uptake mechanisms among the different cell types.
Mitochondrial morphology is altered after aluminum nanoparticle exposure
show representative mitochondrial features of each cell type exposed to 1 ppm (1.6 × 10⁻⁷ µg/cell) of AlNPs for 24 hours. Each cell type incurred different morphological changes that were identifiable via TEM. The shape of mitochondria in each cell type is displayed in as the mean shape of mitochondria for the primary, cancer, and asthma cell types clustered around 0.40 ± 0.03, 0.35 ± 0.02, and 0.35 ± 0.02 representing an oval shape. The difference in average shape of mitochondria amongst each cell type was not significant.
Figure 4. Morphological changes in mitochondria among aluminum nanoparticle treated cell types. TEM micrographs visualizing morphology of mitochondria after exposure to aluminum nanoparticle are shown for (A) primary, (B) cancer, and (C) asthma cell types. The arrows in each image point to characteristic changes in each cell. Primary cells experience an increase in membrane bound vesicles and elongated mitochondria. Cancer cells have decreased cristae integrity and the presence of lipid bodies. Asthma cells have an increase in membrane bound vesicles and decrease in the size of mitochondria. Mitochondrial roundness is displayed through histograms (D) and corresponding boxplot (E). Compared to the primary cells, mitochondria in each cell type cluster around the same shape with the primary cells having an increase in elongated mitochondria. Mitochondrial length is also displayed as a histogram (F) and boxplot (G). Compared to the primary cell type, mitochondria in cancer cells have a slightly longer diameter and mitochondria in asthma cells have a longer diameter than the cancer cell type. *p ≤ 0.05; ***p ≤ 0.001 versus control (Primary cell type). The symbols above the box plots (i.e. circles, squares, and triangles) represent outliners as defined by the Tukey method. Scale bar = 500 nm.
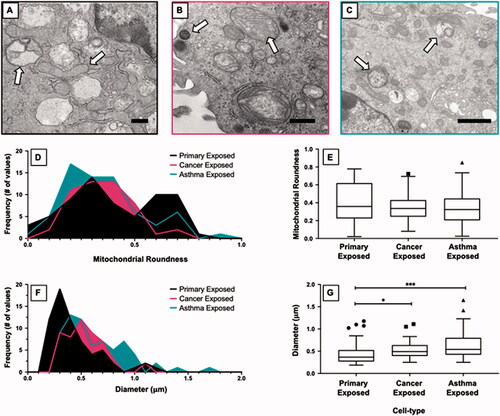
The mitochondrial diameter in each cell type is shown in . The mean mitochondrial diameter of the primary, cancer, and asthma cell types were 0.43 ± 0.03 µm, 0.53 ± 0.03 µm, and 0.63 ± 0.04 µm, respectively. Compared to the primary cell type, the cancer and asthma cells possessed larger mitochondria (asthma cell mitochondria were significantly larger than primary cell mitochondria). Data was corroborated through the Brown-Forsythe ANOVA test. The shape of mitochondria was not significantly different (p value of 0.2023), but the maximum diameter was highly significantly different among the three cell types. This indicates that exposure to aluminum nanoparticles caused mitochondria to regulate into different sizes. This could be an indicator of a shift in energy demand of the cell when stressed by an exogenous material as it relates to disease state. All values, SEM, and P values are shown in .
Mitochondria in primary, cancer, and asthma cells respond differently to aluminum nanoparticle exposure
The mitochondrial roundness and diameter of mitochondria before and after exposure to AlNPs in each cell type is summarized in . The boxplots in tabulate the data shown in . Mitochondria in the primary and cancer cell types experienced a 14.89% and 26.24% increase in elongation of mitochondria, respectively, while mitochondria in the asthma cell type experienced a 15.90% shift toward more circular shaped mitochondria. The change in average mitochondrial roundness within the cancer cells was significant (p value of 0.007) as calculated via Welch’s t test.
Figure 5. Cross comparisons within each cell type before and after aluminum nanoparticle exposure. Comparisons between the mitochondrial roundness of each cell type is shown as a box plot (A) and histograms (C). The primary and cancer cells both experienced a shift toward slightly more elongated mitochondria compared to their baseline while the asthma cells experienced a shift toward more circular mitochondria. Comparisons between the length of mitochondria in each cell type is shown as a box plot (B) and histograms (D). In general, each cell type experienced an overall decrease in the length of their mitochondria with the cancer and asthma cells experiencing the largest decreases. **p ≤ 0.01; ***p ≤ 0.001; ****p ≤ 0.0001 versus control (Primary cell type). The symbols above the box plots (i.e. circles, squares, and triangles) represent outliners as defined by the Tukey method.
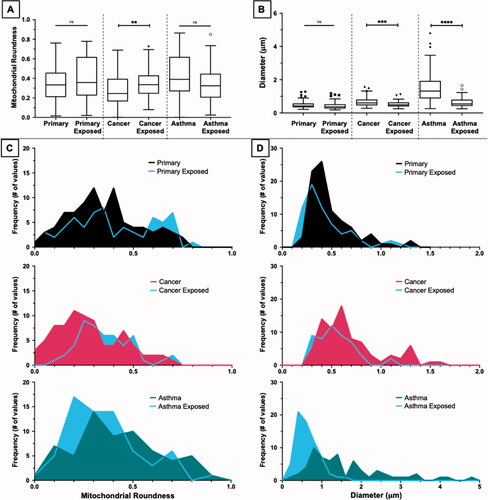
The boxplots in tabulate the data shown in . After exposure, the diameter of mitochondria within each cell type decreased. Mitochondria within the primary cell type decreased by 10.46%; mitochondria within the cancer cells decreased by 22.19%; and mitochondria within the asthma cells decreased by 60.39%. The decrease in the average length of the mitochondria diameter in the cancer and asthma cell types were found to be highly significant (p value of 0.0005 and <0.0001, respectively) as seen in the Welch’s t test. Lastly, primary cells did not incur mitochondrial changes in the average size or shape, while the other two cell types did. All roundness ratios, diameters, SEM, and p values are shown in .
Table 2. Statistical analysis of mitochondrial size and shape before versus after aluminum nanoparticle exposure among different cell types.
Exposure to aluminum nanoparticles triggers mitochondria and lysosome interactions
Fluorescent images of primary, cancer, and asthma cells before and after exposure to AlNPs were captured in an effort to compare the overlap of the fluorescently tagged mitochondria and lysosomes. shows the images and the associated scatterplot and overlap coefficient values (M1 and M2). The overlap, or colocalization, of the red dye (MitoTracker Red CM-H2Xros) and the green dye (lysosomal associated membrane protein 1 (LAMP1) were designed to examine the interaction of mitochondria and lysosomes because the close proximity between and encapsulation of mitochondria within lysosomes is a crucial step in mitophagy, i.e. the mitochondrial degradation pathway. Colocalization analysis measures the spatial overlap of two dyes of interest. The bright white color in the images represents the areas in the cell where the green (lysosomes) and red (mitochondria) dye colocalize in the same location. M values are denoted in where the open green circle (M1) represents the lysosomal dye, and the closed red circle (M2) represents the mitochondrial dye.
Figure 6. Colocalization of lysosomes and mitochondria. Fluorescent images of primary, cancer, and asthma cells before and after exposure to AlNPs (1 ppm; 1.6 × 1 0 −7 µg/cell) were captured to compare the overlap of the mitochondrial and lysosomal dyes. Scatterplot data from colocalization analysis as well as M1 and M2 values are also shown (A). The blue dye (Hoechst 33342) stains the nucleus, the red dye (MitoTracker Red CM-H2Xros) accumulates in mitochondria, and the green dye (CellLight Lysosomes-GFP) is transduced into the cell and targets lysosomal associated membrane protein 1 (LAMP1). The bright white color represents the areas in the cell where the green (lysosomes) and red (mitochondria) dye colocalize in the cell above the set threshold. These overlap coefficients before and after exposure are visualized in the graph (B). Before exposure small amount of colocalization occur in each cell type with the asthma cells having a small amount of colocalization before exposure. After exposure colocalization increases in the primary and asthma cells while cancer cells do not experience a significant increase. Scale bar = 20 µm.
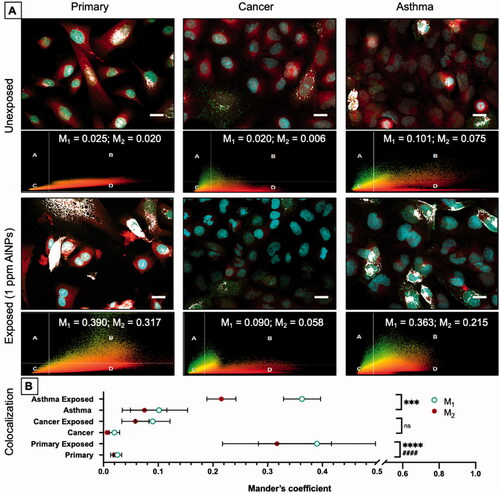
An ordinary two-way ANOVA showed that there is a highly significant interaction between cell types with a p value of <0.0001, which indicates that the cell type determines the degree of colocalization in the two selected dyes. This interaction was followed by a Tukey’s honestly significant difference (HSD) test to investigate statistical significance between means of the same cell type before and after exposure to aluminum nanoparticles. The colocalization of both M1 and M2 in primary cells are highly significant as each had a p value of <0.0001. There was no significant difference in colocalization in the cancer cell lines. Asthma cells incurred an increase in M1 and M2, however only the change in M1 (lysosome) was significant with a p value of 0.005. The results of the Tukey’s HSD test are outlined in .
Discussion
The baseline mitochondrial morphologies of each cell type, even when grown under the same cell culture parameters, demonstrate different mitochondrial morphology profiles that need to be considered within in vitro studies. The differences in the size and shape of mitochondria are attributed to the phenotype of the cell and will influence studies aimed at uncovering mechanisms of mitochondrial dysregulation. The variations in mitochondrial size and shape among the different cell lines before exposure is a novel finding that connects in vitro to in vivo mitochondrial morphologies.
Studies have found that different cell types (i.e. healthy versus cancer derived) will differential uptake macro and nano sized particles (Patiño et al. Citation2015). Once in the cells, nanoparticles interact with mitochondria causing damage and induce increased fission or fusion. The damaged mitochondria are isolated and fused with a lysosome for degradation. The damaged mitochondria can contain nanoparticles that will then ionize within the acidic vesicle. The cycle of nanoparticle uptake, mitochondrial damage, and isolation within acidic vesicles creates a positive feedback loop of continued mitophagy. This was seen in the hyperspectral analysis as larger clusters of particles were seen in the primary and asthma lung cell images (i.e. the bright clusters with shape peaks) which correlates the increased levels of mitophagy seen in the two cells lines while the lower concentration of particles seen in the cancer cells (i.e. more dispersed particles with weak signal) explain the reduced impact on mitochondrial morphology of the cell. Differential nanoparticle uptake among the cell types was able to be visualized through HSI indicating the cells will experience varying levels of mitotoxicity.
After exposure to aluminum nanoparticle, mitochondria within primary cells seem strictly regulated to a specific morphology while mitochondria in other cell types are more fluid. Specifically, the decreased size of mitochondria in the cancer and asthma cell types (due to increased fission) is associated with mitochondrial dysfunction (Jheng et al. Citation2012). The increased fragmentation of mitochondria (i.e. fission) is likely due to aluminum nanoparticle exposure and subsequent increased in reactive oxygen species. Other studies have found that increased ROS is implicated in fragmenting mitochondria (Wu et al. Citation2011). Visualizing cellular ultrastructure with TEM before and after exposure revealed that mitochondria from each cell type respond differently to stress causing completely different cellular morphological outcomes. Additionally, confocal laser scanning microscopy showed that stress induced mitophagy is most apparent in the primary cell population as the overall morphology changed and there is a large increase in colocalization of mitochondria and lysosomes. Primary and asthma cells are the most affected from exposure to AlNPs while the cancer cell population shows no noticeable sings of change in the fluorescent images.
There is evidence that changes in mitochondria shape and size over time generally translates to changes in bioenergetic activity (Yu, Wang, and Yoon Citation2015). Shape changes generally correspond to changes in ROS levels and altered energy production (Yu, Robotham, and Yoon Citation2006). Alterations in mitochondrial morphology results in decreased cellular metabolism which accelerates aging, apoptosis, and autophagy (Karbowski and Youle Citation2003; Sastre et al. Citation2000). Therefore, if exposure to aluminum nanoparticles changes mitochondria shape, then exposure to AlNPs can induce mitophagy, decrease ATP production, and decrease metabolism.
The novel characterization of subtle changes in mitochondrial morphology in response to nanoparticle exposure is a critical key event (KE) that should be included in adverse outcome pathway (AOP) frameworks. AOPs organize biological and toxicological data into a mechanistic representation of pertinent KEs among different levels of biological organization (Terron et al. Citation2018; Mcminn, Duval, and Sayes Citation2019). AOPs have been developed that highlight effects on mitochondria (e.g. complex efficiency, membrane potential, and/or oxygen consumption) (Delp et al. Citation2021) (Song and Villeneuve Citation2021). However, few AOPs describe changes in mitochondrial structure as part of the framework. As demonstrated in this paper, particle exposure may elicit changes in mitochondrial shape and size that can be incorporated into mitochondria specific AOPs as KEs that may better outline the progression from molecular initiating event to adverse outcome.
Taken together, exposure to AlNPs resulted in (1) all cell types having oval shaped mitochondria, (2) primary cells with the same mitochondrial diameter before and after exposure, but with a large increase in mitophagy, (3) cancer cells with decreased mitochondrial diameter with no increase in mitophagy, and (4) asthma cells had decreased mitochondrial diameter and also experienced in increase in mitophagy. This data suggests that (A) primary cells readily undergo mitophagy to avoid excess mitochondrial damage, (B) cancer cells mitigate mitochondrial damage by increasing fission and altering metabolism (i.e. lipid bodies) to avoid mitophagy, and (C) asthma cells are most susceptible to mitochondrial damage due to the increase in both fission and mitophagy that was seen. The different endpoints that were measured via TEM and fluorescent microscopy highlights the importance of the microscopic analysis conducted for each cell type.
Conclusion
We have shown that exposure to aluminum nanoparticles to lung cells with different phenotypes can generate mitochondrial specific adverse health effects. This data highlights the importance of probing endpoints beyond general live: dead cell counts. In this study, microscopy was used to visualize the interactions between aluminum nanoparticles and mitochondria, alterations in mitochondrial morphology, and progression of mitophagy. Resulting data sets support the conclusions drawn, which was to demonstrate the importance of microscopy techniques in nanotoxicology studies. Aluminum nanoparticles induced measurable changes in mitochondrial morphology in three different lung cell types and these changes could manifest into physiological consequences of lung tissue.
Within the lung, changes in mitochondrial health and morphology have recently become a major element in understanding pathogenesis or progression of lung specific diseases such as asthma, chronic obstructive pulmonary disease (COPD), and cancer (Cloonan and Choi Citation2016). The data presented in this paper demonstrates that the ultrastructural integrity of mitochondria can be visualized by transmission electron microscopy, confocal laser scanning microscopy (CLSM), and hyperspectral imaging; data generated from these techniques can be quantified and used as indicators of effect. Microscopy based analysis can be complemented by other functional assays such as fluorescence activated cell sorting or extracellular flux analysis where multiple population level mitochondria health endpoints can be probed, simultaneously (Puleston Citation2015).
Mitophagy was visualized in the TEM images as membrane bound vesicles. Vesicle formation was corroborated via CLSM imaging and colocalization analysis. Images showed vesicles that range in appearance from small structures void of contents to larger autophagosomes containing degrading cellular material. We interpreted this as aluminum nanoparticle damaged mitochondria shuttled into autophagosomes to fuze with lysosomes for degradation. This phenomenon was confirmed via CLSM where stains targeted the overlap of mitochondria and lysosomes; aluminum nanoparticle exposure caused an increase in colocalization of both dyes.
TEM length and width analysis of cells cultured under control growth conditions revealed that primary, cancer, and asthma cells have different mitochondrial morphologies before AlNP treatment, but mostly tend to be slightly oval in shape. The primary cells have the highest abundance of oval mitochondria, cancer cells are more circular in nature, and asthma cells range from oval to highly elongated mitochondria. Interestingly, the only instance of lipid body formation was found in the cancer cell type exposed to aluminum nanoparticles. Currently, new studies have begun to uncover how lung cancer cells utilize their altered metabolism and generation of lipid bodies to suppress organelle damage (i.e. mitochondria) and apoptosis (Jin and Yuan Citation2020). The differences in mitochondrial morphologies can be explained by the differences in disease phenotypes that alter the normal energy demand of the cell ().
Table 3. Linking morphological changes to physiological consequences of altered mitochondrial properties.
Visualization and analysis of cellular ultrastructure by TEM is an unparalleled technique that depicts changes in morphology that would otherwise go unnoticed. Due to the strong link between mitochondrial ATP production efficiency and mitochondrial structure, it is imperative that structural analysis of mitochondria be included in toxicological assessments. Additionally, it is important to include different phenotypes in respiratory health studies as they have increased susceptibility to metabolic dysfunction from exposure to environmental stressors that target and damaging mitochondria (Wei et al. Citation2016). Mitochondrial damage has a wide range of negative consequences that include reduced bioenergetics and cell death at the cellular level as well as Alzheimer’s disease, Parkinson’s disease, chronic fatigue, diabetes, and obesity at the organism level (Kowaltowski and Vercesi Citation1999; Chattopadhyay et al. Citation2015). The information gleamed from microscopy analysis provide insight into mitochondrial and overall cell health and interpretations can be combined with biochemical analysis to produce a more complete picture of metabolic perturbations after exposure to environmental contaminants.
Methods
Experimental design
The approach to this study was to detect and measure changes in mitochondrial structure using three different lung cell types and compare baseline to aluminum nanoparticle exposed cells using transmission electron microscopy (TEM). Assessments were conducted using primary tracheal bronchial epithelial cells (PTBE), human lung epithelial carcinoma (A549) cells, and asthma diseased human bronchial/tracheal epithelial (DHBE-As) cells. PTBE cells (PCS-300-010, American Type Culture Collection (ATCC); Manassas, Virginia, USA) were cultured using airway epithelial cell basal medium (ATCC) supplemented as detailed by ATCC (additive of 0.4% “Extract P” solution of proteins). A549 cells (CCL-185, ATCC) and DHBE-As cells (00194911, Lonza; Basel, Switzerland) were cultured using a 1:1 mixture of Dulbecco's Modified Eagle's Medium and Ham's F-12 Nutrient Mixture (DMEM/F12; Gibco, Waltham, Massachusetts, USA) supplemented with 10% fetal bovine serum (FBS; Equitech-Bio, Inc. Kerrville, Texas, USA) and 1% antibiotic cocktail of Penicillin-Streptomycin (MP Biomedical; Solon, Ohio, USA). All cells were cultured at 37 °C in an air-jacketed humidified incubator with 5% CO2. The physicochemical properties of the aluminum nanoparticles were characterized before exposure. All exposure scenarios were carried out for 24 hr at a concentration of 1 ppm (1.6 × 10⁻⁷ µg/cell). The concentration of 1 ppm was used to represent a low dose exposure that perturbed mitochondrial morphology while avoiding cell death.
Nanoparticle physicochemical characterization
A stock suspension of aluminum nanoparticles (50 nm particle size; SkySpring Nanomaterials, Inc., Houston, Texas, USA) was generated by mixing the nanoparticles in ultrapure water at a concentration of 100 ppm. The resultant nanoparticle suspension was produced and sonicated at 37 kHz for 10 min immediately before exposure to cells at a final concentration of 1 ppm (1 µg/mL; 1.6 × 10⁻⁷ µg/cell).
For dynamic light scattering analyses, the stock suspension was diluted in ultrapure water in a ratio of 1:2 to generate a 50 ppm concentration solution. The sample was loaded into a 1060-folded capillary zeta cell and analyzed for hydrodynamic size, dispersity index, and zeta potential using a ZetaSizer (Malvern Pananalytical; Malvern, United Kingdom). Hydrodynamic diameter and dispersity index analyses were performed with 11 replicates in triplicate while zeta potential measurements were performed with 50 replicates ran in triplicate.
For electron microscopy analysis, approximately 10 μL of the aluminum nanoparticle stock suspension was placed onto a copper grid with formvar/carbon film 200 nm for 5 min (Electron Microscopy Sciences; Hatfield, Pennsylvania, USA). The nanoparticles were air-dried before image analysis on a JEM-1010 TEM (JEOL Inc.; Tokyo, Japan). Post imaging analysis of nanoparticle size was performed using the line tool in ImageJ (version 1.53e) calibrated to the scale bar that accompanied each original image.
Nanoparticle exposure to cell culture
The cells were grown in 6-well cell culture plates (Thermo Fisher, Waltham, Massachusetts, USA) at a seeding density of 40,000 cells/cm2 and exposure occurred when the cells were between 70-80% confluent (most commonly 24-36 h post seeding). As described in the experimental design section, the physicochemical properties of the aluminum nanoparticles were characterized before exposure. All exposure scenarios were carried out for 24 hr at a concentration of 1 ppm (1.6 × 10⁻⁷ µg/cell). The full dose-response relationship indicated that the LC50 value of these nanoparticles against the cells was ∼20 ppm, depending on cell-type (data not shown).
Dosimetry
The following equation was used to calculate the approximate nanoparticle mass per cell:
(1)
(1)
Where dose is 1 µg/mL, growth area is 9.6 cm2, confluency is 80% (unitless), and the average surface area of a lung cell is 1.28 × 10⁻⁶ cm2 (Jiang, Shen, and Piao Citation2010). The resultant value for this study was 1.6 × 10⁻⁷ µg/cell.
Cell preparation for TEM image analyses
PTBE, A549, and DHBE cells were treated with 1 ppm aluminum nanoparticle suspension for 24 h. The inoculated cell culture media was then removed and the cells were rinsed with phosphate buffered saline (PBS; Gibco) prior to collection. The samples were then collected after incubation by placing trypsin onto the cells for 5 min at 37 °C and then equal parts media was added to the cells to neutralize the trypsin. The collected cell suspension was then centrifuged at 200 g for 5 min to create a pellet. The supernatant was replaced with a 2.5% glutaraldehyde solution (Electron Microscopy Sciences; Hatfield, Pennsylvania, USA) in a pH 7.2 adjusted 0.1 M sodium cacodylate buffer (Electron Microscopy Sciences) and cells were fixed for 30 min. The glutaraldehyde solution was removed and the pellet was washed with cacodylate buffer three times for 10 min each wash.
The cells were then subjected to secondary fixation for 30 min. Fixation was performed with a solution of 1% osmium tetroxide, 0.1 M cacodylate buffer, 3 mM calcium chloride, and 0.8% potassium ferrocyanide (Electron Microscopy Sciences). The solution was removed and the cells were washed with cacodylate buffer three times for 10 min each. Post-fixation staining was then carried out in 1% uranyl acetate (Electron Microscopy Sciences) for 30 min after washing with cacodylate buffer. The samples were washed and dehydrated in a series of increasing concentrations of acetone. This dehydration series consisted of two incubations in 50% acetone in de-ionized water for 10 min, two incubations in 70% acetone in de-ionized water for 10 min, two incubations in 90% acetone in de-ionized water for 15 min, and two incubations in 100% acetone for 15 min.
An Embed 812 epoxy resin was then prepared using Embed 812, dodecenylsuccinic anhydride (DDSA), methyl nadic anhydride (MNA), and benzyldimethylamine (BDMA) (Electron Microscopy Sciences) as the accelerant. The samples were then infiltrated with increasing concentrations (1:2, 1:1, 2:1) of the Embed 812 resin and acetone. The samples were then placed in 100% Embed 812 resin and pelleted in preparation of polymerization (incubation in 60 °C oven for 48 h). Following polymerization, the blocks were trimmed, sectioned, and placed on copper mesh grids. Post-staining was performed with lead citrate (Electron Microscopy Sciences) for 5 min, and 1% uranyl acetate for 15 min. The grids were then imaged with a TEM (JEM-1010; JEOL Inc., Tokyo, Japan)
Hyperspectral imaging
All cell types were seeded and incubated into one of 4 wells of a chamber slide (Lab-Tek II, Rochester, New York) for 24 h to allow adhesion and acclimation. Cells were treated with 1 ppm aluminum nanoparticle suspension for 24 h. The cells were washed three times prior to fixation, permeabilized as described in the Image-it Fix-Perm kit (Molecular Probes, Eugene, Oregon, USA), and stained with ActinGreen 488 ReadyProbes and NucBlue Live ReadyProbes (Invitrogen). Each well was washed with phosphate buffered saline (PBS) three more times and fixed with two drops of ProLong Diamond Anti-fade Mountant (Molecular Probes). A glass cover slip was carefully placed on the slide and set for 24 h. Fluorescent images of the cells were first used to focus on the sample before switching to hyperspectral imaging (CytoViva Inc., Auburn, Alabama, USA) with the accompanying ENVI software (Advanced Scientific Camera Control Version 1.0).
Cell preparation for confocal laser scanning microscopy
All cells types were seeded and incubated into a 4 well chamber slide (Lab-Tek II, Rochester, New York) for 24 h to allow adhesion and acclimation. Cells were treated with 1 ppm (1.6 × 10⁻⁷ µg/cell) aluminum nanoparticle suspension for 24 h. At the same time the cells were incubated with 30 particles per cell of Lysosomes-GFP (molecular probes) reagent (12 µL). The cells were then washed, fixed, and permeabilized as described in the Image-it Fix-Perm kit (Molecular Probes, Eugene, Oregon). Staining of the nucleus and mitochondria was then carried out by adding MitoTracker Red CM-H2XRos and NucBlue Live Cell Stain Ready Probes reagent (Molecular Probes) for 15 min at room temperature. Each well was then washed with PBS solution three more times and fixed with two drops of ProLong Diamond Anti-fade Mountant (Molecular Probes). A glass cover slip was then carefully placed on the slide and set for 24 h. Each of the steps were conducted away from harsh light to preserve the fluorescent dyes. Image were taken on an Oympus Confocal Laser Scanning Microscope FV-3000 (Olympus America Inc., Center Valley, Pennsylvania, USA)
Post imaging analysis
The length and width of mitochondria were measured using the Olympus CellSens Dimension software (Olympus America Inc., Version 2.2). Before analysis, mitochondria were numbered in each picture to maintain consistent cataloging. Length and width of each mitochondria was measured using the polyline tool in the Olympus CellSens software. To avoid counting duplicate mitochondria, a single cell with minimal to no artifacts was used only once and each mitochondria fully in frame was counted. To account for the random orientation of mitochondria within the cell, at least 60–80 unique mitochondria from each cell type was analyzed to increase statistical power. The data collected from the CellSens software data retrieval tool was exported for subsequent analyses. Colocalization of lysosomes and mitochondria was also carried out using the CellSens software colocalization tool. Specifically, the maximum Z projection image was obtained through the software and regions of interest were created to increase the power of the colocalization function. The three unexposed cell types were utilized to designate the parameters of the scatterplots and follow up calculation of overlap coefficients M1 and M2. M1 represents the contribution of the green fluorescence (lysosome) to the colocalized area while M2 represents the red fluorescence (mitochondria) to the colocalized area. Values range from 0 to 1 and signify the percentage of pixels from one channel that colocalize with the other channel.
To obtain a ratio that represents the “roundness” of mitochondria, the length was divided by the width of a mitochondria and subtracted from one. The absolute value of this number was then used to generate all positive numbers (EquationEquation (1)(1)
(1) ). A value of zero represents a perfectly round mitochondria while values approaching one represent different degrees of elongation.
(2)
(2)
where RMitochondria is the value representing the average roundness, LMitochondria is the average length (i.e. largest diameter), and WMitochondria is the average width (i.e. shortest diameter) of each mitochondria within an analyzed cell.
Data visualization and statistical analysis
Figure creation, data analysis, and statistical analysis was completed using GraphPad Prism (GraphPad software, Version 8.4.2., San Diego, California, USA). All values are annotated with their standard error of mean (SEM). Statistical analysis for and , data sets comparing cancer and asthma cell types to the primary cell type as a control group, used Brown-Forsythe one-way analysis of variance (one-way ANOVA) with a 95% confidence interval. Games-Howell’s follow-up test was used to identify group means that are significantly different from the control. To compare the baseline and exposed mitochondrial morphologies within one cell type, an unpaired parametric t test with Welch’s correction at the 95% confidence level was used. Statistical significance in both tests is defined as having a p value of less than 0.05. Statistical analysis for utilized a two-way ANOVA with Tukey’s honestly significant difference (HSD) follow up test to compare unexposed and exposed M1 and M2 values. All statistical data is shown in and .
Acknowledgments
We would like to also thank the Center for Microscopy and Imaging (CMI) at Baylor University for aiding in the preparation and imaging of our samples.
Disclosure statement
No potential conflict of interest was reported by the authors.
Additional information
Funding
References
- Berg, J. M., S. Ho, W. Hwang, R. Zebda, K. Cummins, M. P. Soriaga, R. Taylor, B. Guo, and C. M. Sayes. 2010. “Internalization of Carbon Black and Maghemite Iron Oxide Nanoparticle Mixtures Leads to Oxidant Production.” Chemical Research in Toxicology 23 (12): 1874–1882.
- Brar, S. K., M. Verma, R. D. Tyagi, and R. Y. Surampalli. 2010. “Engineered Nanoparticles in Wastewater and Wastewater Sludge–Evidence and Impacts.” Waste Management 30 (3): 504–520.
- Brevini, T. A. L., R. Vassena, C. Francisci, and F. Gandolfi. 2005. “Role of Adenosine Triphosphate, Active Mitochondria, and Microtubules in the Acquisition of Developmental Competence of Parthenogenetically Activated Pig Oocytes.” Biology of Reproduction 72 (5): 1218–1223.
- Chan, D. C. 2012. “Fusion and Fission: interlinked Processes Critical for Mitochondrial Health.” Annual Review of Genetics 46: 265–287.
- Chattopadhyay, M., V. K. Khemka, G. Chatterjee, A. Ganguly, S. Mukhopadhyay, and S. Chakrabarti. 2015. “Enhanced ROS Production and Oxidative Damage in Subcutaneous White Adipose Tissue Mitochondria in Obese and Type 2 Diabetes Subjects.” Molecular and Cellular Biochemistry 399 (1–2): 95–103.
- Cloonan, S. M., and A. M. Choi. 2016. “Mitochondria in Lung Disease.” The Journal of Clinical Investigation 126 (3): 809–820. doi:https://doi.org/10.1172/JCI81113.
- Cogliati, S., J. A. Enriquez, and L. Scorrano. 2016. “Mitochondrial Cristae: where Beauty Meets Functionality.” Trends in Biochemical Sciences 41 (3): 261–273.
- Darlington, T. K., A. M. Neigh, M. T. Spencer, O. T. N. Guyen, and S. J. Oldenburg. 2009. “Nanoparticle Characteristics Affecting Environmental Fate and Transport through Soil.” Environmental Toxicology and Chemistry 28 (6): 1191–1199. doi:https://doi.org/10.1897/08-341.1.
- Davda, J., and V. Labhasetwar. 2002. “Characterization of Nanoparticle Uptake by Endothelial Cells.” International Journal of Pharmaceutics 233 (1–2): 51–59.
- Delp, J., A. Cediel-Ulloa, I. Suciu, P. Kranaster, B. M. van Vugt-Lussenburg, V. Munic Kos, W. van der Stel, et al. 2021. “Neurotoxicity and Underlying Cellular Changes of 21 Mitochondrial Respiratory Chain Inhibitors.” Archives of Toxicology 95 (2): 591–615.
- Dreier, D. A., D. F. Mello, J. N. Meyer, and C. J. Martyniuk. 2019. “Linking Mitochondrial Dysfunction to Organismal and Population Health in the Context of Environmental Pollutants: progress and Considerations for Mitochondrial Adverse Outcome Pathways.” Environmental Toxicology and Chemistry 38 (8): 1625–1634.
- Esch, E. W., A. Bahinski, and D. Huh. 2015. “Organs-on-Chips at the Frontiers of Drug Discovery.” Nature Reviews Drug Discovery 14 (4): 248–260. doi:https://doi.org/10.1038/nrd4539.
- Ghribi, O., D. A. Dewitt, M. S. Forbes, M. M. Herman, and J. Savory. 2001. “Co-Involvement of Mitochondria and Endoplasmic Reticulum in Regulation of Apoptosis: changes in Cytochrome c, Bcl-2 and Bax in the Hippocampus of Aluminum-Treated Rabbits.” Brain Research 903 (1–2): 66–73. doi:https://doi.org/10.1016/S0006-8993(01)02406-4.
- Huang, S., L. Wiszniewski, J. P. Derouette, and S. Constant. 2009. “In Vitro Organ Culture Models of Asthma.” Drug Discovery Today: Disease Models 6: 137–144.
- Jheng, H. F., P. J. Tsai, S. M. Guo, L. H. Kuo, C. S. Chang, I. J. Su, C. R. Chang, and Y. S. Tsai. 2012. “Mitochondrial Fission Contributes to Mitochondrial Dysfunction and Insulin Resistance in Skeletal Muscle.” Molecular and Cellular Biology 32 (2): 309–319.
- Jiang, R. D., H. Shen, and Y. J. Piao. 2010. “The Morphometrical Analysis on the Ultrastructure of A549 Cells.” Revue Roumaine de Morphologie et Embryologie [Romanian Journal of Morphology and Embryology] 51 (4): 663–667.
- Jin, C., and P. Yuan. 2020. “Implications of Lipid Droplets in Lung Cancer: Associations with Drug Resistance.” Oncology Letters 20 (3): 2091–2104.
- Karbowski, M., and R. J. Youle. 2003. “Dynamics of Mitochondrial Morphology in Healthy Cells and during Apoptosis.” Cell Death and Differentiation 10 (8): 870–880. doi:https://doi.org/10.1038/sj.cdd.4401260.
- Kim, H. J., D. H. Jung, I. H. Jung, J. I. Cifuentes, K. Y. Rhee, and D. Hui. 2012. “Enhancement of Mechanical Properties of Aluminium/Epoxy Composites with Silane Functionalization of Aluminium Powder.” Composites Part B: Engineering 43 (4): 1743–1748. doi:https://doi.org/10.1016/j.compositesb.2011.12.010.
- Kirkpatrick, C. J., and C. Mittermayer. 1990. “Theoretical and Practical Aspects of Testing Potential Biomaterials in Vitro.” Journal of Materials Science 1: 9–13.
- Kowaltowski, A. J., and A. E. Vercesi. 1999. “Mitochondrial Damage Induced by Conditions of Oxidative Stress.” Free Radical Biology & Medicine 26 (3–4): 463–471. doi:https://doi.org/10.1016/s0891-5849(98)00216-0.
- Li, R., X. Kou, H. Geng, J. Xie, J. Tian, Z. Cai, and C. Dong. 2015. “Mitochondrial Damage: An Important Mechanism of Ambient PM2. 5 Exposure-Induced Acute Heart Injury in Rats.” Journal of Hazardous Materials 287: 392–401.
- Lujan, H., M. F. Criscitiello, A. S. Hering, and C. M. Sayes. 2019. “Refining in Vitro Toxicity Models: Comparing Baseline Characteristics of Lung Cell Types.” Toxicological Sciences 168 (2): 302–314.
- Lujan, H., and C. M. Sayes. 2017. “Cytotoxicological Pathways Induced after Nanoparticle Exposure: Studies of Oxidative Stress at the 'Nano-Bio' Interface.” Toxicology Research 6 (5): 580–594. doi:https://doi.org/10.1039/c7tx00119c.
- Mabalirajan, U., and B. Ghosh. 2013. “Mitochondrial Dysfunction in Metabolic Syndrome and Asthma.” Journal of Allergy 2013: 340476.
- Mcminn, B., A. L. Duval, and C. M. Sayes. 2019. “An Adverse Outcome Pathway Linking Organohalogen Exposure to Mitochondrial Disease.” Journal of Toxicology 2019: 9246495.
- Mirshafa, A., M. Nazari, D. Jahani, and F. Shaki. 2018. “Size-Dependent Neurotoxicity of Aluminum Oxide Particles: A Comparison between Nano-and Micrometer Size on the Basis of Mitochondrial Oxidative Damage.” Biological Trace Element Research 183 (2): 261–269.
- Mortimer, M., A. Gogos, N. Bartolomé, A. Kahru, T. D. Bucheli, and V. I. Slaveykova. 2014. “Potential of Hyperspectral Imaging Microscopy for Semi-Quantitative Analysis of Nanoparticle Uptake by Protozoa.” Environmental Science & Technology 48 (15): 8760–8767. doi:https://doi.org/10.1021/es500898j.
- Mulenos, M. R., H. Lujan, L. R. Pitts, and C. M. Sayes. 2020. “Silver Nanoparticles Agglomerate Intracellularly Depending on the Stabilizing Agent: Implications for Nanomedicine Efficacy.” Nanomaterials 10 (10): 1953. doi:https://doi.org/10.3390/nano10101953.
- Murakami, K., and M. Yoshino. 2004. “Aluminum Decreases the Glutathione Regeneration by the Inhibition of NADP‐Isocitrate Dehydrogenase in Mitochondria.” Journal of Cellular Biochemistry 93 (6): 1267–1271.
- Murphy, D. J., and J. Vance. 1999. “Mechanisms of Lipid-Body Formation.” Trends in Biochemical Sciences 24 (3): 109–115.
- Niu, P. Y., Q. Niu, Q. L. Zhang, L. P. Wang, S. C. He, T. C. Wu, P. Conti, M. DI Gioacchino, and P. Boscolo. 2005. “Aluminum Impairs Rat Neural Cell Mitochondria in Vitro.” International Journal of Immunopathology and Pharmacology 18 (4): 683–689.
- Panariti, A., G. Miserocchi, and I. Rivolta. 2012. “The Effect of Nanoparticle Uptake on Cellular Behavior: Disrupting or Enabling Functions?” Nanotechnology, Science and Applications 5: 87–100. doi:https://doi.org/10.2147/NSA.S25515.
- Patiño, T., J. Soriano, L. Barrios, E. Ibáñez, and C. Nogués. 2015. “Surface Modification of Microparticles Causes Differential Uptake Responses in Normal and Tumoral Human Breast Epithelial Cells.” Scientific Reports 5: 11371.
- Puleston, D. 2015. “Detection of Mitochondrial Mass, Damage, and Reactive Oxygen Species by Flow Cytometry.” Cold Spring Harbor Protocols 2015 (9): pdb.prot086298. doi:https://doi.org/10.1101/pdb.prot086298.
- Rampelt, H., R. M. Zerbes, M. VAN DER Laan, and N. Pfanner. 2017. “Role of the Mitochondrial Contact Site and Cristae Organizing System in Membrane Architecture and Dynamics.” Biochimica et Biophysica Acta [Molecular Cell Research] 1864 (4): 737–746. doi:https://doi.org/10.1016/j.bbamcr.2016.05.020.
- Sastre, J., F. V. Pallardó, D. E L. A. García, J. Asunción, and J. Viña. 2000. “Mitochondria, Oxidative Stress and Aging.” Free Radical Research 32 (3): 189–198. doi:https://doi.org/10.1080/10715760000300201.
- Sayes, C. M., K. L. Reed, S. Subramoney, L. Abrams, and D. B. Warheit. 2009. “Can in Vitro Assays Substitute for in Vivo Studies in Assessing the Pulmonary Hazards of Fine and Nanoscale Materials?” Journal of Nanoparticle Research 11 (2): 421–431. doi:https://doi.org/10.1007/s11051-008-9471-3.
- Schousboe, A., H. M. Sickmann, L. K. Bak, I. Schousboe, F. S. Jajo, S. A. A. Faek, and H. S. Waagepetersen. 2011. “Neuron–Glia Interactions in Glutamatergic Neurotransmission: roles of Oxidative and Glycolytic Adenosine Triphosphate as Energy Source.” Journal of Neuroscience Research 89 (12): 1926–1934.
- Shannahan, J. H., X. Lai, P. C. Ke, R. Podila, J. M. Brown, and F. A. Witzmann. 2013. “Silver Nanoparticle Protein Corona Composition in Cell Culture Media.” PLoS One 8 (9): e74001.
- Shintani, T., and D. J. Klionsky. 2004. “Autophagy in Health and Disease: A Double-Edged Sword.” Science 306 (5698): 990–995.
- Song, Y., and D. L. Villeneuve. 2021. “AOP Report: Uncoupling of Oxidative Phosphorylation Leading to Growth Inhibition via Decreased Cell Proliferation.” Environmental Toxicology and Chemistry 40 (11): 2959–2967. doi:https://doi.org/10.1002/etc.5197.
- Stern, S. T., P. P. Adiseshaiah, and R. M. Crist. 2012. “Autophagy and Lysosomal Dysfunction as Emerging Mechanisms of Nanomaterial Toxicity.” Particle and Fibre Toxicology 9: 20.
- Terron, A., A. Bal-Price, A. Paini, F. Monnet-Tschudi, S. H. Bennekou, M. Leist, S. Schildknecht, and E. W. E. Members, EFSA WG EPI1 Members. 2018. “An Adverse Outcome Pathway for Parkinsonian Motor Deficits Associated with Mitochondrial Complex I Inhibition.” Archives of Toxicology 92 (1): 41–82.
- Twig, G., and O. S. Shirihai. 2011. “The Interplay Between Mitochondrial Dynamics and Mitophagy.” Antioxidants & Redox Signaling 14 (10): 1939–1951. doi:https://doi.org/10.1089/ars.2010.3779.
- Warheit, D. B., R. A. Hoke, C. Finlay, E. M. Donner, K. L. Reed, and C. M. Sayes. 2007. “Development of a Base Set of Toxicity Tests Using Ultrafine TiO2 Particles as a Component of Nanoparticle Risk Management.” Toxicology Letters 171 (3): 99–110.
- Wei, Y., J. J. Zhang, Z. Li, A. Gow, K. F. Chung, M. Hu, Z. Sun, L. Zeng, et al. 2016. “Chronic Exposure to Air Pollution Particles Increases the Risk of Obesity and Metabolic Syndrome: Findings from a Natural Experiment in Beijing.” FASEB Journal 30 (6): 2115–2122. doi:https://doi.org/10.1096/fj.201500142.
- Wu, S., F. Zhou, Z. Zhang, and D. Xing. 2011. “Mitochondrial Oxidative Stress Causes Mitochondrial Fragmentation via Differential Modulation of Mitochondrial Fission–Fusion Proteins.” The FEBS Journal 278 (6): 941–954.
- Youle, R. J., and D. P. Narendra. 2011. “Mechanisms of Mitophagy.” Nature Reviews. Molecular Cell Biology 12 (1): 9–14.
- Yu, T., J. L. Robotham, and Y. Yoon. 2006. “Increased Production of Reactive Oxygen Species in Hyperglycemic Conditions Requires Dynamic Change of Mitochondrial Morphology.” Proceedings of the National Academy of Sciences 103 (8): 2653–2658. doi:https://doi.org/10.1073/pnas.0511154103.
- Yu, T., L. Wang, and Y. Yoon. 2015. “Morphological Control of Mitochondrial Bioenergetics.” Frontiers in Bioscience (Landmark Edition) 20: 229.
- Zhang, L., W. Wang, B. Zhu, and X. Wang. 2017. "Epithelial Mitochondrial Dysfunction in Lung Disease." In Mitochondrial DNA and Diseases. Advances in Experimental Medicine and Biology, edited by H. Sun and X. Wang, vol 1038. Singapore: Springer. doi:https://doi.org/10.1007/978-981-10-6674-0_14
- Zhang, Y., C. Yu, G. Huang, C. Wang, and L. Wen. 2010. “Nano Rare-Earth Oxides Induced Size-Dependent Vacuolization: An Independent Pathway from Autophagy.” International Journal of Nanomedicine 5: 601–609.
- Zick, M., R. Rabl, and A. S. Reichert. 2009. “Cristae Formation—Linking Ultrastructure and Function of Mitochondria.” Biochimica et Biophysica Acta [Molecular Cell Research] 1793 (1): 5–19. doi:https://doi.org/10.1016/j.bbamcr.2008.06.013.
- Zucker, R. M., J. Ortenzio, L. L. Degn, J. M. Lerner, and W. K. Boyes. 2019. “Biophysical Comparison of Four Silver Nanoparticles Coatings Using Microscopy, Hyperspectral Imaging and Flow Cytometry.” PLOS One 14 (7): e0219078.
- Zyuzin, M. V., T. Honold, S. Carregal‐Romero, K. Kantner, M. Karg, and W. J. Parak. 2016. “Influence of Temperature on the Colloidal Stability of Polymer‐Coated Gold Nanoparticles in Cell Culture Media.” Small 12 (13): 1723–1731.