
Abstract
Human ENP exposure is inevitable and the novel, size-dependent physicochemical properties that enable ENPs to be beneficial in innovative technologies are concomitantly causing heightened public concerns as to their potential adverse effects upon human health. This study aims to deduce the mechanisms associated with potential ENP mediated (geno)toxicity and impact upon telomere integrity, if any, of varying concentrations of both ∼16 nm (4.34 × 10⁻³ to 17.36 × 10⁻³ mg/mL) Gold (Au) and ∼14 nm (0.85 × 10⁻⁵ to 3.32 × 10⁻⁵ mg/mL) Silver (Ag) ENPs upon two commonly used lung epithelial cell lines, 16HBE14o− and A549. Following cytotoxicity analysis (via Trypan Blue and Lactate Dehydrogenase assay), two sub-lethal concentrations were selected for genotoxicity analysis using the cytokinesis-blocked micronucleus assay. Whilst both ENP types induced significant oxidative stress, Ag ENPs (1.66 × 10⁻⁵ mg/mL) did not display a significant genotoxic response in either epithelial cell lines, but Au ENPs (8.68 × 10⁻³ mg/mL) showed a highly significant 2.63-fold and 2.4-fold increase in micronucleus frequency in A549 and 16HBE14o− cells respectively. It is hypothesized that the DNA damage induced by acute 24-h Au ENP exposure resulted in a cell cycle stall indicated by the increased mononuclear cell fraction (>6.0-fold) and cytostasis level. Albeit insignificant, a small reduction in telomere length was observed following acute exposure to both ENPs which could indicate the potential for ENP mediated telomere attrition. Finally, from the data shown, both in vitro lung cell cultures (16HBE14o− and A549) are equally as suitable and reliable for the in vitro ENP hazard identification approach adopted in this study.
1. Introduction
Nanotechnology can be defined as the manipulation, precision placement, measurement, modeling, or manufacture of materials at the nanometer (nm) scale (Donaldson et al. Citation2004). Nanotechnology is based on utilizing materials with preexisting beneficial properties in bulk (>500 nm) and enhancing their physiochemical properties by manufacturing these materials into particles within the 1–100 nm size range (Oberdörster, Stone, and Donaldson Citation2007). Nanoparticles possess all three dimensions within the nm scale and can be classified further depending on unique physicochemical characteristics (e.g. chemical composition, size, structure, surface coating, and charge) (Filipponi and Sutherland Citation2013). Nanoparticles utilized in nanotechnologies have been engineered specifically to a regulated size, shape, and composition with the intention to be utilized in and enhance various commercial products, such as electronics, vehicle parts, cosmetics, renewable energies, clothing, sports equipment, pharmaceuticals, and medicine (Stone, Johnston, and Clift Citation2007; Bakand and Hayes Citation2016). Metallic ENPs, like gold (Au) and silver (Ag), are continually integrated into commercial, electrical, and environmental applications, but frequently attract heightened attention in the biomedical industry due to their perceived biologically inert, plasmonic, and anti-microbial properties respectively (Quy Nguyen, Tam Le, and Le Citation2013; Tran, Nguyen, and Le Citation2013; Zhang Citation2015; Murali, Neelakandan, and Thomas Citation2018). These novel properties deem them ‘ideal’ tools for new medical devices, treatments, and disease diagnostics, and so hold great promise for overcoming future human health challenges (Tran, Nguyen, and Le Citation2013; Ribeiro et al. Citation2017). However, both Au and Ag ENPs have also been found to induce a myriad of dose-dependent hazardous effects for human health including cytotoxicity, elevated oxidative stress, inflammation, alterations to cell proliferation, and genotoxicity (Gerber et al. Citation2013; Herzog et al. Citation2013; Khanna et al. Citation2015; Bakand and Hayes Citation2016). Conceptually, the rapid development and implementation of a diverse array of ENPs continue to be highly beneficial to current society, but with continued accidental or occupational exposure, it is becoming apparent that some ENPs are not inherently benign and that they can interact and effect biological systems at a cellular, sub-cellular (i.e. organelle) and molecular level.
Inhalation is deemed a primary route of exposure and whilst inhaled ENPs can deposit throughout the entire respiratory tract, a high proportion tend to preferentially deposit in the most distal, the alveolar, regions of the lung (Ma et al. Citation2015). Two cell lines commonly used to model the alveolar region of the lung are the bronchiolar epithelial cell-line 16HBE14o− and the alveolar type-II (ATII) like A549 epithelial cell-line (Rothen-Rutishauser et al. Citation2012). Although both cell lines have their individual limitations, 16HBE14o− cells, whilst a bronchiolar epithelial cell type, provide a highly representable model for the lung epithelial cell barrier as they form a solid epithelial monolayer with increased cell-to-cell tight junctions. A549, on the other hand, is derived from adenoma-carcinoma cells and is the most accessible ATII-like cell-line commercially available (Swain et al. Citation2010; Thorley et al. Citation2014). ATII cells serve an important role as one of the first lines of defense against inhaled toxicants, like ENPs, as well as aiding epithelium regeneration after injury (Ruaro et al. Citation2021). ENP toxicity is not solely related to the region of deposition, but it can contribute as changes in pulmonary cell types, surfactant properties, immune defense mechanisms (e.g. alveolar macrophages, mucociliary escalator) and surface area can lead to great variations in reactivity, retention, and absorption of particles with particular physicochemical characteristics (Thorley et al. Citation2014; Jochums et al. Citation2017). As two distinct cell lines with different pulmonary origins and primary functions (i.e. bronchial cells are essential for clearance and protection from airway contaminants, whilst alveolar cells are crucial for gaseous exchange), these cells may behave differently when exposed to inhaled toxic substances. As a result, it is important to determine whether acute exposure to either Au or Ag ENPs induced a significantly different toxicological response in 16HBE14o− or A549 epithelial cell lines when utilized to model the alveolar region of the lung in vitro.
Genotoxicity arises as a result of DNA damage induced by either an endogenous or exogenous agent, which is subsequently fixed as permanent mutations to the genetic information within a cell. This can disrupt normal cellular development and function, leading to mitochondrial dysfunction, defective metabolism, uncontrolled proliferation, and malignancies (Llewellyn, Niemeijer, et al. Citation2021). ENPs can induce DNA damage via and/or secondary mechanisms (Singh et al. Citation2009). Primary mechanisms can be further classified into direct and indirect mechanisms, whilst secondary mechanisms arise purely as an indirect consequence of cell-to-cell interactions between different cell types and are more prevalent in in vivo based studies. Direct primary genotoxicity mechanisms involve DNA damage caused by the localization and direct physical interaction of ENPs with DNA. Albeit rare, Au ENPs have been shown to possess an ability to interact directly and bind to DNA (i.e. nonspecific adsorption); a property which has been exploited for the treatment of diseases, such as anti-cancer or gene therapy agents (Pellegrino et al. Citation2007; Huang and El-Sayed Citation2010; Malsch and Emond Citation2013; Mendes et al. Citation2017). However, this innate characteristic could also present a genotoxic threat with pathogenic implications, as clusters of 1.4 nm Au55 ENPs have been found to inhibit DNA replication, repair, and subsequently compromise the fidelity of the DNA by interacting and binding irreversibly with the major grooves of DNA (Tsoli et al. Citation2005). Indirect primary genotoxicity mechanisms arise from ENP associated induction and/or interaction of other molecules, like reactive oxygen species (ROS)/reactive nitrogen species (RNS). These have the capability to interact with DNA complexes or cell cycle proteins (e.g. spindle apparatus) which can further interfere with cellular replication and division (Evans et al. Citation2017). ENPs are known to act as ROS/RNS inducers that can influence intracellular ion concentrations, activate (pro-)inflammatory transcription factors, and modulate cytokine production through the production of free radicals (Manke et al. Citation2013; Llewellyn, Niemeijer, et al. Citation2021), and so indirect primary genotoxicity is the most commonly described ENP mediated mechanism of DNA damage in vitro.
DNA is one of the major targets for oxidative stress-induced damage (e.g. DNA-protein crosslinks, alkali-labile sites, DNA adducts, mutations), with OH•, a highly potent free radical, known to target guanine rich regions of DNA and undergo oxidation to form 8-oxoguanine (8-oxoG), causing strand breaks via the formation of 8-OHdG DNA adducts (Manke et al. Citation2013; Fu et al. Citation2014). As a result, ENP associated oxidative stress could pose a threat to the integrity of telomeres; guanine-rich, dynamic ribonucleic structures located at the ends of human chromosomes. Telomeric regions consist of non-coding tandem DNA repeats, TTAGGG, which form a lariat-like molecular T-loop structure and act as a protective cap to prevent chromosome degradation, inter-chromosomal fusion, and preserve genetic integrity (Shammas Citation2011; Spiegel, Adhikari, and Balasubramanian Citation2020). However, over multiple cellular replications, the telomeres begin to shorten progressively as a ‘fail safe’ mechanism to enforce replicative senescence and prevent older cells, more susceptible to mutagenicity, from continued division. This action of telomere shortening reduces the risk of age-related disease and cancer etiologies arising. Consecutive guanine sequences, such as GGG found in telomeres, are sites of preferential oxidation and oxidative 8-oxoG type lesions can induce replication fork arrest and malformation of the T-loop structure, resulting in telomere attrition and shortening, despite the repair mechanisms undertaken by telomerase (Coluzzi, Leone, and Sgura Citation2019). During DNA repair, the ends of the chromosomes often fuze together, destabilizing the genome and preventing the cells from dividing properly, which can have pathogenic consequences for healthy cells (Coluzzi, Leone, and Sgura Citation2019; Fouquerel et al. Citation2019). Yet, specific targeting of telomeric regions might offer a therapeutic opportunity in the fight against cancer. ENP associated modifications to telomere length and function is an area of nano(geno)toxicology that is highly undersubscribed, yet there are overwhelming links with telomere shortening and oxidative stress. Consequently, this study aims to determine the cellular interaction and toxicological effect (e.g. cytotoxicity, (pro-)inflammatory response, oxidative stress status, DNA damage, and genotoxicity) of metallic Au and Ag ENP exposures upon lung epithelial cell lines 16HBE14o− and A549 in vitro. Furthermore, the study aims to elucidate the potential mechanisms, if any, behind any toxicological outcomes observed, with a specific focus on the genotoxic effects of acute Au and Ag ENP exposures upon telomere status.
2. Materials and methods
All materials and reagents were purchased from Sigma-Aldrich (UK), unless otherwise stated.
2.1. Cell culture
The human bronchial epithelial cell line, 16HBE14o− were cultured in Minimum Essential Medium (MEM) (with 10% L-glutamine) supplemented with 10% Fetal Bovine Serum (FBS) and 1% penicillin/streptomycin. All culture surfaces for this cell line were coated with fibronectin solution; 88% LHC basal medium, 10% 1 mg/mL Bovine Serum Albumin (BSA), 1% of 3.0 mg/mL bovine collagen (Corning®, UK) and 1% of 1.0 mg/mL human fibronectin (Corning®, UK). A549 cells were cultured similarly to 16HBE14o− cells, with the exception of non-fibronectin-coated flasks and Roswell Park Memorial Institute (RPMI) 1640 culture medium (Gibco®, UK) supplemented with 10% FBS, 1% L-Glutamine, and 1% penicillin/streptomycin. Both cell lines were seeded at a density of 2.0 × 10⁵ cells/mL incubated at 37 °C and 5% CO2 for 7 days, with the culture medium being replaced every 72 h of culture to ensure cell viability and homeostasis.
2.2. Gold and silver ENPs
Both ENPs were colloidal plasmonic nanoparticles with good size distribution and either an Au or Ag core and an amphiphilic polymer coating. Both types of particles were synthesized according to standard protocols, based on Au cores and Ag cores synthesized in aqueous solution, which were then phase-transferred to organic solvent and retransferred to aqueous solution by overcoating with poly(isobutylene-alt-maleic anhydride)-graft-dodecyl (PMA) integrated with a fluorescence label (either TAMRA or ATTO-590) (Ali et al. Citation2011; Hühn et al. Citation2017). As a result, the two used ENPs have different core materials (Au and Ag), but a similar diameter and surface chemistry. ENPs were stored in suspension at 4 °C. Characterization was carried out as described in previously published protocols and specific characteristics of each ENP are listed in (Hühn et al. Citation2017).
Table 1. Specific physio-chemical characteristics determined for both Au and Ag ENPs and mass spectrometry protein analysis.
2.3. Conditioned cell culture medium for ENP exposures
Confluent A549 and 16HBE14o− epithelial monolayers were exposed (submerged exposure approach) to their respective cell culture media conditioned with the following ENP concentrations, Au; 4.34 × 10⁻³ mg/mL, 8.68 × 10⁻³ mg/mL and 17.36 × 10⁻³ mg/mL, and Ag; 0.83 × 10⁻⁵ mg/mL, 1.66 × 10⁻⁵ mg/mL & 3.32 × 10⁻⁵ mg/mL. Note that these concentrations refer to the Au and Ag content as determined via elemental analysis, and do not take into account the mass of the surface coating. Acute ENP exposures were performed over a 24-h period at 37 °C and 5% CO2.
2.4. Trypan Blue Exclusion and Lactate Dehydrogenase (LDH) assays for cytotoxicity
Cytotoxicity of A549 and 16HBE14o− cells following 24-h exposure to increasing concentrations of Au and Ag ENPs was assessed using the Trypan Blue Exclusion assay and LDH release assay to determine cell membrane integrity (Brown et al. Citation2001; Strober Citation2001). Following ENP exposure, supernatants were harvested for the LDH assay whilst the cells were washed with PBS (Gibco®, UK) at room temperature (RT) and detached using 0.25% Trypsin-EDTA (0.02%). Detached cells were re-suspended with a fresh cell culture medium and exposed in a 1:1 ratio of the cell suspension to 0.4% trypan blue solution. A total number of 500 cells were scored for each exposure concentration per independent replicate (n = 3) using a hemocytometer and the proportion of live to dead cells was calculated into percentage cytotoxicity. Supernatants previously harvested were analyzed using an in-house adapted version of the Sigma LDH diagnostic kit protocol as previously described by Brown et al. (Citation2001).
The potential for ENPs to interact with and be adsorbed to the surface of the LDH enzyme, and a false negative toxicity result to arise, was also assessed by exposing the cells to 0.1% Triton-X100 for 1 h at 37 °C and 5% CO2, as previously described by Clift et al. (Citation2008). Briefly, supernatants were harvested, centrifuged at 640 × g for 2 min and re-distributed into 250 μL aliquots where the following ENP concentrations were added; 4.34 × 10⁻³ mg/mL, 8.68 × 10⁻³ mg/mL and 17.36 × 10⁻³ mg/mL of Au ENP exposures, and 0.83 × 10⁻⁵ mg/mL, 1.66 × 10⁻⁵ mg/mL & 3.32 × 10⁻⁵ mg/mL for Ag ENP exposures, with both a negative (media only) and positive (50 μL of 0.2% Triton-X100) control included. Samples were then incubated for a further 1-h at 37 °C and 5% CO2 before running the LDH assay.
2.5. Confocal laser scanning microscopy (cLSM)
For cLSM imaging, both A549 and 16HBE14o− cells were seeded onto transwell polyethylene terephthalate (PET) insert membranes (12 well format) (Corning®, UK) and cultured as previously described in Section 2.1. Post-acute ENP exposure, the cells were washed three times with ice-cold phosphate-buffered saline (PBS) (1X) and fixed for 15 min with 3% paraformaldehyde in PBS at RT. After fixation, cells were washed again with PBS (1X) and then transferred to 0.1 M glycine in PBS to be stored at 4 °C. To permeabilize the cell membrane, cells were washed three times in ice-cold PBS and subsequently treated with 0.1% Triton X-100 in PBS for 15 min. The actin cytoskeleton of the epithelial cells was stained with Phalloidin Alexa Fluor 633 (A22284, Life Technologies™, UK) in a 1:50 dilution with PBS, at RT, for 45 min in the dark. Following the staining period, the membranes were washed once again with PBS before being mounted onto frosted microscope slides (FisherScientific™, UK). DAPI staining (to mark the nuclear region of the cell) was used on the samples via the incorporation of Vectashield® (H-1200, Vector Laboratories, UK). A coverslip was then applied to the slides prior to their storage in the dark overnight at 4 °C. Samples were then imaged using an inverted Zeiss cLSM 710 (Axio Observer Z1), combined with ZEN 2010 software, to image the samples at 488 nm (DAPI), 543 nm (Ag-PMA-TAMRA ENPs), 590 nm (Au-PMA-ATTO-590 ENPs), and 633 nm (Phalloidin Alexa Fluor).
2.6. Fluorescent flow cytometry for ENP-Cell interaction analysis
Flow cytometry involved seeding 2.0 × 10⁵ cells/mL directly into FACS tubes with the ENP conditioned media added in neat and the samples incubated for 24 h at 37 °C and 5% CO2. Following incubation, samples were centrifuged at RT for 5 min and 500 × g and the supernatant discarded prior to the cells being re-suspended in PBS (Gibco®, UK). Samples were then centrifuged once more before being resuspended in 500 μL of FACS buffer (1% BSA and 0.1% Sodium Azide in (1X) PBS) and subsequently analyzed by flow cytometry (FACSAriaTM, BD Biosciences, USA). Using FlowJo® software, 10 000 events per biological replicate (n = 3) were analyzed for each ENP respectively.
2.7. Intracellular reduced glutathione (GSH) quantification
Both A549 and 16HBE14o− cells were seeded at 2.0 × 10⁵ cells/mL into 12-well cell culture plates (Greiner Bi-One, UK) and incubated for 5 days at 37 °C and 5% CO2 before 24-h ENP exposure was performed. Post-ENP exposure, the cells were detached using 0.25% Trypsin-EDTA (0.02%), resuspended in (1X) PBS, and homogenized in 0.5% NP-40 cell lysis buffer (Fisher Scientific, UK). Quantification of reduced GSH was then performed in triplicate per biological replicate (n = 3) following the manufacturer’s instructions (ab138881, Abcam, UK) and with positive control of 0.02% PBS-tBHP (tert-Butyl Hydrogen Peroxide, 70%).
2.8. In vitro cytokinesis blocked micronucleus (CBMN) assay for genotoxicity analysis
Both A549 and 16HBE14o− cells were seeded at 2.0 × 10⁵ cells/mL in 12-well plates and allowed to adhere for 24-h at 37 °C and 5% CO2 after which the cells were then treated with both Au (8.68 × 10⁻³ mg/mL) and Ag (1.66 × 10⁻⁵ mg/mL) ENPs for 24-h. Mitomycin-C (MMC) at 0.05 μg/mL was used as a positive control. After exposure, cells were washed in PBS twice and re-suspended in fresh media containing 3.0 μg/mL Cytochalasin B for a further 24-h incubation period (ca. 1-cell cycle). The cells were then trypsinized, pelleted by centrifugation, and washed twice in PBS; the final wash was performed with cold (1X) PBS, prior to manual slide preparation as described by Conway et al. (Citation2020). Once fixed, the slides were left to air-dry overnight at RT before being stored at −20 °C. When required, slides were thawed at RT before undergoing staining for manual CBMN scoring in 20% Giemsa diluted in phosphate buffer (pH 6.8), as previously described by (Manshian, Singh, and Doak (Citation2013). Slides were scored manually using an Olympus BH-2 light microscope to count, firstly the number of mononucleated, binucleated, and multinucleated cells present per 1000 binucleated cells, and secondly, the presence of micronuclei in the binucleated cells. Based on this, the Cytokinesis Block Proliferation Index (CBPI) and % cytostasis was calculated using the formulas published in the OECD Test Guideline 487 (2016). The CPBI was then converted into % cell viability relative to that of the untreated control. For genotoxicity analysis in each biological replicate (n = 3), a triplicate of 1000 binucleated cells was counted (9000 binucleates per exposure type), and the percentage of them containing micronuclei was recorded.
2.9. In vitro centromeric fluorescent in situ hybridisation (FISH) on prepared unstained CBMN slides
Centromeric FISH staining was performed with specific pan-centromeric probes (Star-FISH© Human Chromosome Pan-Centromeric Paints, Cambio, UK). Unstained slides, pre-prepared from the manual CBMN assay, were pre-warmed to 37 °C for 10 min before undergoing centromeric labeling as described by Manshian, Singh, and Doak (Citation2013). There were two alterations to this method, one was the omission of primulin (a red cytoplasmic stain) solution, and the second, the addition of 8.0 μL of the denatured centromeric probe to the cytodot for the 16-h hybridization step. After the hybridization was complete, a triplicate of 20 binucleated cells containing micronuclei (MN) was scored (60 binucleated cells with MN in total) per biological replicate for each treatment using a Zeiss fluorescence microscope linked to the Metafer 4.0 software (Zeiss MetaSystems Imager 2, MetaSystems, Germany) and ISIS fluorescence imaging software (MetaSystems, Germany).
2.10. In vitro telomeric fluorescent in situ hybridisation (FISH)
For telomeric visualization, Q-FISH was performed whilst Flow-FISH was adopted for telomere length quantification. Both A549 and 16HBE14o− were cultured for 72-h post-seeding at 37 °C and 5% CO2 before a 24-h Au (8.68 × 10⁻³ mg/mL) and Ag (1.66 × 10⁻⁵ mg/mL) ENP exposure was performed. Following ENP exposure, the supernatants were harvested and replaced with 0.1 μg/mL of KaryoMAXTM ColcemidTM (Gibco®, UK) diluted in cell culture medium and incubated for 4-h at 37 °C and 5% CO2. Cells were then trypsinized, centrifuged, and washed twice in PBS. Centrifugation was repeated once more and the cell pellet was re-suspended in hypotonic solution (55 mM KCl and 20 mM Hepes, pH 7.4) for 10 min at RT to induce cell swelling. After which, a fixative solution (3:1, methanol to glacial acetic acid) was added and the samples mixed gently. Samples were centrifuged and re-suspended in fresh fixative solution twice, before being stored at 4 °C for up to 72-h prior to in situ hybridization as described in .
Figure 1. Telomeric Q-FISH specific in situ hybridization protocol as described in a schematic diagram.
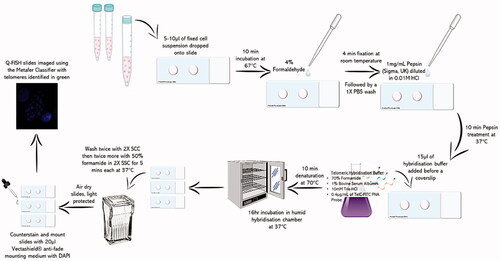
Flow FISH was conducted as previously described in Section 2.6, except following centrifugation the samples were re-suspended in pre-warmed (37 °C) hybridization buffer (350.0 μL of Formamide, 100.0 μL of 5% BSA, 47.0 μL of 106 mM Tris-HCl and 3.0 μL of TelC-FITC PNA probe) and incubated for 10 min, on a heat block, at 82 °C. Samples were then mixed thoroughly and incubated in a dark, humid chamber for 16-h at 37 °C and 5% CO2. Following hybridization, samples were centrifuged and re-suspended in 50% Formamide in (2X) SSC for a 10-min incubation at 40 °C twice. After the final centrifugation, supernatants were discarded, and the cells were re-suspended in pre-prepared FACS buffer (1% BSA and 0.1% Sodium Azide in (1X) PBS). Using the flow cytometer (FACSAriaTM, BD Biosciences, USA) and supporting FlowJo software, 10 000 events per biological replicate were analyzed for each ENP respectively.
2.11. Data analysis and statistics
All data are presented as the mean ± standard error of the mean (SEM). Subsequent statistical analysis was then performed using GraphPad Prism® 6 (GraphPad Software, 2018). Data were assumed to be normally distributed (data not shown), and thus parametric statistical analysis was performed. A two-way analysis of variance (ANOVA) was used, with a subsequent Tukey post hoc test. An alpha value of 0.05 or below was considered statistically significant.
3. Results
3.1. Lung epithelial monoculture in vitro cytotoxic response
Initially, cell viability and cytotoxicity responses were indicated using an LDH assay supported by the trypan blue live/dead assay for the Au ENP exposures, as the Au ENPs were shown to interact with the LDH enzyme in a concentration-dependent manner (data not shown). Both Ag and Au ENPs were shown to exhibit a dose-dependent increase in cytotoxicity, with a significant (p ≤ 0.001) increase in the percentage of cell death observed post 24-h Au ENP (17.36 × 10⁻³ mg/mL) exposure. A549 cells were more sensitive than 16HBE14o− cells, with 23.26% as opposed to 16.92% difference in cell death observed pre- and post- 24-h ENP exposure at the top concentration of 17.36 × 10⁻³ mg/mL (). Although Au ENP associated cell death, relative to the negative control, does not increase at the same increments in both cell lines, they do exhibit a similar cytotoxic response with the lower two concentrations, 4.34 × 10⁻³ mg/mL and 8.68 × 10⁻³ mg/mL inducing <2.0% and <5.0% cell death respectively, and thus deemed to be sub-lethal ENP exposure concentrations.
Figure 2. Cell viability of both A549 and 16HBE14o− lung epithelial cells following 24-h exposure to (A) Au ENPs and (B) Ag ENPs. Percentage difference in (A) cell death (as determined by the Trypan Blue Exclusion Assay) and (B) LDH release observed relative to the 0.1% Triton-X positive control between pre- and post-ENP exposure. Data presented as the mean ± SEM of three biological replicates. Significance is indicated as follows: ***p ≤ 0.001 and ****p ≤ 0.0001.
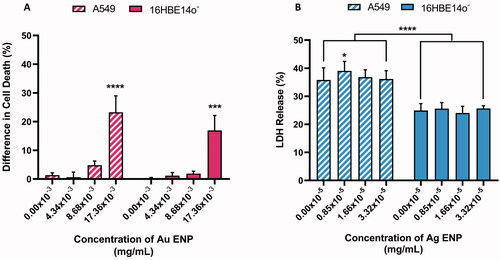
Ag ENPs on the other hand did not display any significant disruption to the membranes of either epithelial cell types, or subsequent cytotoxicity, when exposed to 0.83 × 10⁻⁵ mg/mL to 3.32 × 10⁻⁵ mg/mL of 14.6 nm Ag ENPs, as LDH release was noted to remain consistent across all three Ag ENP concentrations tested. Although acute exposure to Ag ENPs did not induce notable cytotoxicity in either epithelial cell type, there was a highly significant difference (p ≤ 0.0001) in the overall percentage of LDH release observed, with A549 cells displaying significantly higher (∼10% greater than baseline levels) LDH release than the 16HBE14o− cells in the negative controls ().
3.2. ENP interaction with lung epithelial mono-culture cell systems
cLSM and Flow Cytometry analysis showed that Ag ENPs of all concentrations tested interact with both epithelial cell types, specifically localized within the cytoplasm of the A549 and 16HBE14o- cells, which is compatible with the standard uptake pathway of ENPs by endocytosis (Rejman et al. Citation2016). A representative image of the Ag ENP-cellular interaction is illustrated in , whereby the Ag-PMA-TAMRA ENPs, highlighted in yellow, is shown to be associated with the 16HBE14o- cells via Imaris image rendering of cLSM z-Stack analysis (). The images in further confirm the presence of Ag ENPs inside the cytoplasm of the 16HBE14o- cells. A similar Ag interaction was also observed with the A549 cells (data not shown), but comprehensive cLSM based ENP-cell interaction for both cell types and the two materials was not possible due to an overlap in the emission spectra between the ATTO-590 fluorescent tag on the Au ENPs and that of the Phalloidin 633 cytoskeletal stain. As a result, it was unclear as to which aspects of fluorescence were localized Au ENPs and which were F-actin bundles. Therefore, a full ENP-cell interaction analysis was undertaken using flow cytometry instead ().
Figure 3. cLSM image showing (A) 16HBE14o− negative control, (B) Ag ENP interaction with 16HBE14o− cells at the lowest concentration of 0.83 × 10⁻⁵ mg/mL, whilst (C) illustrates the extent of this Ag ENP-cell interaction in Imaris rendered images of the 16HBE14o− cells exposed to 1.66 × 10⁻⁵ mg/mL of Ag ENPs. DAPI (blue) highlights the cell nucleus, whilst the Phalloidn 633 (red) stain outlines the cytoskeleton and TAMRA (yellow) indicates the presence of Ag ENPs. Magnification 63×. Scale bar for all images, with the exception of (B), is 20 µm whilst (B) is 10 µm.
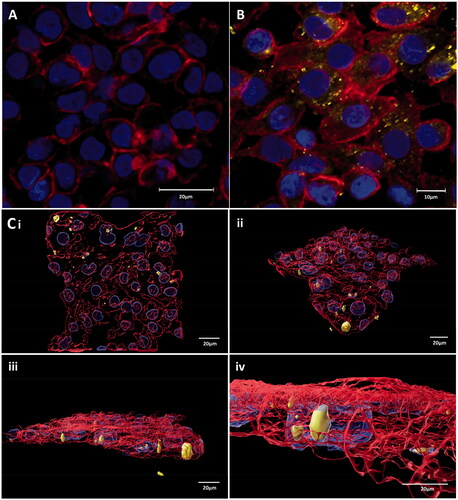
Figure 4. Representative PE-Cy7-A (A–C) and FITC-A (D–F) fluorescence histograms and average median fluorescence indicating ENP-cell interaction following 24-h exposure to Au and Ag ENPs, respectively. Fluorescence histograms (A) and (B) represent Au ENP interaction with A549 and 16HBE14o− epithelial cells respectively, whilst (D) and (E) represent Ag ENP interaction with A549 and 16HBE14o− epithelial cells. Exact median fluorescence values are listed in the table below each histogram. The average median fluorescence following exposure to increasing concentrations of Au (C) and Ag ENPs (F) on A549 and 16HBE14o− epithelial cells. Data presented as the mean ± SEM of three biological replicates. Significance in relation to the negative control is indicated as follows: *p ≤ 0.05, **p ≤ 0.01, ***p ≤ 0.001, and ****p ≤ 0.0001. Significance between the two cell types is indicated as follows: xxp ≤ 0.01, xxxp ≤ 0.001, and xxxxp ≤ 0.0001.
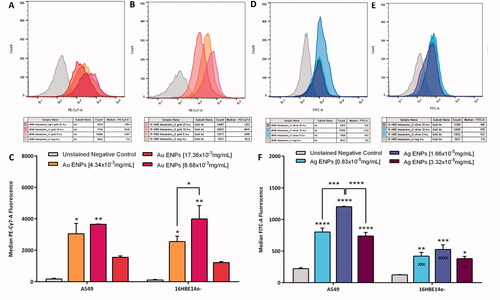
To overcome this, ENP-cell interaction was further analyzed using Flow Cytometry, as displayed in , where Au ENPs are shown to be significantly associated (p = 0.0126, p = 0.0317) with both 16HBE14o− and A549 cells respectively, even at the lowest exposure concentration of 4.34 × 10⁻³ mg/mL. Au ENPs were shown to associate with both 16HBE14o− and A549 cells in a similar manner with the greatest association made following exposure to the mid-range concentration of 8.68 × 10⁻³ mg/mL as indicated by the greater PE-Cy7-A fluorescence peaks displayed in . There was no significant (p > 0.05) variation between the two epithelial cell types and their interaction with Au or Ag ENPs. Flow cytometry analysis revealed that Ag ENPs interact with A549 cells more readily than the 16HBE14o−, but both epithelial cell lines interact with Ag ENPs in a similar manner as observed with the Au ENPs; that is, with the greatest Ag ENP-cell interaction observed following exposure to 1.66 × 10⁻⁵ mg/mL (the mid-range concentration, ).
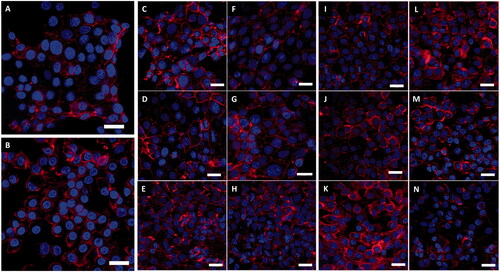
Surprisingly, exposure to the top concentrations of both Au and Ag ENPs showed a notable decrease in ENP-cell interaction across both epithelial cell lines. This may be explained by the alterations in cellular morphology observed with both A549 and 16HBE14o− cells post Au and Ag ENP exposure, or the greater agglomeration of ENPs at the higher concentrations (Ma et al. Citation2017). It is well known that at higher ENM concentrations, the degree of agglomeration tends to be greater than that at the lower concentrations of ENMs, as the high number of particles within a given space increases the chance of particle–particle interaction and subsequent agglomeration (Bruinink, Wang, and Wick Citation2015). Greater material agglomeration at the top dose, may restrict the uptake of ENPs into the cells and subsequently reduce biological interaction. clearly illustrates an increased granulated and textured appearance of the epithelial cytoskeletons with the cell membranes not as defined as seen previously in the negative controls (). A549 and 16HBE14o− cells showed a similar change in cellular morphology with the cells becoming more compact, irregularly shaped nuclei and indications of nuclear degradation becoming more apparent as the concentration of ENP exposure increases; all of which are particularly prominent post 24-h exposure to the top concentrations of Au ENP (17.36 × 10⁻³ mg/mL) and Ag ENP (3.32 × 10⁻⁵ mg/mL).
Figure 5. LSM fluorescence images displaying both A549 and 16HBE14o− lung epithelial cell morphology with and without 24-h exposure to Au and Ag ENPs. DAPI (blue) highlights the nucleus whilst the Phalloidn 633 (red) stain outlines the cytoskeleton. (A) and (B) displays the natural cell morphology of untreated A549 and 16HBE14o− cells, respectively. A549 cell morphology following 24-h exposure to 4.34 × 10⁻³ mg/mL (C), 8.68 × 10⁻³ mg/mL (D) and 17.36 × 10⁻³ mg/mL (E) of Au ENPs and 0.83 × 10⁻³ mg/mL (F), 1.66 × 10⁻³ mg/mL (G) and 3.32 × 10⁻⁵ mg/mL (H) of Ag ENPs. 16HBE14o− cell morphology following 24-h exposure to 4.34 × 10⁻³ mg/mL (I), 8.68 × 10⁻³ mg/mL (J) and 17.36 × 10⁻³ mg/mL (K) of Au ENPs and 0.83 × 10⁻³ mg/mL (L), 1.66 × 10⁻³ mg/mL (M) and 3.32 × 10⁻⁵ mg/mL (N) of Ag ENPs. Magnification 63×. Scale bar represents 20 µm.
3.3. Oxidative stress and (pro-)inflammatory response
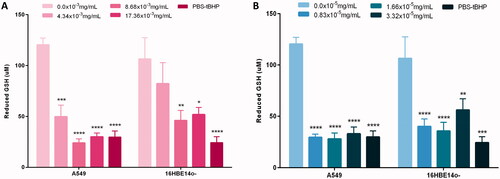
A loss in reduced GSH levels, an antioxidant, is indicative of oxidative stress. Exposure to both Au and Ag ENPs across all three concentrations, 4.34 × 10⁻⁵ mg/mL to 17.36 × 10⁻⁵ mg/mL and 0.83 × 10⁻³ mg/mL to 3.32 × 10⁻³ mg/mL respectively, induced a significant loss (p < 0.05) in GSH across both epithelial cell types (). Unexpectedly, there was not a concentration-dependent decrease in GSH levels. The most potent concentration for inducing oxidative stress and a loss in reduced GSH was attributable to the mid-range concentration of 8.68 × 10⁻³ mg/mL Au ENPs and 1.66 × 10⁻⁵ mg/mL of Ag ENPs, with the lowest values of GSH post-Au ENP exposure recorded at 24.04 μM and 46.07 μM in A549 and 16HBE14o− cells respectively. Ag ENPs, even at significantly lower concentrations than Au ENPs induced a similar oxidative stress response to that of the Au ENPs, with a greater than the 4-fold loss of GSH at the mid-range ENP concentration used with A549 cells. In , both Au and Ag ENPs are inducing a slightly higher oxidative stress response in A549 cells than 16HBE14o−. Both IL-6 and IL-8 (pro-)inflammatory responses were assessed in the lung epithelial cell lines following acute exposure to Au and Ag ENPs, but unfortunately due to interaction of the particles with the ELISA assay, data from these two endpoints was unreliable and therefore, not shown in this manuscript (Brown et al. Citation2010; Kroll et al. Citation2012; Ong et al. Citation2014).
Figure 6. Quantity of the antioxidant reduced GSH (glutathione) present following 24-h exposure to increasing concentrations of (A) Au ENPs and (B) Ag ENPs upon both A549 and 16HBE14o− cell lines. Data presented as the mean ± SEM of two biological replicates, analyzed in triplicate. Significance in relation to the negative control is indicated as follows: *p ≤ 0.05, **p ≤ 0.01, ***p ≤ 0.001, and ****p ≤ 0.0001.
3.4. Lung epithelial monoculture in vitro genotoxic response
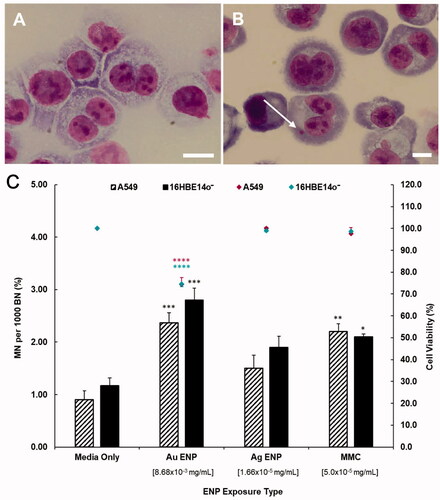
The genotoxic response observed in both 16HBE14o− and A549 epithelial cells was very similar with both Au (8.68 × 10⁻³ mg/mL) and Ag (1.66 × 10⁻⁵ mg/mL) ENPs inducing an increase in MN frequency in both cell lines at sub-lethal exposure concentrations (). Au ENPs exhibit a significantly greater genotoxic effect across both epithelial cell lines, with the MN frequency post 24-h Au ENP exposure significantly higher (p ≤ 0.001) and over two-fold greater than that seen with the ENP-untreated, negative control (cell culture media only). This level of MN induction even surpasses that of the positive control chemical control (MMC) (). Au ENPs induced a 2.37% and 2.80% increase in the frequency of MN per binucleated (BN) cell in A549 and 16HBE14o− cell lines respectively. Conversely, Ag ENPs induced an increase in MN frequency across both A549 and 16HBE14o− cell lines (+0.60% MN/BN and +0.73% MN/BN above the negative control respectively), but this increase was not significant (p > 0.05), nor was it over two-fold higher than the negative control. Subsequently, it cannot be confirmed that Ag ENPs at 1.66 × 10⁻⁵ mg/mL did induce a genotoxic effect upon the two epithelial cell lines studied. Exposure to Au ENPs, on the other hand, not only induced an elevated genotoxic response but was shown to reduce cell proliferation and cause a significant (p ≤ 0.0001) cytostatic effect. This is indicated by an average reduction in cell viability of 25.5% in both epithelial cell lines and a percent cytostasis of 65.87% (A549) and 65.13% (16HBE14o−) relative to that of the untreated, negative control. In further support of Au ENP induced cytostasis, the number of mononucleated cells present post 24-h Au ENP exposure was significantly higher (p ≤ 0.0001), with a six-fold increase above that of the controls in both epithelial cell lines. On average, the other ENP exposures exhibited ∼600–700 mononucleates per 1000 binucleates, whilst acute exposure to Au ENPs induced an average number of 3777.67 and 3755.33 mononucleates in A549 and 16HBE14o− cells, respectively.
Figure 7. Cytokinesis-block micronucleus data displaying the cytotoxic, genotoxic and proliferative effect of 24-h exposure to Au and Ag ENPs. Light microscopy images (100×) of untreated, giemsa stained A549 cells highlighting (A) both mononucleated and BN epithelial cells and (B) a BN cell with a MN present. Cytotoxicity (cell viability) and genotoxicity (the percentage MN frequency per 1000 BN cells) of A549 and 16HBE14o− cells post 24-h Au and Ag exposure are displayed in (C). Data presented as the mean ± SEM of three biological replicates, where for each exposure, 1000 binucleated cells were scored per replicate for each dose point using the cytokinesis-block version of the MN assay (3000 binucleate cells scored in total per dose). Significance in relation to the negative control is indicated as follows: *p ≤ 0.05, **p ≤ 0.01, ***p ≤ 0.001, and ****p ≤ 0.0001.
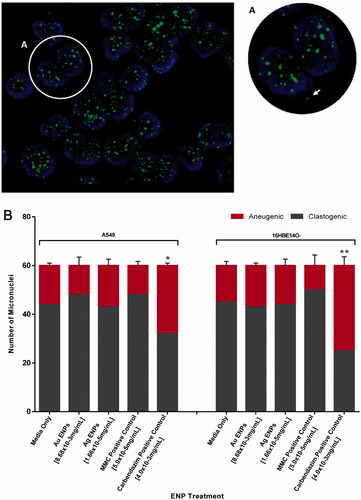
Without exposure to a chemical agent or ENP, the MN formed in both epithelial cell lines were alike, with the majority of MN having clastogenic origin whereby over 70% of the MN identified lacked a centromeric fragment suggestive of chromosomal loss. Out of the 60 binucleates with MN scored, only 16 and 15 binucleates, post-Au ENP (8.68 × 10⁻³ mg/mL) exposure displayed chromosomal loss or aneugenic MN in A549 and 16HBE14o− cells respectively (). This could suggest that Au ENPs employ a clastogenic mechanism for inducing genotoxicity more frequently than aneugenic mechanisms. However, indicates that the proportion of MN observed to have a clastogenic origin in comparison to an aneugenic origin was not significantly different from that of the negative controls. Ag ENPs were shown to exhibit a similar genotoxic response to that of the negative control, further confirming a concentration of 1.66 × 10⁻⁵ mg/mL did not induce any elevated genotoxicity, let alone show a definitive clastogenic or aneugenic mechanism.
Figure 8. Clastogenic and aneugenic micronucleus staining in A549 and 16HBE14o− epithelial cells following 24-h exposure to the mid-range concentrations of Au and Ag ENPs. Post 24-h exposure to 8.68 × 10⁻³ mg/mL Au ENPs, (A) highlights a binucleated A549 cell displaying a micronucleus of aneugenic origin, loss of a whole chromosome, indicated by the green FITC fluorescence signal in the micronucleus identified by the white arrow. DAPI (blue) stain indicating cellular nuclei whilst FITC (green) fluorescence signifies the centromere. (B) displays the ratio of clastogenic and aneugenic events in micronuclei formation following 24-h exposure to the mid-range concentrations of Au and Ag ENPs. Data is presented as the mean ± SEM of three biological replicates. Significance in relation to the negative control is indicated as follows: *p ≤ 0.05, **p ≤ 0.01, and ****p ≤ 0.0001.
3.5. ENP associated impact upon lung epithelial cell telomeric status in vitro
Q-FISH analysis () displayed that there did not appear to be any significant fragmentation or segregation of telomeric regions, or in the chromosomes themselves, in either epithelial cell line following Au (8.68 × 10⁻³ mg/mL) or Ag (1.66 × 10⁻⁵ mg/mL) ENP exposure.
Figure 9. Average telomere length of A549 and 16HBE14o− cell lines, indicated by the average median FITC-A fluorescence following 24-h exposure to the mid-range concentrations of Au and Ag ENPs. Data is presented as the mean ± SEM of three biological replicates.
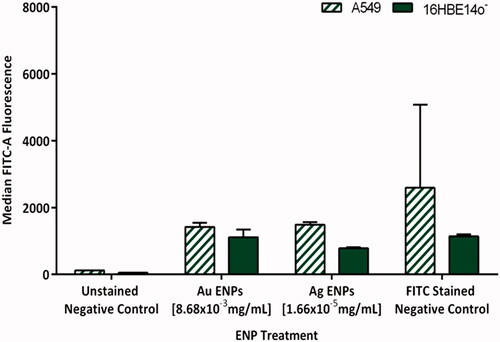
Flow cytometry analysis displayed a non-significant, slight reduction, in Tel-C FITC-A fluorescence following 24-h exposure to Au and Ag ENPs in both epithelial cell lines. Although, this effect appeared to be greatest in the A549 cell line. highlights that both Ag and Au ENPs appeared to induce a similar reduction in telomere length in the A549 epithelial cells, with an average median FITC-A fluorescence of 1418 and 1548 respectively. In contrast, acute exposure to 1.66 × 10⁻⁵ mg/mL Ag ENPs in 16HBE14o− cells displayed a greater reduction in FITC-A fluorescence than that following Au ENP exposure, with 845 post Ag ENP exposure and only 977 post-Au ENP exposure. Overall, in A549 cells, the telomere length tends to be greater with the FITC stained negative control almost double that of 16HBE14o− cells, this could be attributable to their tumor-based origin and the potential presence of active telomerase, which allows malignant cells to elongate and restore their telomeres following attrition; a mechanism employed by cancerous cells to avoid cellular senescence.
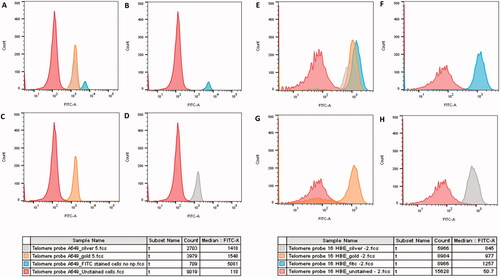
Figure 10. Flow cytometry histograms depicting the Tel-C FITC-A fluorescence emitted following 24-h exposure to 8.68 × 10⁻³ mg/mL Au and 1.66 × 10⁻⁵mg/mL Ag ENPs on A549 (A–D) and 16HBE14o− (E–H) cells. (A) and (E) display an overlay of all two ENP exposures and controls, whilst (B) and (F) shows the negative, unstained control and the positive Tel-C FITC only stained positive control. Shifts in FITC-A fluorescence indicating Tel-C FITC probe and telomere hybridization following Au (C, G), and Ag (D, H) ENP exposure. Color key below displays the average median FITC-A fluorescence. Data is presented as the mean ± SEM of three biological replicates.
4. Discussion
Lung deposition of ENPs can vary considerably, with primary or agglomerated ENPs between 10 and 100 nm more likely to deposit deeper into the alveolar regions, whilst ENPs >100 nm are more likely to remain higher up in the tracheobronchial regions; thus it is imperative to compare effects upon epithelial barrier cells from multiple regions (Braakhuis et al. Citation2014). Subsequently, both A549 and 16HBE14o− cell lines were selected as they have phenotypes originating from different, yet equally important regions of the lower lung. Similarly, to Heijink et al. (Citation2010), the 16HBE14o− cells formed a tighter monolayer and exhibited a stronger barrier function than that of the A549 cells (Heijink et al. Citation2010). Yet, even with limitations, both cell types have proved suitable model systems for in vitro ENP inhalation-based toxicity assessment (Rothen-Rutishauser et al. Citation2012). Low-dose ENP exposures were conducted over a period of 24 h to mimic an exposure dose with greater physiological relevance and thus provide a more realistic evaluation of the potential hazards associated with inhalation exposure to Au and Ag ENPs. Although the two ENPs share a similar size, geometry and polymer surface coating, the varying concentrations and physico-chemical characteristics (e.g. core composition, solubility) could offer an explanation to the different biological responses observed. For example, with soluble metallic ENPs, like Ag, there is the question as to whether the toxicity observed is caused directly by the ENPs themselves or from the release of metal ions (Caballero-Díaz et al. Citation2013). These ENPs are known to elicit ROS and free radical-mediated toxicity via Fenton-type reactions which can influence intracellular ion concentrations and disrupt the REDOX homeostasis of the cell (Manke et al. Citation2013; Khanna et al. Citation2015; Llewellyn, Conway, et al. Citation2021). It is also known that ENP concentration plays a pivotal role in ENP associated cytotoxicity and this was illustrated in the concentration-dependent response observed post 24-h exposure to increasing concentrations of both Au and Ag ENPs. However, even with the disparity in ENP concentrations, there was significantly greater toxicity observed across both epithelial cell lines following Au ENP exposure compared to that of the Ag ENPs. This was quite striking, as literature, albeit conflicting, often refers to Au ENPs being biocompatible and ‘non-toxic’ whilst Ag ENPs are often linked with cytotoxicity (AshaRani, Hande, and Valiyaveettil Citation2009; Gerber et al. Citation2013; Gliga et al. Citation2014; Khanna et al. Citation2015; Zhang, Shen, and Gurunathan Citation2016; Murali, Neelakandan, and Thomas Citation2018).
Many ENPs are known ROS inducers, which can result in cellular dysfunction and a series of pathological events, as ROS are highly reactive free radicals known to structurally modify and severely impair the functionality of cellular macromolecules (i.e. proteins, lipids, and DNA) (Khanna et al. Citation2015). Elevated levels of ROS are lessened by the presence of the antioxidant, Glutathione (GSH) which acts as a scavenger for ROS via a REDOX reaction, and so the concentration of GSH can provide a reliable biomarker for indicating cellular oxidative stress (Clift et al. Citation2010). Whilst the 14.6 nm PMA coated Ag ENPs used in this study did not show any significant cytotoxicity in the applied concentration range, nor any changes to cellular morphology, there was a significant loss in the antioxidant, reduced GSH, suggestive of elevated oxidative stress. The loss of GSH was not found to be Ag ENP concentration-dependent, and thus suggests that merely the presence of Ag ENPs and potential release of Ag+ ions, even at sub-lethal concentrations, may be enough to induce an oxidative stress response. With the exception of elevated oxidative stress, acute exposure to <3.32 × 10⁻⁵ mg/mL of 14.6 nm Ag ENPs did not induce any further cytotoxicity, yet Ag ENPs have been previously linked to reduced cell viability, morphological changes, mitochondrial dysfunction, inflammation, profibrotic activation, DNA damage and apoptosis in the literature (Gliga et al. Citation2014, Citation2018; Zhang, Shen, and Gurunathan Citation2016; Akter et al. Citation2018; Rosário et al. Citation2018; Ferdous and Nemmar Citation2020; Bobyk et al. Citation2021). The disparity amongst the preexisting literature and this study alone could be attributable to the specific physicochemical parameters of the specific Ag particles and the very low concentrations of Ag ENPs used, and if a greater concentration of ENPs had been employed or if the ENP concentration range were administered repeatedly over an extended period of time, significant toxicity may have been observed in both cell lines. This not only highlights that there could be potential for biologically safe limits of ENP exposure to be determined, but it further highlights the substantial variation in experimental design and the lack of a standardized approach to ENP hazard assessment and regulation. In the future, it might be more physiologically relevant to perform extended or repeated low-dose exposures to assess the bioaccumulation and persistence of Ag ENPs within biological systems to establish any long-term ENP mediated adverse outcomes (Comfort et al. Citation2014; Gliga et al. Citation2018).
Unexpectedly, acute exposure to Au ENPs induced a myriad of toxicological outcomes, including a significant reduction in GSH, with the medium-range dose of 8.68 × 10⁻³ mg/mL inducing the greatest oxidative stress. Despite the elevated oxidative stress observed with all concentrations of both Au and Ag ENP exposures, significant cytotoxicity was only observed following exposure to >8.68 × 10⁻³ mg/mL of Au ENPs. Yen, Hsu, and Tsai (Citation2009) showed that (2–40 nm) citrate coated Au ENPs at 0.01 mg/mL were taken up by murine macrophages (J774.A1) more efficiently and elicited greater cytotoxicity than Ag ENPs of the same size, surface coating and exposure parameters (i.e. ENP concentration and exposure time) which further supports that Au ENPs themselves may be more toxic than first thought (Yen, Hsu, and Tsai Citation2009). In addition, the cLSM results displayed a change in cellular morphology involving a more granulated and condensed epithelial cytoskeleton with irregularly shaped nuclei and evidence of nuclear degradation; morphological features that are characteristic of apoptosis, consistent with previous findings with other cells (Ma et al. Citation2017). Similar observations of a modified, condensed cellular morphology with disruption to the actin cytoskeleton were seen in both A549 epithelial and Balb-3T3 fibroblast cells following both a 48 and 72 h exposure to 33 nm and 5–15 nm citrate-stabilized Au ENPs respectively (Patra et al. Citation2007; Coradeghini et al. Citation2013). Furthermore, another study conducted with 12 nm, citrate-capped Au ENPs at a similar concentration (8 µg/mL) to that used in the present study were found to induce a significant increase in ROS production in human endothelial (HUVEC) cells over the 57-day long-term exposure regime (Gunduz et al. Citation2017).
A factor of great concern is the significant oxidative stress observed in both A549 and 16HBE14o− cells following acute exposure to 16.5 nm Au and 14.6 nm Ag ENPs, as this could give rise to indirect, primary genotoxicity. ROS have been shown to interact directly with DNA, disrupting DNA complexes, inducing DNA strand breaks, genetic mutations, chromosomal aberrations and alterations in gene transcription (Buzea, Pacheco, and Robbie Citation2007; Oberdörster, Stone, and Donaldson Citation2007; Singh et al. Citation2009; Manke et al. Citation2013). To assess this, the mid-range concentrations of both Au (8.68 × 10⁻³ mg/mL) and Ag (1.66 × 10⁻⁵ mg/mL) ENPs were selected for genotoxicity analysis, as <5.0% cell death was induced which ensures the DNA damage (i.e. micronuclei formation) observed was authentic and not just debris from apoptotic cells. Despite the elevated oxidative stress observed with both ENPs, significant cytostasis and genotoxicity was only observed following exposure to the sub-lethal concentration of 8.68 × 10⁻³ mg/mL Au ENPs. Acute 24-h exposure to Au ENPs induced a 2.63- (A549) and 2.40-fold (16HBE14o−) increase in MN frequency, predominantly originating from clastogenic mechanisms (e.g. chromosome fragmentation). Substances deemed to be DNA reactive clastogens are generally considered not to have any safe level of human exposure, as they often pose a carcinogenic threat even at very low-doses (Kirkland et al. Citation2016; Brandsma et al. Citation2020). In line with elevated cytostasis and a 6-fold increase in the number of mononucleated cells present, it is hypothesized that the significant genotoxicity caused by Au ENP exposure is inducing a cell cycle stall to allow for DNA repair to occur before cell proliferation can resume. Biogenic 37 nm Au ENPs have been shown to induce cell cycle arrest at the G2 phase and a similar reduction in A549 cell proliferation following a 24-h exposure to 14 μg/mL (Ramalingam et al. Citation2016). Alongside this, Ramalingam et al. (Citation2016) highlighted an elevated presence of ROS, which was also indicated in this study. With this in mind and based on the concentration-dependent cytotoxicity and elevated oxidative stress induced by acute exposure to Au ENPs, it is believed that the DNA damage observed could be attributable to a primary, indirect mechanism of oxidative stress. It is surmised that an elevated presence of ROS causes increased oxidation of DNA guanine residues to 8-oxoGua lesions which in turn give rise to DNA strand breaks and chromosome fragmentation; indicated by the elevated MN frequency. As a result, the epithelial cells are forced into a cell cycle arrest to allow for DNA repair mechanisms to restore the damage before cell proliferation can resume.
Elevated ROS not only interacts with the structure and function of particular proteins involved in DNA replication and repair, but it can modify the formation and maintenance of the guanine-rich regions (e.g. telomeric structures) by nucleotide base transversion. If not repaired correctly by DNA repair mechanisms, like nucleotide excision repair (NER), the oxidative DNA damage lesions can interfere with the replication fork and can impede the Shelterin complex sub-units, TRF1 and TRF2, from binding (Passos, Saretzki, and von Zglinicki Citation2007; Coluzzi et al. Citation2014). As a result, telomere capping cannot be performed correctly, and so telomere dysfunction and enhanced shortening on successive cellular replications ensues, often leading to premature cell death. It is apparent that ENPs can impact telomere length and function, if not through oxidative stress-induced damage, then direct ENP-DNA interaction, the down-regulation of telomerase (germline/cancer cell-specific), or disruption to the Shelterin complex, as previously reported with Ag ENPs (Kheng Citation2013; Chen et al. Citation2018). Coluzzi et al. (Citation2014), highlighted that telomeric shortening, because of persistent DNA damage, was only visible 48 h after oxidative stress treatment in MRC-5 cells. It was hypothesized that telomere damage occurred during the first cell cycle (∼21 h) and so modifications to telomere length were only visible following DNA replication (Coluzzi et al. Citation2014). Taking this into consideration, any modifications to telomere length in this study may not have been visible within the time period tested, since both epithelial cell lines were harvested immediately after the 24-h ENP exposure. In addition, the reduced proliferation of both A549 and 16HBE14o− cells might make determining the full impact of acute ENP exposure upon telomere length difficult, as the second cycle of replication is required to establish how much of the telomere is left to replicate. Based on telomeric FACS staining, whilst Au (8.68 × 10⁻³ mg/mL) and Ag (1.66 × 10⁻⁵ mg/mL) ENPs did not significantly reduce telomere length in either A549 or 16HBE14o− cell lines, there was a slight reduction seen across both cell lines. It could be suggested that a further reduction in telomere length may have been observed if the cells were harvested after a period of ‘recovery’ (i.e. an additional cell cycle). Whilst a similar telomeric response was observed across the two epithelial cell lines, it is important to consider that adenocarcinoma-derived, A549 cells, may still possess active telomerase complexes (e.g. hTERT) to re-build the telomeric regions (Ankur et al. Citation2017). This too could mask the true effects of Au and Ag ENP mediated toxicity on telomeric length and function in healthy somatic cells. A549 cells, whilst slightly more sensitive for in vitro cytotoxicity assessment than 16HBE14o− cells, may lack the equivalent authentic response to a genotoxic agent on account of their origin and extensive sub-culture undertaken on the cell line as a whole. That said, in the present study, a background MN frequency of only 0.9% in comparison to the 1.17% in 16HBE14o− cells suggests they have a fairly stable genetic background and respond in a similar manner to alternative lung epithelial cell lines.
5. Conclusion
To conclude, whilst acute exposure to 14.6 nm Ag ENPs did not appear to induce any adverse toxicological implications upon either lung epithelial cells in vitro, they did induce an increased oxidative stress response irrespective of concentration, beyond that of the negative control. Au ENPs of a similar size (16.5 nm), geometry, and polymer surface coating did, however, cause significant cytotoxicity, ROS production, reduced cell proliferation, and genotoxicity in a concentration-dependent manner. Furthermore, it was hypothesized that the adverse toxicological response observed was predominantly due to indirect primary mechanisms of oxidative stress. Albeit insignificant, the small reduction in telomere length observed following acute exposure to sub-lethal concentrations of Au and Ag ENPs indicates potential for ENP mediated telomere attrition, though further work is needed to confirm this. Lastly, it can be concluded that both epithelial cell lines, A549 and 16HBE14o−, albeit with known limitations and slight varying sensitivities toward specific endpoints, are equally as reliable and suitable as a system for assessing ENP inhalation hazard in vitro.
Acknowledgment
The authors would like to thank Professor Dieter C. Gruenert (Cardiovascular Research Institute, University of California, San Francisco), for the 16HBE14o− cell line.
Disclosure statement
No potential conflict of interest was reported by the author(s).
Correction Statement
This article has been corrected with minor changes. These changes do not impact the academic content of the article.
Additional information
Funding
References
- Akter, M., M. T. Sikder, M. M. Rahman, A. K. M. A. Ullah, K. F. B. Hossain, S. Banik, T. Hosokawa, T. Saito, and M. Kurasaki. 2018. “A Systematic Review on Silver Nanoparticles-Induced Cytotoxicity: Physicochemical Properties and Perspectives.” Journal of Advanced Research 9: 1–16. doi:https://doi.org/10.1016/j.jare.2017.10.008.
- Ali, Z., A. Z. Abbasi, F. Zhang, P. Arosio, A. Lascialfari, M. F. Casula, A. Wenk, et al. 2011. “Multifunctional Nanoparticles for Dual Imaging.” Analytical Chemistry 83 (8): 2877–2882. doi:https://doi.org/10.1021/ac103261y.
- Ankur, P., J. Grishma, F. Yunke, S. Sherwin, and M. Angelo. 2017. “Telomere Elongation and Telomerase Activity in Normal and Cancer Cell Lines: HEK-293, HeLa and A549.” bioRxiv 1–8.
- AshaRani, P., M. P. Hande, and S. Valiyaveettil. 2009. “Anti-Proliferative Activity of Silver Nanoparticles.” BMC Cell Biology 10 (1): 65. doi:https://doi.org/10.1186/1471-2121-10-65.
- Bakand, S., and A. Hayes. 2016. “Toxicological Considerations, Toxicity Assessment, and Risk Management of Inhaled Nanoparticles.” International Journal of Molecular Sciences 17 (6): 929. doi:https://doi.org/10.3390/ijms17060929.
- Bobyk, L., A. Tarantini, D. Beal, G. Veronesi, I. Kieffer, S. Motellier, E. Valsami-Jones, et al. 2021. “Toxicity and Chemical Transformation of Silver Nanoparticles in A549 Lung Cells: Dose-Rate-Dependent Genotoxic Impact.” Environmental Science: Nano 8 (3): 806–821. doi:https://doi.org/10.1039/D0EN00533A.
- Braakhuis, H. M., M. V. D. Z. Park, I. Gosens, W. H. de Jong, and F. R. Cassee. 2014. “Physicochemical Characteristics of Nanomaterials That Affect Pulmonary Inflammation.” Particle and Fibre Toxicology 11: 18. doi:https://doi.org/10.1186/1743-8977-11-18.
- Brandsma, I., N. Moelijker, R. Derr, and G. Hendriks. 2020. “Aneugen versus Clastogen Evaluation and Oxidative Stress-Related Mode-of-Action Assessment of Genotoxic Compounds Using the ToxTracker Reporter Assay.” Toxicological Sciences 177 (1): 202–213. doi:https://doi.org/10.1093/toxsci/kfaa103.
- Brown, D. M., C. Dickson, P. Duncan, F. Al-Attili, and V. Stone. 2010. “Interaction between Nanoparticles and Cytokine Proteins: Impact on Protein and Particle Functionality.” Nanotechnology 21 (21): 215104. doi:https://doi.org/10.1088/0957-4484/21/21/215104.
- Brown, D. M., M. R. Wilson, W. MacNee, V. Stone, and K. Donaldson. 2001. “Size-Dependent Proinflammatory Effects of Ultrafine Polystyrene Particles: A Role for Surface Area and Oxidative Stress in the Enhanced Activity of Ultrafines.” Toxicology and Applied Pharmacology 175 (3): 191–199. doi:https://doi.org/10.1006/taap.2001.9240.
- Bruinink, A., J. Wang, and P. Wick. 2015. “Effect of Particle Agglomeration in Nanotoxicology.” Archives of Toxicology 89 (5): 659–675. doi:https://doi.org/10.1007/s00204-015-1460-6.
- Buzea, C., I. I. Pacheco, and K. Robbie. 2007. “Nanomaterials and Nanoparticles: Sources and Toxicity.” Biointerphases 2 (4): MR17. doi:https://doi.org/10.1116/1.2815690.
- Caballero-Díaz, E., C. Pfeiffer, L. Kastl, P. Rivera-Gil, B. Simonet, M. Valcárcel, J. Jiménez-Lamana, F. Laborda, and W. J. Parak. 2013. “The Toxicity of Silver Nanoparticles Depends on Their Uptake by Cells and Thus on Their Surface Chemistry.” Particle & Particle Systems Characterization 30 (12): 1079–1085. doi:https://doi.org/10.1002/ppsc.201300215.
- Chen, B., Y. Zhang, Y. Yang, S. Chen, A. Xu, L. Wu, and S. Xu. 2018. “Involvement of Telomerase Activity Inhibition and Telomere Dysfunction in Silver Nanoparticles Anticancer Effects.” Nanomedicine 13 (16): 2067–2082. doi:https://doi.org/10.2217/nnm-2018-0036.
- Clift, M. J. D., M. S. P. Boyles, D. M. Brown, and V. Stone. 2010. “An Investigation into the Potential for Different Surface-Coated Quantum Dots to Cause Oxidative Stress and Affect Macrophage Cell Signalling in Vitro.” Nanotoxicology 4 (2): 139–149. ., doi:https://doi.org/10.3109/17435390903276925.
- Clift, M. J., B. Rothen-Rutishauser, D. M. Brown, R. Duffin, K. Donaldson, L. Proudfoot, K. Guy, and V. Stone. 2008. “The Impact of Different Nanoparticle Surface Chemistry and Size on Uptake and Toxicity in a Murine Macrophage Cell Line.” Toxicology and Applied Pharmacology 232 (3): 418–427. doi:https://doi.org/10.1016/j.taap.2008.06.009.
- Coluzzi, E., M. Colamartino, R. Cozzi, S. Leone, C. Meneghini, N. O’Callaghan, and A. Sgura. 2014. “Oxidative Stress Induces Persistent Telomeric DNA Damage Responsible for Nuclear Morphology Change in Mammalian Cells.” PLoS One 9 (10): e110963. doi:https://doi.org/10.1371/journal.pone.0110963.
- Coluzzi, E., S. Leone, and A. Sgura. 2019. “Oxidative Stress Induces Telomere Dysfunction and Senescence by Replication Fork Arrest.” Cells 8 (1): 19. doi:https://doi.org/10.3390/cells8010019.
- Comfort, K. K., L. K. Braydich-Stolle, E. I. Maurer, and S. M. Hussain. 2014. “Less is More: Long-Term in Vitro Exposure to Low Levels of Silver Nanoparticles Provides New Insights for Nanomaterial Evaluation.” ACS Nano 8 (4): 3260–3271. doi:https://doi.org/10.1021/nn5009116.
- Conway, G. E., U.-K. Shah, S. v Llewellyn, T. Cervena, S. J. Evans, A. Al Ali, G. J. S. Jenkins, M. J. D. Clift, and S. H. Doak. 2020. “Adaptation of the in Vitro Micronucleus Assay for Genotoxicity Testing Using 3D Liver Models Supporting Longer-Term Exposure Durations.” Mutagenesis 35 (4): 319–330. doi:https://doi.org/10.1093/mutage/geaa018.
- Coradeghini, R., S. Gioria, C. P. García, P. Nativo, F. Franchini, D. Gilliland, J. Ponti, and F. Rossi. 2013. “Size-Dependent Toxicity and Cell Interaction Mechanisms of Gold Nanoparticles on Mouse Fibroblasts.” Toxicology Letters 217 (3): 205–216. doi:https://doi.org/10.1016/j.toxlet.2012.11.022.
- Donaldson, K., V. Stone, C. L. Tran, W. Kreyling, and P. J. A. Borm. 2004. “Nanotoxicology.” Occupational and Environmental Medicine 61 (9): 727–728. doi:https://doi.org/10.1136/oem.2004.013243.
- Evans, S. J., M. J. D. Clift, N. Singh, J. de Oliveira Mallia, M. Burgum, J. W. Wills, T. S. Wilkinson, G. J. S. Jenkins, and S. H. Doak. 2017. “Critical Review of the Current and Future Challenges Associated with Advanced in Vitro Systems towards the Study of Nanoparticle (Secondary) Genotoxicity.” Mutagenesis 32 (1): 233–241. doi:https://doi.org/10.1093/mutage/gew054.
- Ferdous, Z., and A. Nemmar. 2020. “Health Impact of Silver Nanoparticles: A Review of the Biodistribution and Toxicity following Various Routes of Exposure.” International Journal of Molecular Sciences 21 (7): 2375. doi:https://doi.org/10.3390/ijms21072375.
- Filipponi, L., and D. Sutherland. 2013. “Nanotechnologies - Principles, Applications, Implications and Hands-on Activites.” https://edu.rsc.org/review/nanotechnologies-principles-applications-implications-and-hands-on-activities/2000482.article
- Fouquerel, E., R. P. Barnes, S. Uttam, S. C. Watkins, M. P. Bruchez, and P. L. Opresko. 2019. “Targeted and Persistent 8-Oxoguanine Base Damage at Telomeres Promotes Telomere Loss and Crisis.” Molecular Cell 75 (1): 117–130. doi:https://doi.org/10.1016/j.molcel.2019.04.024.
- Fu, P. P., Q. Xia, H. M. Hwang, P. C. Ray, and H. Yu. 2014. “Mechanisms of Nanotoxicity: Generation of Reactive Oxygen Species.” Journal of Food and Drug Analysis 22 (1): 64–75. doi:https://doi.org/10.1016/j.jfda.2014.01.005.
- Gerber, A., M. Bundschuh, D. Klingelhofer, and D. A. Groneberg. 2013. “Gold Nanoparticles: Recent Aspects for Human Toxicology.” Journal of Occupational Medicine and Toxicology (London, England) 8 (1): 32. doi:https://doi.org/10.1186/1745-6673-8-32.
- Gliga, A. R., S. di Bucchianico, J. Lindvall, B. Fadeel, and H. L. Karlsson. 2018. “RNA-Sequencing Reveals Long-Term Effects of Silver Nanoparticles on Human Lung Cells.” Scientific Reports 8 (1): 6668. doi:https://doi.org/10.1038/s41598-018-25085-5.
- Gliga, A. R., S. Skoglund, I. O. Wallinder, B. Fadeel, and H. L. Karlsson. 2014. “Size-Dependent Cytotoxicity of Silver Nanoparticles in Human Lung Cells: The Role of Cellular Uptake, Agglomeration and Ag Release.” Particle and Fibre Toxicology 11: 11. doi:https://doi.org/10.1186/1743-8977-11-11.
- Gunduz, N., H. Ceylan, M. O. Guler, and A. B. Tekinay. 2017. “Intracellular Accumulation of Gold Nanoparticles Leads to Inhibition of Macropinocytosis to Reduce the Endoplasmic Reticulum Stress.” Scientific Reports 7 (1): 40493. doi:https://doi.org/10.1038/srep40493.
- Heijink, I. H., S. M. Brandenburg, J. A. Noordhoek, D. S. Postma, D. J. Slebos, and A. J. M. van Oosterhout. 2010. “Characterisation of Cell Adhesion in Airway Epithelial Cell Types Using Electric Cell-Substrate Impedance Sensing.” The European Respiratory Journal 35 (4): 894–903. doi:https://doi.org/10.1183/09031936.00065809.
- Herzog, F., M. J. Clift, F. Piccapietra, R. Behra, O. Schmid, A. Petri-Fink, and B. Rothen-Rutishauser. 2013. “Exposure of Silver-Nanoparticles and Silver-Ions to Lung Cells in Vitro at the Air-Liquid Interface.” Particle and Fibre Toxicology 10 (1): 11. doi:https://doi.org/10.1186/1743-8977-10-11.
- Huang, X., and M. A. El-Sayed. 2010. “Gold Nanoparticles: Optical Properties and Implementations in Cancer Diagnosis and Photothermal Therapy.” Journal of Advanced Research 1 (1): 13–28. doi:https://doi.org/10.1016/j.jare.2010.02.002.
- Hühn, J., C. Carrillo-Carrion, M. G. Soliman, C. Pfeiffer, D. Valdeperez, A. Masood, I. Chakraborty, et al. 2017. “Selected Standard Protocols for the Synthesis, Phase Transfer, and Characterization of Inorganic Colloidal Nanoparticles.” Chemistry of Materials 29 (1): 399–461. doi:https://doi.org/10.1021/acs.chemmater.6b04738.
- Jochums, A., E. Friehs, F. Sambale, A. Lavrentieva, D. Bahnemann, and T. Scheper. 2017. “Revelation of Different Nanoparticle-Uptake Behavior in Two Standard Cell Lines NIH/3T3 and A549 by Flow Cytometry and Time-Lapse Imaging.” Toxics 5 (3): 15. doi:https://doi.org/10.3390/toxics5030015.
- Khanna, P., C. Ong, B. Bay, and G. Baeg. 2015. “Nanotoxicity: An Interplay of Oxidative Stress, Inflammation and Cell Death.” Nanomaterials 5 (3): 1163–1180. doi:https://doi.org/10.3390/nano5031163.
- Kheng, L. H. 2013. “Inhibition of DNA Repair Factors Sensitizes Human Cancer Cells to Silver Nanoparticles Toxicity: mechanistic Insights and Implications in Cancer Therapy.” PhD diss., National University of Singapore.
- Kirkland, D., P. Kasper, H. J. Martus, L. Müller, J. van Benthem, F. Madia, and R. Corvi. 2016. “Updated Recommended Lists of Genotoxic and Non-Genotoxic Chemicals for Assessment of the Performance of New or Improved Genotoxicity Tests.” Mutation Research. Genetic Toxicology and Environmental Mutagenesis 795: 7–30. doi:https://doi.org/10.1016/j.mrgentox.2015.10.006.
- Kroll, A., M. H. Pillukat, D. Hahn, and J. Schnekenburger. 2012. “Interference of Engineered Nanoparticles with in Vitro Toxicity Assays.” Archives of Toxicology 86 (7): 1123–1136. doi:https://doi.org/10.1007/s00204-012-0837-z.
- Llewellyn, S. V., G. E. Conway, I. Zanoni, A. K. Jørgensen, U.-K. Shah, D. A. Seleci, J. G. Keller, et al. 2021. “Understanding the Impact of More Realistic Low-Dose, Prolonged Engineered Nanomaterial Exposure on Genotoxicity Using 3D Models of the Human Liver.” Journal of Nanobiotechnology 19 (1): 193. doi:https://doi.org/10.1186/s12951-021-00938-w.
- Llewellyn, S. V., M. Niemeijer, P. Nymark, M. J. Moné, B. Water, G. E. Conway, G. J. S. Jenkins, and S. H. Doak. 2021. “In Vitro Three‐Dimensional Liver Models for Nanomaterial DNA Damage Assessment.” Small 17 (15): 2006055. doi:https://doi.org/10.1002/smll.202006055.
- Ma, X., R. Hartmann, D. Jimenez De Aberasturi, F. Yang, S. J. H. Soenen, B. B. Manshian, J. Franz, et al. 2017. “Colloidal Gold Nanoparticles Induce Changes in Cellular and Subcellular Morphology.” ACS Nano 11 (8): 7807–7820. doi:https://doi.org/10.1021/acsnano.7b01760.
- Malsch, I., and C. Emond. 2013. Nanotechnology and Human Health. Boca Raton, FL: CRC Press.
- Ma, J., R. R. Mercer, M. Barger, D. Schwegler-Berry, J. M. Cohen, P. Demokritou, and V. Castranova. 2015. “Effects of Amorphous Silica Coating on Cerium Oxide Nanoparticles Induced Pulmonary Responses.” Toxicology and Applied Pharmacology 288 (1): 63–73. doi:https://doi.org/10.1016/j.taap.2015.07.012.
- Manke, A., L. Wang, Y. Rojanasakul, A. Manke, L. Wang, and Y. Rojanasakul. 2013. “Mechanisms of Nanoparticle-Induced Oxidative Stress and Toxicity.” BioMed Research International 2013: 942916. doi:https://doi.org/10.1155/2013/942916.
- Manshian, B. B., N. Singh, and S. H. Doak. 2013. “The in Vitro Micronucleus Assay and Kinetochore Staining: Methodology and Criteria for the Accurate Assessment of Genotoxicity and Cytotoxicity.” Methods in Molecular Biology 1044: 269–289.
- Mendes, R., P. Pedrosa, J. C. Lima, A. R. Fernandes, and P. V. Baptista. 2017. “Photothermal Enhancement of Chemotherapy in Breast Cancer by Visible Irradiation of Gold Nanoparticles.” Scientific Reports 7 (1): 10872. doi:https://doi.org/10.1038/s41598-017-11491-8.
- Murali, K., M. S. Neelakandan, and S. Thomas. 2018. “Biomedical Applications of Gold Nanoparticles.” JSM Nanotechnol Nanomed 6 (1): 1064.
- Oberdörster, G., V. Stone, and K. Donaldson. 2007. “Toxicology of Nanoparticles: A Historical Perspective.” Nanotoxicology 1 (1): 2–25. doi:https://doi.org/10.1080/17435390701314761.
- Ong, K. J., T. J. MacCormack, R. J. Clark, J. D. Ede, V. A. Ortega, L. C. Felix, M. K. M. Dang, et al. 2014. “Widespread Nanoparticle-Assay Interference: Implications for Nanotoxicity Testing.” PLoS One 9 (3): e90650. doi:https://doi.org/10.1371/journal.pone.0090650.
- Passos, J. F., G. Saretzki, and T. von Zglinicki. 2007. “DNA Damage in Telomeres and Mitochondria during Cellular Senescence: Is There a Connection?” Nucleic Acids Research 35 (22): 7505–7513. doi:https://doi.org/10.1093/nar/gkm893.
- Patra, H. K., S. Banerjee, U. Chaudhuri, P. Lahiri, and A. K. Dasgupta. 2007. “Cell Selective Response to Gold Nanoparticles.” Nanomedicine 3 (2): 111–119. doi:https://doi.org/10.1016/j.nano.2007.03.005.
- Pellegrino, T., R. A. Sperling, A. P. Alivisatos, and W. J. Parak. 2007. “Gel Electrophoresis of gold-DNA Nanoconjugates.” Journal of Biomedicine & Biotechnology 2007: 26796–26796. doi:https://doi.org/10.1155/2007/26796.
- Quy Nguyen, V., T. Tam Le, and T. Le. 2013. “Powerful Colloidal Silver Nanoparticles for the Prevention of Gastrointestinal Bacterial Infections Anh.” Advances in Natural Sciences: Nanoscience and Nanotechnology 3 (4): 45007.
- Ramalingam, V., S. Revathidevi, T. Shanmuganayagam, L. Muthulakshmi, and R. Rajaram. 2016. “Biogenic Gold Nanoparticles Induce Cell Cycle Arrest through Oxidative Stress and Sensitize Mitochondrial Membranes in A549 Lung Cancer Cells.” RSC Advances 6 (25): 20598–20608. doi:https://doi.org/10.1039/C5RA26781A.
- Rejman, J., M. Nazarenus, D. Jimenez de Aberasturi, A. H. Said, N. Feliu, and W. J. Parak. 2016. “Some Thoughts about the Intracellular Location of Nanoparticles and the Resulting Consequences.” Journal of Colloid and Interface Science 482: 260–266. doi:https://doi.org/10.1016/j.jcis.2016.07.065.
- Ribeiro, A. R., P. E. Leite, P. Falagan-Lotsch, F. Benetti, C. Micheletti, H. C. Budtz, N. R. Jacobsen, et al. 2017. “Challenges on the Toxicological Predictions of Engineered Nanoparticles.” NanoImpact 8: 59–72.
- Rosário, F., P. Hoet, A. J. A. Nogueira, C. Santos, and H. Oliveira. 2018. “Differential Pulmonary in Vitro Toxicity of Two Small-Sized Polyvinylpyrrolidone-Coated Silver Nanoparticles.” Journal of Toxicology and Environmental Health, Part A 81 (15): 675–690. doi:https://doi.org/10.1080/15287394.2018.1468837.
- Rothen-Rutishauser, B., M. J. D. Clift, C. Jud, A. Fink, and P. Wick. 2012. “Human Epithelial Cells in Vitro – Are They an Advantageous Tool to Help Understand the Nanomaterial-Biological Barrier Interaction?” EURO-NanoTox-Letters 4 (1): 1–19. doi:https://doi.org/10.1515/entl-2015-0004.
- Ruaro, B., F. Salton, L. Braga, B. Wade, P. Confalonieri, M. C. Volpe, E. Baratella, S. Maiocchi, and M. Confalonieri. 2021. “The History and Mystery of Alveolar Epithelial Type II Cells: Focus on Their Physiologic and Pathologic Role in Lung.” International Journal of Molecular Sciences 22 (5): 2566–2516. doi:https://doi.org/10.3390/ijms22052566.
- Shammas, M. A. 2011. “Telomeres, Lifestyle, Cancer, and Aging.” Current Opinion in Clinical Nutrition and Metabolic Care 14 (1): 28–34.
- Singh, N., B. Manshian, G. J. S. Jenkins, S. M. Griffiths, P. M. Williams, T. G. G. Maffeis, C. J. Wright, and S. H. Doak. 2009. “NanoGenotoxicology: The DNA Damaging Potential of Engineered Nanomaterials.” Biomaterials 30 (23–24): 3891–3914. doi:https://doi.org/10.1016/j.biomaterials.2009.04.009.
- Spiegel, J., S. Adhikari, and S. Balasubramanian. 2020. “The Structure and Function of DNA G-Quadruplexes.” Trends in Chemistry 2 (2): 123–136. doi:https://doi.org/10.1016/j.trechm.2019.07.002.
- Stone, V., H. Johnston, and M. J. D. Clift. 2007. “Air Pollution, Ultrafine and Nanoparticle Toxicology: Cellular and Molecular Interactions.” IEEE Transactions on Nanobioscience 6 (4): 331–340. doi:https://doi.org/10.1109/tnb.2007.909005.
- Strober, W. 2001. “Trypan Blue Exclusion Test of Cell Viability.” In Current Protocols in Immunology. Hoboken, NJ, USA: John Wiley & Sons, Inc.
- Swain, R. J., S. J. Kemp, P. Goldstraw, T. D. Tetley, and M. M. Stevens. 2010. “Assessment of Cell Line Models of Primary Human Cells by Raman Spectral Phenotyping.” Biophysical Journal 98 (8): 1703–1711. doi:https://doi.org/10.1016/j.bpj.2009.12.4289.
- Thorley, A. J., P. Ruenraroengsak, T. E. Potter, and T. D. Tetley. 2014. “Critical Determinants of Uptake and Translocation of Nanoparticles by the Human Pulmonary Alveolar Epithelium.” ACS Nano 8 (11): 11778–11789. doi:https://doi.org/10.1021/nn505399e.
- Tran, Q. H., V. Q. Nguyen, and A.-T. Le. 2013. “Silver Nanoparticles: Synthesis, Properties, Toxicology, Applications and Perspectives.” Advances in Natural Sciences: Nanoscience and Nanotechnology 4 (3): 033001.
- Tsoli, M., H. Kuhn, W. Brandau, H. Esche, and G. Schmid. 2005. “Cellular Uptake and Toxicity of Au55 Clusters.” Small 1 (8–9): 841–844. doi:https://doi.org/10.1002/smll.200500104.
- Yen, H.-J., S. Hsu, and C.-L. Tsai. 2009. “Cytotoxicity and Immunological Response of Gold and Silver Nanoparticles of Different Sizes.” Small 5 (13): 1553–1561. doi:https://doi.org/10.1002/smll.200900126.
- Zhang, X. 2015. “Gold Nanoparticles: Recent Advances in the Biomedical Applications.” Cell Biochemistry and Biophysics 72 (3): 771–775. doi:https://doi.org/10.1007/s12013-015-0529-4.
- Zhang, X.-F., W. Shen, and S. Gurunathan. 2016. “Silver Nanoparticle-Mediated Cellular Responses in Various Cell Lines: An in Vitro Model.” International Journal of Molecular Sciences 17 (10): 1603. doi:https://doi.org/10.3390/ijms17101603.