
 ?Mathematical formulae have been encoded as MathML and are displayed in this HTML version using MathJax in order to improve their display. Uncheck the box to turn MathJax off. This feature requires Javascript. Click on a formula to zoom.
Abstract
Nano-QSAR models can be effectively used for prediction of the biological activity of nanomaterials that have not been experimentally tested before. However, their use is associated with the need to have appropriate knowledge and skills in chemoinformatics. Thus, they are mainly aimed at specialists in the field. This significantly limits the potential group of recipients of the developed solutions. In this perspective, the purpose of the presented research was to develop an easily accessible and user-friendly web-based application that could enable the prediction of TiO2-based multicomponent nanomaterials cytotoxicity toward Chinese Hamster Ovary (CHO-K1) cells. The graphical user interface is clear and intuitive and the only information required from the user is the type and concentration of the metals which will be modifying TiO2-based nanomaterial. Thanks to this, the application will be easy to use not only by cheminformatics but also by specialists in the field of nanotechnology or toxicology, who will be able to quickly predict cytotoxicity of desired nanoclusters. We have performed case studies to demonstrate the features and utilities of developed application. The NanoMixHamster application is freely available at https://nanomixhamster.cloud.nanosolveit.eu/.
1. Introduction
Nano-sized materials due to their distinctive physicochemical properties have brought a great revolution in technology and industry. Unfortunately, despite their range of applications, nanomaterials may exhibit toxicity toward human beings and the environment. Most often, the toxicity of nanomaterials is determined using experimental methods. There are plenty of laboratory tests that enable toxicity evaluation among others tetrazolium reduction assays for cell viability studies, LDH assay for cell membrane integrity, comet assay for genotoxicity and immunohistochemistry biomarkers for apoptosis (Bahadar et al. Citation2016). However, all these tests have one thing in common, the need to have synthesized nanomaterials that you want to test. They are also relatively costly, time-consuming and require extensive laboratory knowledge and experience. Thus, considering time-consuming and expensive synthesis and measurement procedures, as well as the risk assessment of newly designed nanostructures with the use of laboratory animals, it is irrational to experimentally test all of them to find the most effective and less toxic nanostructure combination. This challenge can be faced by the application of appropriate computational in silico methods based on machine learning (ML) and artificial intelligence (AI), including Quantitative Structure-Biological Activity/properties Relationship (QSAR/QSPR) models (Mikolajczyk et al. Citation2018, Citation2019; Sizochenko et al. Citation2021). As a result, these models can enable preliminary screening of large amounts of nanomaterials without the need of their synthesis. The quality of computational models is inextricably linked with the data on which they are built. Models that have been trained on data covering a broader spectrum of structurally diverse substances will have a larger applicability domain, which is the physico-chemical or structural descriptors space on which the training set of the model has been developed, and for which the probability of getting reliable predictions for new compounds is higher. As the QSAR models are only an approximation of real relationships occurring between structure and biological activity and, additionally, they may have different predictive powers, special care should be taken when using them for decision making and regulatory purposes. Nevertheless, in silico models based on ML and AI may point out the nanostructure features that are crucial for the efficiency and safety of newly designed nanomaterials. These methods may prove particularly useful for eliminating nanostructures, that do not meet the biological activity and/or toxicity requirements, from a pool of materials to be synthesized and subjected to laboratory testing. For example, nanomaterials that are highly cytotoxic already at the stage of in silico research should probably not be synthesized first in order for further research.
The main problem with the actual applicability of QSAR models is the fact that they are developed by specialists in the field of chemoinformatics for other chemoinformatics specialists. Additionally, they are mainly published in specialized chemoinformatics journals, whose main readers are chemoinformatics specialists. To be able to fully utilize such QSAR models, it is required to have at least fundamental knowledge about some of the basic types of machine learning models, the ability to use specialized software or knowledge of at least one programming languages. As a result, the group of recipients of the created solutions is significantly narrowing.
Lamon et al. (Citation2019) conducted a bibliographic search on available computational models for the assessment of manufactured nanomaterials (MNs). The resulting inventory includes QSAR, QSPR, and physiologically based kinetic (PBK) models applied to MNs. Authors identified 59 publications for QSAR models (out of around 800 found in the initial search) and 29 publications for QSPR models (out of around 350 found in the initial search). The majority of the QSAR models allow the prediction of in vitro cytotoxicity in terms of various cell types. The QSPR models concern mainly carbon-based MNs such as carbon nanotubes and solubility in organic solvents. The remaining ones were developed for metal and metal oxide MNs to predict, among others, zeta potential, adsorption and binding interactions. Additionally, authors gathered details of each publication, that is, contact author, predicted endpoint, type of descriptors used in the model, information on training and validation set, applicability domain, and statistical methods. However, no particular attention was paid to the possibility of reusing the model, for example, through a web application or shared source codes used to construct the model.
Thanks to the efforts undertaken by various initiatives, such as the projects financed by the Horizon 2020 program (NanoCommons (https://www.nanocommons.eu/), NanoSolveIT (https://nanosolveit.eu/) (Afantitis et al. Citation2020), NanoinformaTIX (https://www.nanoinformatix.eu/)) or DIAGONAL (https://www.diagonalproject.eu/), the problem of limited reusability of the nano-QSAR/QSPR models is getting reduced. Among many objectives of the projects, one can find development of a user-friendly modeling toolbox, Integrated Approach to Testing and Assessment (IATA) implemented through Cloud platform, and access to the Knowledge Base. The NanoCommons e-infrastructure gives an opportunity to use services such as the Molecular Initiating Event (MIE) Prediction Tool, the Apellis (tool for read-across model development) (Varsou and Sarimveis Citation2021) and the Jaqpot (web platform for deployment, sharing and applying the in silico models). Under the NanoSolveIT project, the end-user has access to computational tools like PhysChem: Zeta potential NanoXtract model (Varsou et al. Citation2020) based on nearest neighbors method and descriptors from TEM images, CyTox model for predicting cytotoxicity of metal oxide nanomaterials to human bronchial epithelial (BEAS-2B) and murine myeloid (RAW 264.7) cell lines, the DeepDaph workflow (Karatzas et al. Citation2020) for predicting the effects of exposure to ENMs on Daphnia magna that can help with detection of possible malformations, and exposure models (NanoFASE Soil-water-organism model, human indoor air exposure model).
Here we present a new tool, the NanoMixHamster web-based application (https://nanomixhamster.cloud.nanosolveit.eu/) developed under the NanoSolveIT project, which allows the prediction of potential photocatalysts’ toxicity toward the CHO-K1 cell line (cell line initiated from a biopsy of an ovary of an adult Chinese hamster) using the structure-activity prediction network (SAPNet) approach (Rybińska-Fryca, Mikolajczyk, and Puzyn Citation2020). However, our goal is not limited only to presenting a new in silico tool, but also demonstrating how it can be used in the context of safe(r)-by-design concept via case study. Computational models implemented in web-based application may support experimental design by significantly speeding up the whole process in terms of the number of considered solutions by selection of most optimal (i.e. the most safe) components’ combination at the early stage of experiment design (before synthesis). It may help to reduce time and cost of developing and introducing new, efficient and environmentally friendly NPs-based heterogeneous/multicomponent (MCNMs) photocatalysts. In addition, we would like this application to set the direction in which chemoinformatics specialists should go when developing new QSAR models - creating easily accessible and easy-to-use web-based applications.
2. Results and discussion
2.1. A Comparison of developed nano-QSAR models in the context of user friendly a web-based application
Different types of nano-QSAR models have been developed to predict nanomaterials' toxicological effects on the human body and the environment. However, these models are developed based on complex machine-learning methods and descriptors that derive mainly from molecular modeling. According to analyzed data available in the literature, applying already existing nano-QSAR models requires at least fundamental knowledge in materials modeling, simulations, and chemoinformatics, which is one of the barriers to its broader use and acceptance, especially for regulatory purposes or experimentalists. A QSAR for nanomaterials is considered reliable and applicable if it fulfills the five principles for the validation of the OECD Guidance Document on the Validation of (Quantitative) Structure-Activity Relationship (QSAR) models (OECD Citation2007). However, from the user perspective, two additional aspects that define the applicability of the existing nano-QSAR models should be considered, that is, the advancement of the chemoinformatic methods and the advancement of the methods used for descriptors calculations.
Based on information found in the literature, we have carefully reviewed and classified all publications related to QSAR models relevant for different phases of toxicity prediction and risk assessment of nanomaterials. The developed nano-QSAR models that fulfill OECD recommendations, the description of used machine-learning based methods, and the type of descriptors have been summarized in . Analysis of information derived from a comprehensive literature search reveals the classification of the potential use of developed nano-QSAR models by final stakeholders without specialist knowledge in the field of chemoinformatics or materials modeling. These findings agree with the report provided by Lamon et al. In the paper, the authors proved that from around 800 QSAR models found in the initial search, only 59 models could be considered for predicting the toxicity effect of NMs and potential environmental risk assessment. Moreover, authors (Lamon et al. Citation2019) proved that most models are not described in a consistent manner, which is one of the barriers to their broader use and acceptance.
Table 1. Comparison of the developed nano-QSAR model in the context of potential use by stakeholders without specialistic knowledge in chemoinformatics or materials modeling.
Moreover, as shown in , all models are based on sophisticated machine-learning methods and complex descriptors mainly related to quantum mechanical calculations or experimental data. The literature search indicates that the second most relevant type of descriptors () used in nano-QSAR models’ development is related to the electronic structure of (i.e. band gap, enthalpy of formation, the position of valence or conduction band) and related properties of investigated NMs (). For example, in our previous study (Mikolajczyk et al. Citation2018), we introduced ‘additive descriptors, a linear combination of quantum mechanical descriptors for pure components weighed by their concentrations. This type of descriptor requires expertise in developing molecular structure models (i.e. atomic clusters, surface fragments) and physics-based materials modeling. A similar example of complex descriptors has been provided by Roy et al. (Roy, Ojha, and Roy Citation2019). This example confirms that in addition to specialistic knowledge in the field of chemoinformatic, there is a limitation for stakeholders without specialistic expertise in the context of calculations of descriptors of new or not synthesized yet (‘virtually created’) NMs.
Another example may provide models developed by Gajewicz et al., Citation2014a,Citationb). In the papers, authors developed nano-QSAR models based on empirical descriptors that describe primary and aggregated particles’ size, porosity, surface chemistry, charge, or crystal structure (Liu et al. Citation2015). The simplest descriptor used in the reviewed nano-QSAR models describes the primary size of NMs or that derived from transmission electron microscopy (TEM) images (Gajewicz et al. Citation2014b). Thus, to extend the application of these models’ knowledge from experiments with data from theoretical and computational models is required.
2.2. Case study
As summarized in developed nano-QSAR models found in the literature search describe toxicity effect toward different bacteria, cell lines, microorganisms for a total of 78 different NMs such as metals, metal oxides, carbon nanotubes and NP with coronas ().
As summarized in , developed nano-QSAR models found in the literature search describe toxicity effect toward different bacteria, cell lines, microorganisms for a total of 78 different NMs such as metals, metal oxides, carbon nanotubes and NP with coronas (). According to report provided by Lamon et al. (Lamon et al. Citation2019), most of developed QSAR models describe the biological activity of both metal and metal oxides NMs. While biological activity of NMs is defined by in vitro cytotoxicity experiments in different cell types, expressed by EC50, that is, the effective concentration that kills/inhibit 50% of the cells is the most common predicted endpoint. In this context we decided to develop the first web-based application for nano-QSAR models that was developed for the available dataset that describes cytotoxicity effect experimentally tested against commonly tested epithelial cells obtained from Chinese hamster ovary (CHO-K1 cell line, ATCC® CCL-61TM) of TiO2-based nanomaterials modified with Au, Ag, Pt and Pd nanoclusters (Rybińska-Fryca, Mikolajczyk, and Puzyn Citation2020). The final values of the cytotoxicity toward the Chinese hamster ovary (CHO-K1 cell line, ATCC® CCL-61TM) were expressed as the logarithm of 50% inhibition of the cell viability (pEC50) (Mikolajczyk et al., Citation2016; Rybińska-Fryca, Mikolajczyk, and Puzyn Citation2020). CHO cell line of fibroblast like characteristics derived from the Chinese hamster ovary (Puck, Cieciura, and Robinson Citation1958). During the 1960s and 1970s, the original CHO cell line was cultured at multiple research facilities, and variants started to arise (e.g. CHO-K1, CHO pro3-DHFR+, and others). CHO cells have a long history of application in toxicological research. Due to its convenient number of chromosomes, CHO cells have been broadly used in cytogenetic research. They are one of the cell lines recommended for testing for chromosomal aberrations (TG 473) (OECD, Citation2018). In vitro Mammalian Chromosomal Aberration Test), micronuclei formation (TG 487) (OECD Citation2018). In vitro Mammalian Cell Micronucleus Test), but also for gene mutations (TG 476) (OECD Citation2018). In vitro Mammalian Cell Gene Mutation Tests were using the Hprt and xprt genes). According to the OECD review on the dossiers of the WPMN Testing Program (ENV/JM/MONO(2018)4), the majority of MNMs were tested in the CHO cell line (including the CHO-K1 clone). As in all in vitro toxicity testing (not only mutagenicity), the main test should be preceded by a selection of appropriate concentrations of nanomaterials, our application could be very useful in proposing concentration ranges for preliminary in vitro cytotoxicity testing on CHO cells.
We decided to conduct case studies using sample data to demonstrate the potential uses and interpretations of our app's results. We considered three scenarios: (i) hybrid material belonging to the domain of application (ii) material outside the applicability domain, and (iii) predict toxicity for a large set of theoretical materials.
2.3. Memix-TiO2 inside or outside the applicability domain
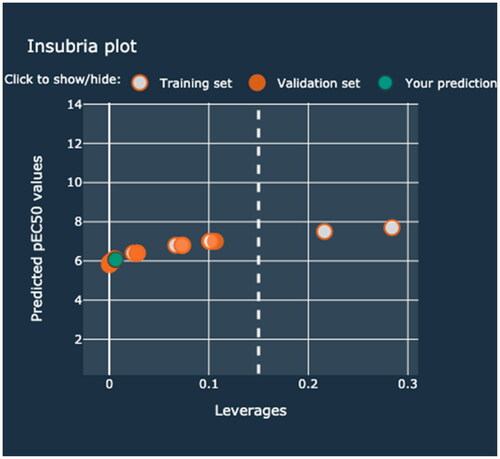
In the first case study, a hybrid nanocluster containing TiO2 NPs modified with Ag (0.2%mol) and Pd (0.5%mol) was investigated. The additive electronegativity calculated in the first step equals 1.486. Therefore, the predicted toxicity of the Memix-TiO2 material toward the CHO-K1 cell line expressed as pEC50 is approximately 6.1 (mol mL−1) (). The end-user is informed whether the predicted value is in the applicability domain. Moreover, this information can be verified by checking the Insubria plot. The predicted value should be placed in the area defined by the value of three standard deviations and the h* ().
Figure 1. Example of the prediction made for TiO2 NPs modified with Ag and Pd that is inside the applicability domain.
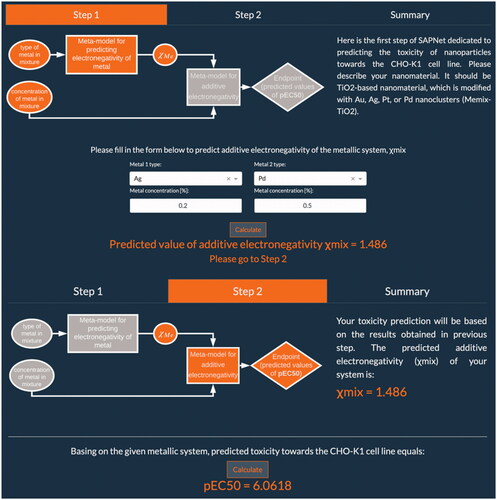
Figure 2. The Insubria plot generated for the first considered Memix-TiO2.
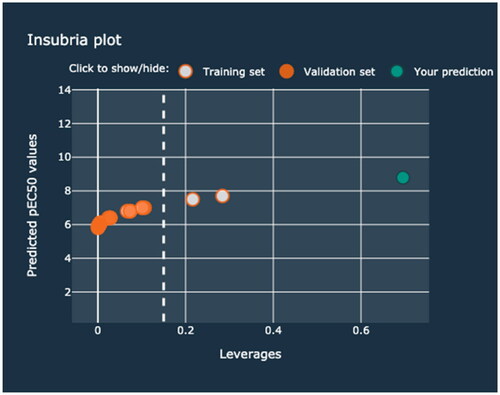
In the second scenario, TiO2 NPs modified with Au (1.2%mol) and Pt (5.5%mol) nanoclusters was examined. The additive electronegativity calculated in the first step equals 15.588. Therefore, the predicted toxicity of the Memix-TiO2 material toward the CHO-K1 cell line expressed as pEC50 is approximately 8.8 (mol mL−1). However, in this case, the end-user receives a warning information that given value is outside the applicability domain of the model (). By verifying the Insubria plot, the end-user can check the degree of similarity of the investigated hybrid material to the other Memix-TiO2 materials from the training and validation sets (). It should be highlighted that the results should be treated with caution when interpreting. The prediction was based on initial Memix-TiO2 parameters (type of metal, concentration) that were outside the range of the models’ training set values. Thus, the pEC50 value was obtained as the effect of extrapolation and may be biased.
Figure 3. Example of the prediction made for TiO2 NPs modified with Au and Pt that is outside the applicability domain.
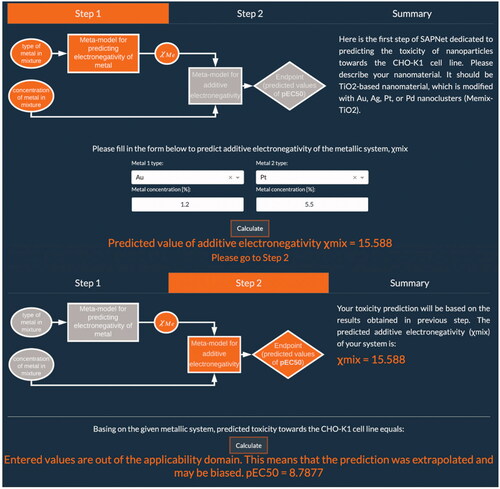
Figure 4. The Insubria plot generated for the second considered Memix-TiO2.
2.4. Predicting toxicity for large set of hybrid materials (Memix-TiO2)
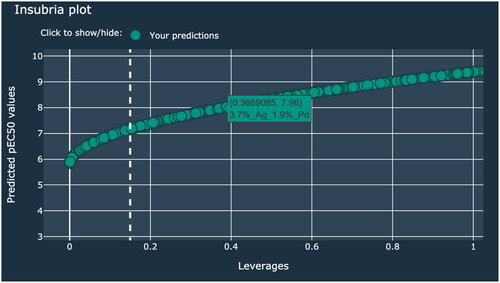
In the last case study within Dataset Generator tab, we performed cytotoxicity prediction of the large set of Memix-TiO2. Using the slider, we set the number of nanomaterials to be generated to 7500 (). After pressing just two buttons, we got the predicted values of pEC50. In all of the columns, it is possible to sort and filter the data. For example, we can filter the table using the first column so that it contains only nanomaterials modified with a specific metal (by typing name of the metal e.g. Pd) or using last column to filter out materials outside the applicability domain (by typing true). We can also sort values to see the highest and lowest values of additive electronegativity and predicted values of pEC50. Finally, we can export whole dataset with applied filtering and sorting to our local machines for further analysis (by clicking ‘Export’ button). Additionally, on Insubria plot we can identify specific Memix-TiO2 by hovering over the point (). Generated information can be used in the Safe(r) by Design framework i.e. to compare predicted cytotoxicity with the stock price of the noble metal precursor and/or photocatalytic activity of particular hybrid nanomaterial to evaluate its application potential.
Figure 5. Graphical user interface allowing user to select the amount of generated nanomaterials.
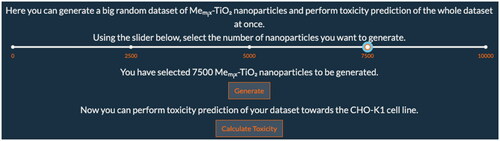
Figure 6. Example of the Memix-TiO2 NPs nanoparticles.
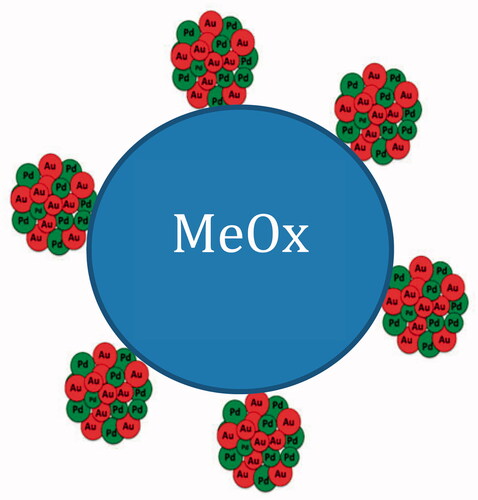
Figure 7. Insubria plot generated for the theoretical Memix-TiO2.
3. Conclusions
Case studies performed with covered web application – NanoMixHamster - allowed presenting the new tool and its capabilities. The developed application enables the prediction of nanoparticles’ toxicity toward the CHO-K1 cell line using the structure-activity prediction networks approach (Rybińska-Fryca, Mikolajczyk, and Puzyn Citation2020). The main functionalities are described by presenting three possible scenarios that may apply to a potential end user. The tested hybrid material can belong the applicability domain of the model or be outside of it. Additionally, NanoMixHamster tool can be used during the process of designing new materials by predicting its toxicity before synthesis. Therefore, materials with appropriate properties, i.e. photocatalytic activity that could potentially cause adverse effects, will be eliminated at the preliminary stage of research. In each case end-user will be guided by clear, user-friendly interface. The developed tool can be used even by users without prior knowledge of advanced chemoinformatic techniques. The NanoMixHamster application presented in this study is freely available at https://nanomixhamster.cloud.nanosolveit.eu/.
4. Technical details
In this study, we have developed and implemented an online application which allows the prediction of nanoparticles’ toxicity toward the CHO-K1 cell line using SAPNet approach (Mikolajczyk et al. Citation2018; Rybińska-Fryca, Mikolajczyk, and Puzyn Citation2020). The so-called ‘NanoMixHamster’ app was developed using Python 3.8 programming language and Dash by Plotly technology, thanks to which it was possible to place fully responsive, interactive charts in it. Website navigation allows users to quickly move between its content. It consists of three navigation tabs: Overview, Networks and Publication. The first tab contains general information about what SAPNets are and a graph presenting their structure. The Networks tab is where the user can predict the toxicity of his desired nanomaterial. The last navigation option includes a PDF file with the research paper presenting the SAPNets concept. The Networks menu option is further divided into 4 additional tabs each contained in a separate Dash tab: Step 1, Step 2, Summary and Dataset Generator. Step 1 is the place where the user needs to describe his nanomaterial. It should be a TiO2-based nanomaterial, which is modified with Au, Ag, Pt, or Pd nanoclusters (Memix-TiO2, ).
The user can fill in only 2 fields if his nanomaterial is modified with one metal: the metal type and its concentration in the final product (expressed as a percentage). In the case where nanomaterial is modified with two distinct metals, the user needs to fill in all 4 fields included in the form - types of metals and their respective concentrations. The entered values will allow for the estimation of additive electronegativity of the metallic system based on the following equation:
where %molMe is the concentration of a certain metal in the mixture and χMe is the electronegativity by Pauling scale of a particular metal. Once the parameters are filled in, one can perform the prediction by simply clicking the ‘Calculate’ button, after which user will receive predicted value of additive electronegativity and can move on to next step. This is the only section that will require any information from the user, which together with user-friendly interface makes the application extremely easy to use.
In Step 2, toxicity prediction is carried out based on the results obtained in previous step, as implemented Nano-QSAR model is utilizing only one descriptor, which represents additive electronegativity (χmix):
Once again by simply clicking the "Calculate" button, the user can perform prediction of toxicity toward the CHO-K1 cell line of a given metallic system. If values provided by the user are within the applicability domain of implemented model the app will return only predicted pEC50 value (pEC50 is defined as the negative logarithm of the EC50, which in turn is defined as half maximal effective concentration and refers to the concentration of a substance which is necessary to cause half of the maximum possible effect after a specified exposure time). Otherwise, user will be informed that entered values are out of the applicability domain, which means that the prediction was extrapolated and may be biased.
The Summary tab includes three graphs to help visualize the data used to create the model and its applicability domain: (i) observed vs. predicted values of pEC50; (ii) Applicability domain - William’s plot; (iii) Insubria plot (). The Insubria plot () additionally presents the values given by the user. William’s plot helps to visualize applicability domain of the model. It plots standardized residuals vs. leverage values which can be used for graphical detection of the response outliers (standardized residuals greater than 2.5–3 standard deviation units) and structurally influential chemicals in a model (leverage > h*) (Gramatica Citation2013). Insubria plot on the other hand is the plot of leverage values versus predicted values for chemicals without experimental data. It helps to visualize interpolated and extrapolated predictions (Gramatica et al., Citation2012). All plots were written using the Plotly library, making them more interactive. Among other things, the user can see the details of the given points by hovering over them, selecting subsets of points, zoom in and out on the graph, and easily exporting them with just one click of the mouse.
The Dataset Generator tab is where user can generate the whole new dataset of theoretical TiO2-based multi-component nanomaterials with metal clusters of silver, and their mixtures with gold, palladium, and platinum. With the use of slider one can specify the number (between 1 and 10000) of nanoparticles to be created. After clicking the ‘Generate’ button, the table containing information about concentration of a certain metals in the mixture and its additive electronegativity will appear. Once again by simply clicking the ‘Calculate Toxicity’ button, the user can perform prediction of toxicity toward the CHO-K1 cell line of the whole dataset at once. Two additional columns will appear in a table, one with predicted values of pEC50 and one with information if given nanoparticle is within applicability domain. Moreover, Insubria plot with all generated points will be plotted. The application is capable of generating 17 496 unique hybrid materials. Among them, one can find 8748 TiO2 NMs modified with silver and Au, Pd, Pt; 5832 TiO2 NMs modified with gold with Pd, Pt, and 2916 TiO2 NMs modified with palladium and platinum. While in the applicability domain of the model there are 2 995 hybrid materials. The pEC50 values for these materials are between 5.854 and 7.173 mol/mL.
Calculations and returned components
Once the initial parameters of the desired Memix-TiO2 are given, the application engine will calculate and return or plot the following information:
Additive electronegativity (χmix) of the metallic system;
Predicted toxicity toward the CHO-K1 cell line expressed as pEC50 value [mol/mL], which is logarithmically transformed half maximal effective concentration (EC50);
Three graphs to help visualize the data used to create the model and its applicability domain: (i) observed vs. predicted values of pEC50; (ii) William’s plot; (iii) Insubria plot;
The Insubria plot additionally shows the values given by the user.
Disclosure statement
The authors report no conflict of interest.
Additional information
Funding
References
- Afantitis, A., G. Melagraki, P. Isigonis, A. Tsoumanis, D. D. Varsou, E. Valsami-Jones, A. Papadiamantis, et al. 2020. “NanoSolveIT Project: Driving Nanoinformatics Research to Develop Innovative and Integrated Tools for in Silico Nanosafety Assessment.” Computational and Structural Biotechnology Journal 18: 583–602. doi:10.1016/j.csbj.2020.02.023.
- Bahadar, H., F. Maqbool, K. Niaz, and M. Abdollahi. 2016. “Toxicity of Nanoparticles and an Overview of Current Experimental Models.” Iranian Biomedical Journal 20 (1): 1–11. doi:10.7508/ibj.2016.01.001.
- Bigdeli, A., M. R. Hormozi-Nezhad, and H. Parastar. 2015. “Using nano-QSAR to Determine the Most Responsible Factor(s) in Gold Nanoparticle Exocytosis.” RSC Advances 5 (70): 57030–57037. doi:10.1039/C5RA06198A.
- Burello, E., and A. P. Worth. 2011. “A Theoretical Framework for Predicting the Oxidative Stress Potential of Oxide Nanoparticles.” Nanotoxicology 5 (2): 228–235. doi:10.3109/17435390.2010.502980.
- Chau, Y. T., and C. W. Yap. 2012. “Quantitative Nanostructure–Activity Relationship Modelling of Nanoparticles.” RSC Advances 2 (22): 8489. doi:10.1039/c2ra21489j.
- Cho, W.-S., R. Duffin, F. Thielbeer, M. Bradley, I. L. Megson, W. MacNee, C. A. Poland, C. L. Tran, and K. Donaldson. 2012. “Zeta Potential and Solubility to Toxic Ions as Mechanisms of Lung Inflammation Caused by Metal/Metal Oxide Nanoparticles.” Toxicological Sciences: An Official Journal of the Society of Toxicology 126 (2): 469–477. doi:10.1093/toxsci/kfs006.
- Chusuei, C. C., C.-H. Wu, S. Mallavarapu, F. Y. S. Hou, C.-M. Hsu, J. G. Winiarz, R. S. Aronstam, and Y.-W. Huang. 2013. “Cytotoxicity in the Age of Nano: The Role of Fourth Period Transition Metal Oxide Nanoparticle Physicochemical Properties.” Chemico-Biological Interactions 206 (2): 319–326. doi:10.1016/j.cbi.2013.09.020.
- Epa, V. C., F. R. Burden, C. Tassa, R. Weissleder, S. Shaw, and D. A. Winkler. 2012. “Modeling Biological Activities of Nanoparticles.” Nano Letters 12 (11): 5808–5812. doi:10.1021/nl303144k.
- Fourches, D., D. Pu, C. Tassa, R. Weissleder, S. Y. Shaw, R. J. Mumper, and A. Tropsha. 2010. “Quantitative Nanostructure-Activity Relationship Modeling.” ACS Nano 4 (10): 5703–5712. doi:10.1021/nn1013484.
- Gajewicz, A., M. T. D. Cronin, B. Rasulev, J. Leszczynski, and T. Puzyn. 2014a. “Novel Approach for Efficient Predictions Properties of Large Pool of Nanomaterials Based on Limited Set of Species: nano-Read-across.” Nanotechnology 26 (1): 015701. doi:10.1088/0957-4484/26/1/015701.
- Gajewicz, A., N. Schaeublin, B. Rasulev, S. Hussain, D. Leszczynska, T. Puzyn, and J. Leszczynski. 2014b. “Towards Understanding Mechanisms Governing Cytotoxicity of Metal Oxides Nanoparticles: Hints from nano-QSAR Studies.” Nanotoxicology 9 (3): 313–325. doi:10.3109/17435390.2014.930195.
- Ghorbanzadeh, M., M. H. Fatemi, and M. Karimpour. 2012. “Modeling the Cellular Uptake of Magnetofluorescent Nanoparticles in Pancreatic Cancer Cells: A Quantitative Structure Activity Relationship Study.” Industrial & Engineering Chemistry Research 51 (32): 10712–10718. doi:10.1021/ie3006947.
- Gramatica, P. 2013. Computational Toxicology: Volume II, Methods in Molecular Biology, vol. 930 (Ed: B. Reisfeld, A. N. Mayeno), Springer Science + Business Media.: 499-526.
- Gramatica, P., S. Cassani, P. P. Roy, S. Kovarich, C. W. Yap, and E. Papa. 2012. “QSAR Modeling is Not “Push a Button and Find a Correlation”: a Case Study of Toxicity of (Benzo-)triazoles on Algae.” Molecular Informatics 31 (11-12): 817–835. doi:10.1002/minf.201200075.
- Kar, S., A. Gajewicz, T. Puzyn, and K. Roy. 2014a. “ Nano-quantitative structure-activity relationship modeling using easily computable and interpretable descriptors for uptake of magnetofluorescent engineered nanoparticles in pancreatic cancer cells.” Toxicology in Vitro : An International Journal Published in Association with BIBRA 28 (4): 600–606. doi:10.1016/j.tiv.2013.12.018.
- Kar, S., A. Gajewicz, T. Puzyn, K. Roy, and J. Leszczynski. 2014b. “Periodic Table-Based Descriptors to Encode Cytotoxicity Profile of Metal Oxide Nanoparticles: A Mechanistic QSTR Approach.” Ecotoxicology and Environmental Safety 107: 162–169. doi:10.1016/j.ecoenv.2014.05.026.
- Karatzas, P., G. Melagraki, L. A. Ellis, I. Lynch, D. Varsou, A. Afantitis, A. Tsoumanis, P. Doganis, and H. Sarimveis. 2020. “Development of Deep Learning Models for Predicting the Effects of Exposure to Engineered Nanomaterials on Daphnia Magna.” Small 16 (36): 2001080. doi:10.1002/smll.202001080.
- Kaweeteerawat, C., A. Ivask, R. Liu, H. Zhang, C. H. Chang, C. Low-Kam, H. Fischer, et al. 2015. “Toxicity of Metal Oxide Nanoparticles in Escherichia coli Correlates with Conduction Band and Hydration Energies.” Environmental Science & Technology 49 (2): 1105–1112. doi:10.1021/es504259s.
- Lai, D. Y. 2015. “Approach to Using Mechanism-Based Structure Activity Relationship (SAR) Analysis to Assess Human Health Hazard Potential of Nanomaterials.” Food and Chemical Toxicology : An International Journal Published for the British Industrial Biological Research Association 85: 120–126. doi:10.1016/j.fct.2015.06.008.
- Lamon, L., D. Asturiol, A. Vilchez, R. Ruperez-Illescas, J. Cabellos, A. Richarz, and A. Worth. 2019. “Computational Models for the Assessment of Manufactured Nanomaterials: Development of Model Reporting Standards and Mapping of the Model Landscape.” Computational Toxicology (Amsterdam, Netherlands) 9: 143–151. doi:10.1016/j.comtox.2018.12.002.
- Liu, R., B. France, S. George, R. Rallo, H. Zhang, T. Xia, A. E. Nel, K. Bradley, and Y. Cohen. 2014. “Association Rule Mining of Cellular Responses Induced by Metal and Metal Oxide Nanoparticles.” The Analyst 139 (5): 943–953. doi:10.1039/c3an01409f.
- Liu, R., H. H. Liu, Z. Ji, C. H. Chang, T. Xia, A. E. Nel, and Y. Cohen. 2015. “Evaluation of Toxicity Ranking for Metal Oxide Nanoparticles via an in Vitro Dosimetry Model.” ACS Nano 9 (9): 9303–9313. doi:10.1021/acsnano.5b04420.
- Liu, R., R. Rallo, S. George, Z. Ji, S. Nair, A. E. Nel, and Y. Cohen. 2011. “Classification NanoSAR Development for Cytotoxicity of Metal Oxide Nanoparticles.” Small (Weinheim an Der Bergstrasse, Germany) 7 (8): 1118–1126. doi:10.1002/smll.201002366.
- Liu, R., R. Rallo, R. Weissleder, C. Tassa, S. Shaw, and Y. Cohen. 2013a. “Nano-SAR Development for Bioactivity of Nanoparticles with Considerations of Decision Boundaries.” Small (Weinheim an Der Bergstrasse, Germany) 9 (9-10): 1842–1852. doi:10.1002/smll.201201903.
- Liu, R., H. Y. Zhang, Z. X. Ji, R. Rallo, T. Xia, C. H. Chang, A. Nel, and Y. Cohen. 2013b. “Development of Structure-Activity Relationship for Metal Oxide Nanoparticles.” Nanoscale 5 (12): 5644–5653. doi:10.1039/c3nr01533e.
- Melagraki, G., and A. Afantitis. 2014. “Enalos InSilicoNano Platform: An Online Decision Support Tool for the Design and Virtual Screening of Nanoparticles.” RSC Advances. 4 (92): 50713–50725. doi:10.1039/C4RA07756C.
- Mikolajczyk, A., A. Gajewicz, E. Mulkiewicz, B. Rasulev, M. Marchelek, M. Diak, S. Hirano, A. Zaleska-Medynska, and T. Puzyn. 2018. “Nano-QSAR Modeling for Ecosafe Design of Heterogeneous TiO 2 -Based Nano-Photocatalysts.” Environmental Science: Nano 5 (5): 1150–1160. doi:10.1039/C8EN00085A.
- Mikolajczyk, A., A. Gajewicz, B. Rasulev, N. Schaeublin, E. Maurer-Gardner, S. Hussain, J. Leszczynski, and T. Puzyn. 2015. “Zeta Potential for Metal Oxide Nanoparticles: A Predictive Model Developed by a Nano-Quantitative Structure–Property Relationship Approach.” Chemistry of Materials 27 (7): 2400–2407. doi:10.1021/cm504406a.
- Mikolajczyk, A., A. Malankowska, G. Nowaczyk, A. Gajewicz, S. Hirano, S. Jurga, A. Zaleska-Medynska, and T. Puzyn. 2016. “Combined Experimental and Computational Approach to Developing Efficient Photocatalysts Based on Au/Pd–TiO 2 Nanoparticles.” Environmental Science: Nano 3 (6): 1425–1435. doi:10.1039/C6EN00232C.
- Mikolajczyk, A., N. Sizochenko, E. Mulkiewicz, A. Malankowska, M. Nischk, P. Jurczak, S. Hirano, et al. 2017. “Evaluating the Toxicity of TiO2-Based Nanoparticles to Chinese Hamster Ovary Cells and Escherichia coli: A Complementary Experimental and Computational Approach.” Beilstein Journal of Nanotechnology 8 (1): 2171–2180. doi:10.3762/bjnano.8.216.
- Mikolajczyk, A., N. Sizochenko, E. Mulkiewicz, A. Malankowska, B. Rasulev, and T. Puzyn. 2019. “A Chemoinformatics Approach for the Characterization of Hybrid Nanomaterials: safer and Efficient Design Perspective.” Nanoscale 11 (24): 11808–11818. doi:10.1039/c9nr01162e.
- OECD. 2007. “Guidance Document on the Validation of (Quantitative) Structure-Activity Relationship [(Q)SAR] Models.” OECD Series on Testing and Assessment doi:10.1787/9789264085442-en.
- OECD 2018. 2018 environment directorate. joint meeting of the chemicals committee and the working party on chemicals, pesticides and biotechnology. Evaluation of in vitro methods for human hazard assessment applied in the OECD Testing Programme for the Safety of Manufactured Nanomaterials. Series on the Safety of Manufactured Nanomaterials No. 85.
- Patel, T., D. Telesca, R. Rallo, S. George, T. Xia, and A. E. Nel. 2013. “Hierarchical Rank Aggregation with Applications to Nanotoxicology.” Journal of Agricultural, Biological, and Environmental Statistics 18 (2): 159–177. doi:10.1007/s13253-013-0129-y.
- Pathakoti, K., M.-J. Huang, J. D. Watts, X. He, and H.-M. Hwang. 2014. “Using Experimental Data of Escherichia coli to Develop a QSAR Model for Predicting the Photo-Induced Cytotoxicity of Metal Oxide Nanoparticles.” Journal of Photochemistry and Photobiology. B, Biology 130: 234–240. doi:10.1016/j.jphotobiol.2013.11.023.
- Puck, T. T., S. J. Cieciura, and A. Robinson. 1958. “Genetics of Somatic Mammalian cells. III. Long-term Cultivation of Euploid Cells from Human and Animal Subjects.” The Journal of Experimental Medicine 108 (6): 945–956. doi:10.1084/jem.108.6.945.
- Puzyn, T., B. Rasulev, A. Gajewicz, X. Hu, T. P. Dasari, A. Michalkova, H.-M. Hwang, A. Toropov, D. Leszczynska, and J. Leszczynski. 2011. “Using nano-QSAR to Predict the Cytotoxicity of Metal Oxide Nanoparticles.” Nature Nanotechnology 6 (3): 175–178. doi:10.1038/nnano.2011.10.
- Rallo, R., B. France, R. Liu, S. Nair, S. George, R. Damoiseaux, F. Giralt, A. Nel, K. Bradley, and Y. Cohen. 2011. “Self-Organizing Map Analysis of Toxicity-Related Cell Signaling Pathways for Metal and Metal Oxide Nanoparticles.” Environmental Science & Technology 45 (4): 1695–1702. doi:10.1021/es103606x.
- Roy, J., P. K. Ojha, and K. Roy. 2019. “Risk Assessment of Heterogeneous TiO2-Based Engineered Nanoparticles (NPs): a QSTR Approach Using Simple Periodic Table Based Descriptors.” Nanotoxicology 13 (5): 701–716. doi:10.1080/17435390.2019.1593543.
- Rybińska-Fryca, A., A. Mikolajczyk, and T. Puzyn. 2020. “ Structure-activity Prediction Networks (SAPNets): A Step Beyond Nano-QSAR for Effective Implementation of the Safe-by-design Concept.” Nanoscale 12 (40): 20669–20676. doi:10.1039/d0nr05220e.
- Shaw, S. Y., E. C. Westly, M. J. Pittet, A. Subramanian, S. L. Schreiber, and R. Weissleder. 2008. “Perturbational Profiling of Nanomaterial Biologic Activity.” Proceedings of the National Academy of Sciences of the United States of America 105 (21): 7387–7392. doi:10.1073/pnas.0802878105.
- Singh, K. P., and S. Gupta. 2014. “Nano-QSAR Modeling for Predicting Biological Activity of Diverse Nanomaterials.” RSC Advances. 4 (26): 13215–13230. doi:10.1039/C4RA01274G.
- Sizochenko, N., K. Jagiello, J. Leszczynski, and T. Puzyn. 2015a. “How the “Liquid Drop” Approach Could Be Efficiently Applied for Quantitative Structure–Property Relationship Modeling of Nanofluids.” The Journal of Physical Chemistry C 119 (45): 25542–25547. doi:10.1021/acs.jpcc.5b05759.
- Sizochenko, N., A. Mikolajczyk, M. Syzochenko, T. Puzyn, and J. Leszczynski. 2021. “Zeta Potentials (ζ) of Metal Oxide Nanoparticles: A Meta-Analysis of Experimental Data and a Predictive Neural Networks Modeling.” NanoImpact 22: 100317. doi:10.1016/j.impact.2021.100317.
- Sizochenko, Natalia., Bakhtiyor. Rasulev, Agnieszka. Gajewicz, Victor. Kuz'min, Tomasz. Puzyn, and Jerzy. Leszczynski. 2014. “From Basic Physics to Mechanisms of Toxicity: The “ "liquid drop" approach applied to develop predictive classification models for toxicity of metal oxide nanoparticles”.” Nanoscale 6 (22): 13986–13993. doi:10.1039/c4nr03487b.
- Sizochenko, Natalia., Bakhtiyor. Rasulev, Agnieszka. Gajewicz, Elena. Mokshyna, Victor E. Kuz'min, Jerzy. Leszczynski, and Tomasz. Puzyn. 2015b. “Causal Inference Methods to Assist in Mechanistic Interpretation of Classification nano-SAR Models.” RSC Advances 5 (95): 77739–77745. doi:10.1039/C5RA11399G.
- Toropov, A. A., A. P. Toropova, E. Benfenati, G. Gini, T. Puzyn, D. Leszczynska, and J. Leszczynski. 2012. “Novel Application of the CORAL Software to Model Cytotoxicity of Metal Oxide Nanoparticles to Bacteria Escherichia coli.” Chemosphere 89 (9): 1098–1102. doi:10.1016/j.chemosphere.2012.05.077.
- Toropov, A. A., A. P. Toropova, T. Puzyn, E. Benfenati, G. Gini, D. Leszczynska, and J. Leszczynski. 2013. “QSAR as a Random Event: Modeling of Nanoparticles Uptake in PaCa2 Cancer Cells.” Chemosphere 92 (1): 31–37. doi:10.1016/j.chemosphere.2013.03.012.
- Toropova, A. P., A. A. Toropov, E. Benfenati, and R. Korenstein. 2014. “QSAR Model for Cytotoxicity of SiO2 Nanoparticles on Human Lung Fibroblasts.” Journal of Nanoparticle Research 16 (2): 2282. doi:10.1007/s11051-014-2282-9.
- Toropova, A. P., A. A. Toropov, R. Rallo, D. Leszczynska, and J. Leszczynski. 2015. “Optimal Descriptor as a Translator of Eclectic Data into Prediction of Cytotoxicity for Metal Oxide Nanoparticles under Different Conditions.” Ecotoxicology and Environmental Safety 112: 39–45. doi:10.1016/j.ecoenv.2014.10.003.
- Varsou, D., A. Afantitis, A. Tsoumanis, A. Papadiamantis, E. Valsami‐Jones, I. Lynch, and G. Melagraki. 2020. “ Zeta-Potential Read-Across Model Utilizing Nanodescriptors Extracted via the NanoXtract Image Analysis Tool Available on the Enalos Nanoinformatics Cloud Platform.” Small (Weinheim an Der Bergstrasse, Germany) 16 (21): e1906588. doi:10.1002/smll.201906588.
- Varsou, D.-D., and H. Sarimveis. 2021. “Apellis: An Online Tool for Read-across Model Development.” Computational Toxicology 17: 100146. doi:10.1016/j.comtox.2020.100146.
- Winkler, D. A., F. R. Burden, B. Yan, R. Weissleder, C. Tassa, S. Shaw, and V. C. Epa. 2014. “Modelling and Predicting the Biological Effects of Nanomaterials.” SAR and QSAR in Environmental Research 25 (2): 161–172. doi:10.1080/1062936X.2013.874367.
- Zhang, H., Z. Ji, T. Xia, H. Meng, C. Low-Kam, R. Liu, S. Pokhrel, et al. 2012. “Use of Metal Oxide Nanoparticle Band Gap to Develop a Predictive Paradigm for Oxidative Stress and Acute Pulmonary Inflammation.” ACS Nano 6 (5): 4349–4368. doi:10.1021/nn3010087.