
 ?Mathematical formulae have been encoded as MathML and are displayed in this HTML version using MathJax in order to improve their display. Uncheck the box to turn MathJax off. This feature requires Javascript. Click on a formula to zoom.
Abstract
Nanotechnology applications in biomedicine have increased in recent decades, primarily as therapeutic agents, drugs, and gene delivery systems. Among the nanoparticles used in medicine, we highlight cationic solid lipid nanoparticles (SLN). Given their nontoxic properties, much research has focused on the beneficial effects of SLN for drug or gene delivery system. However, little attention has been paid to the adverse impacts of SLN on the cellular environment, particularly their influence on intracellular signaling pathways. In this work, we investigate the effects triggered by cationic SLN on human prostate non-tumor cells (PNT1A) and tumor cells (PC-3). Our results demonstrate that cationic SLN enhances the migration of PC-3 prostate cancer cells but not PNT1A non-tumor prostate cells, an unexpected and unprecedented development. Furthermore, we observed that the enhanced cell migration velocity is a concentration-dependent and nanoparticle-dependent effect, and not related to any individual nanoparticle component. Moreover, cationic SLN increased vimentin expression (p < 0.05) but SLN did not affect Smad2 nuclear translocation. Meanwhile, EMT-related (epithelial-to-mesenchymal transition) proteins, such as ZEB1, underwent nuclear translocation when treated with cationic SLN, thereby affecting PC-3 cell motility through ZEB1 and vimentin modulation. From a therapeutic perspective, cationic SLN could potentially worsen a patient’s condition if these results were reproduced in vivo. Understanding the in vitro molecular mechanisms triggered by nanomaterials and their implications for cell function is crucial for defining their safe and effective use.
Introduction
The use of nanoparticles for gene delivery is now a reality. Over the past three decades, the development of nonviral gene delivery systems has struggled to make its way from the lab bench to the bedside. Nonetheless, in the past five years, we have seen unprecedented advances in this field, resulting in many gene therapies reaching the clinic and market (Shahryari et al. Citation2021). To illustrate, the Pfizer/BioNTECH and Moderna vaccines for COVID-19, both of which deliver miRNA using PEG-based lipid nanoparticles and lipid-based siRNA carriers such as patisiran (Milane and Amiji Citation2021), are the first human lipid nanoparticle-based siRNA drugs, approved by the U.S. FDA in 2018 (Oner et al. Citation2021; Rüger et al. Citation2020). Among the lipid-based nanoparticles, solid lipid nanoparticles (SLN) have been used as a drug and gene delivery system (Akanda et al. Citation2015; Badawi et al. Citation2018; de Jesus et al. Citation2010). In-depth knowledge of the development, characterization, and application of SLN formulations for gene delivery ensures their application to many cell lines, including breast cancer cells (Bhagwat et al. Citation2020), colorectal cancer (Smith et al. Citation2020), and prostate cells (de Jesus and Zuhorn Citation2015; Radaic, de Paula, and de Jesus Citation2015; Radaic and de Jesus Citation2018). Furthermore, they are considered safe to use due to their composition and low toxicity (Bhatt et al. Citation2018; Scheideler, Vidakovic, and Prassl Citation2020).
SLN are aqueous colloidal dispersions formed from solid lipids at room temperature, surfactants that prevent aggregation, as well as water and fat-soluble active ingredients incorporated therein. Adding cationic lipids such as DOTAP (1,2 Dioleoyl-3-propionate trimethylammonium) facilitates electrostatic interactions with genetic material (i.e. polyanionic macromolecules) used for gene delivery systems (de Jesus and Zuhorn Citation2015). Albeit considered nontoxic, there is evidence suggesting that cationic lipids may disturb cell homeostasis. These lipids activate signaling cascades in cells by directly interacting with components of the plasma membrane, and positive charges can contribute to the invagination of the plasma membrane, which aids in the endocytosis of these materials (Lonez, Vandenbranden, and Ruysschaert Citation2012). Moreover, Lipofectamine and DOTAP liposomes induce the release of calcium from intracellular stores (Lonez et al. Citation2009). DOTAP can also induce interleukin 12 (IL-12) secretion by dendritic cells and stimulate the formation of reactive oxygen species (Lonez, Vandenbranden, and Ruysschaert Citation2012). Therefore, it is important to comprehend the impact of cationic nanoparticles, including cationic SLN, on cellular signaling pathways to predict and regulate the use of these nanoparticles.
Lipid nanoparticles, such as SLN, are considered biodegradable and biocompatible, consisting of fatty acids and surfactants, resulting in non-harmful formulations (Silva et al. Citation2014). The subtle toxicity of SLN is usually overlooked, but these effects are present and depend on nanoparticle concentration, time, and interaction with different cell types (Moraes-Lacerda and de Jesus Citation2022). For example, cationic SLN can cross the blood-brain barrier without compromising its integrity but inducing low-intensity inflammation in rats (Mendonça et al. Citation2019). In cells, SLN interfere with signaling pathways, e.g. cationic SLN can downregulate androgen receptor signaling in LNCaP prostate cells (Debelec-Butuner et al. Citation2019), target the inflammatory pathway in lung cells (Payne et al. Citation2019), and downregulate proteins related with the TGF-β pathway in astrocytes (Ma et al. Citation2018). Hence, there are still concerns about possible adverse effects triggered by the interaction of cationic SLN with biological systems since its safe composition does not ensure the complete abscence of side effects. Therefore, molecular details of these subtle effects induced by cationic SLN in signaling pathways remain unexplored.
Here, we unveil the underlying molecular mechanisms associated with cationic SLN interaction with prostate cancer and non-cancer cell lines. This study aimed to evaluate the biological effects of cationic SLN, i.e. proliferation and migration, on prostate cancer PC-3 and non-cancer epithelial PNT1A cells. Additionally, we aimed to investigate which proteins would be altered by cationic SLN treatment. Our results represent seminal work as they were the first to show that cationic SLN promotes prostate cancer cell migration by modulating the expression of the proteins vimentin and ZEB1.
Materials and methods
Cell culture
Non-cancer prostate epithelial cells (PNT1A, ECACC 95012614) and prostate cancer cells (PC-3, ATCC® CRL-1435™) were cultured in 25 cm2 culture flasks containing 5 mL of RPMI 1640 culture medium (Invitrogen, Grand Island, New York), supplemented with 10% inactivated fetal bovine serum (Gibco, Brazil) and 1% penicillin/streptomycin (Gibco, Canada), referred to herein as supplemented RPMI medium. Cells were kept at 37 °C with an atmosphere of 5% CO2 in a Panasonic incubator (model MCO-170AICUVL-PA). Cells were split for maintenance when confluency reached approximately 80% in culture flasks. Cultures were determined to be free of mycoplasma every 2–3 months using the direct DNA staining method with Hoechst 33342 solution (Sigma-Aldrich, 1:1000).
Production and characterization of cationic solid lipid nanoparticles (SLN)
Production: Cationic SLN were produced using a micro extrusion technique (de Jesus et al. Citation2013). This technique consists of preparing a cationic microemulsion in deionized water containing stearic acid (Sigma-Aldrich), DOTAP (1,2 Dioleoyl-3-propionate trimethylammonium, Avanti Polar Lipids Inc., Alabaster, USA), and Pluronic F68 (Sigma-Aldrich, Germany), resulting in a final lipid concentration (DOTAP and stearic acid) of 3.8 g/mL. The stearic acid was first heated above its melting temperature (69 °C) to a temperature of 75 °C and then dispersed into a hot aqueous solution of Pluronic F68 and DOTAP, in agitation. Then, particle size was standardized using a mini-extruder (Avanti Polar Lipids Inc., Alabaster, USA) by successive passage (30 times) through a polycarbonate membrane with a pore size of 100 nm (IsoporeTM, Millipore). After 30 passages, the solution was transferred to an ice bath to solidify the SLN and prevent particle aggregation and then stored at 4 °C for future use (de Jesus and Zuhorn Citation2015; Radaic, de Paula, and de Jesus Citation2015).
Stearic acid, Pluronic F68, and DOTAP were individually diluted in aqueous solutions to discern whether any specific component was responsible for inducing cell migration. These components were subsequently employed as controls in the cell migration assay experiment ().
Table 1. Composition of each formulation tested.
Physicochemical characterization: Two weeks after production, the samples were diluted in deionized water (1:30) and subjected to physicochemical measurements for average diameter, polydispersity (PDI), and Zeta potential using the Zetasizer Nanoseries instrument (Malvern Instruments, UK). Dynamic Light Scattering measurements were conducted in accordance with the manufacturer’s software using a scattering angle of 173 degrees at 25 °C, with 3 replications conducted for each measurement.
Previous results show that size, zeta potential, and PDI values for cationic SLN are stable over 180 days of storage (de Jesus et al. Citation2013) and that even after 2 years cationic SLN have a high transfection efficiency after lyophilization and long-term storage (de Jesus et al. Citation2014). Characterization of SLN used in this study show a size of around 113.03 ± 40.65 nm, PDI of 0.08, and a positive charge, indicated by the zeta potential (34.36 ± 19.43 mV).
SLN are internalized in a time-dependent manner, and after 4 hours of nanoparticle exposure there is a saturation phase with a maximum internalization rate (close to 90% of the cell population) (Radaic and de Jesus Citation2018), therefore, cells were incubated with nanoparticles for a period of 4 hours.
Preparation of SLNplexes
SLNplexes composed of cationic SLN and plasmids (pEGFP-N1 for the transfection assay or pET28A for the biological assays) were prepared by separately diluting cationic SLN (4 L) in 50
L of serum- and antibiotic-free medium and pDNA (1
g of plasmid) in another 50
L of serum- and antibiotic-free medium. Next, the pDNA solution was added to the suspension of cationic SLN. This mixture was incubated for 20 min at room temperature. SLNplexes were used to treat the cells immediately after preparation. Hereafter, we will use the term "SLNplexes" to denote cationic SLN complexed with either pEGFP-N1 for the transfection assay or pET28A for the biological assays.
Transfection protocol
PNT1A and PC-3 cells were plated at a density of 1 × 10⁵ cells/well in a 12-well plate. After 24 h, cells were transfected with prepared SLNplexes, incubated for 4 h, and medium was replaced with a supplemented RPMI medium. After 24 h, 6 sites per well were imaged using a 10× objective using Cytation 5 Cell Imaging Multi-Mode Reader (BioTek Instruments, Inc., Winooski, VT, USA) equipped with two cubes GFP (λEx/Em = 469/525), and DAPI (λEx/Em = 377/447). The wells were then washed with PBS (Phosphate-Buffered Saline), and 300 L of 0.1% trypsin was added. The percentage of EGFP (Enhanced Green Fluorescent Protein)-positive cells was determined by flow cytometry (FACS/Calibur Flow Cytometer, Becton Dickinson, Mansfield, MA, USA). Data were analyzed in FlowJo software (BD, USA). Cells were selected as viable using size and granularity parameters, ignoring cell debris. We set EGFP-positive cells within the viable cell gate based on the control (no EGFP-positive cells). The percentage of transfection was reported by "Frequency of Parent", defined as the percentage of events at that gate. For fluorescence intensity, the total number of cells and the average EGFP fluorescence per cell were multiplied, generating the fluorescence intensity value of EGFP in the cell population.
Migration assay (scratch assay)
The optimal confluence for the cell migration assay was determined according to previous studies (Garcia-Fossa, Gaal, and de Jesus Citation2020). PNT1A and PC-3 cells were seeded at a density of 5 × 10⁴ cells/mL in a 24-well plate. Cells were left serum starving (1% FBS, 24 h) to decrease cell proliferation. To evaluate cell migration in the presence of cationic SLN and investigate potential signaling pathway similarities to TGF-β pathway, cells were transfected with SLN:pET28A (4 L) or treated with TGF-
(10 ng/mL) and incubated for 4 hours (Barrett, Millena, and Khan Citation2017). To assess cell migration in the presence of the isolated SLN components, cells were treated for 4 h with either TGF-
(10 ng/mL), SLN:pET28A (4
L), Stearic acid in aqueous solution (4
L), Pluronic F68 in aqueous solution (4
L), or DOTAP in aqueous solution (4
L). Finally, to evaluate SLN dose-response in cell migration, SLN:pET28A was complexed at a concentration of 3.8
g/mL (1×), 0.76
g/mL (0.2×), 0.38
g/mL (0.1×) and 0.076
g/mL (0.02×). For all concentrations, cells were treated with formulations for 4 h. Scratch was made after 4 h using a p200 pipette, then cells were washed with PBS, and RPMI media was added. Migration was monitored by phase-contrast imaging, 4× objective using Cytation 5 Hybrid Multidetection Reader (BioTek Instruments, Inc., Winooski, VT, USA), and images were acquired every 15 minutes. The scratch area was measured using the PyScratch software (Garcia-Fossa, Gaal, and de Jesus Citation2020). Migration velocity was calculated by the slope of the curve/2× image length in pixels. The slope of the curve was estimated by the area of the scratch measured in pixels (y-axis) versus time in minutes (x-axis) using Linear Regression. Cell migration velocity in pixels/min was converted to
m/min using the objective conversion value (1.6
m/pixel). The analysis scripts were developed using Python 3.8 and are openly available at https://github.com/fefossa/scratchassays.git.
Proliferation assay
PNT1A and PC-3 cells were plated at cell density 5 × 10⁴ cells/well on 13 mm coverslips pretreated with poly-L-lysine (Sigma-Aldrich) and, after adhesion, cells were kept in serum starvation for 24 h, incubated in a Panasonic incubator at 37 °C and 5% CO2. After 24 h, cells were treated with the SLN (4 L, 3.8 g/mL) and pET28A (1
g). After 4 h, the transfection medium was removed, and cells were washed once with PBS. Finally, FBS-free RPMI 1640 culture medium was added containing EdU (5-Ethinyl-2′deoxyuridine) at 10
M. After 5, 24, and 48 h of incubation, the cells were fixed with 4% PFA. Cells were stained using the Click-iT Plus EdU Alexa Fluor 647 ThermoFisher kit according to the manufacturer’s instructions. Images of DNA (DAPI filter,
Ex/Em = 377/447) and EdU (CY5 filter,
Ex/Em = 628/685) were acquired with the Cytation 5 hybrid multidetection reader (BioTek Instruments, Inc., Winooski, VT, USA) using a 10× objective, and 18 sites were acquired per treatment. We developed a pipeline using CellProfiler 3.8 (Carpenter et al. Citation2006) to identify primary objects, both the total number of cells (nuclei-stained with Hoechst) and proliferation-positive nuclei (positive for EdU). The proliferation rate was calculated as the ratio between the proliferation of positive nuclei for EdU and all cells stained with Hoechst (EdU/Hoechst * 100). Graphics were plotted using Python 3.8 (Python Language Reference, version 3.8. Available at http://www.python.org) with the Seaborn data visualization library (Available at https://seaborn.pydata.org).
Evaluation of Smad2 and EMT pathway proteins
PNT1A and PC-3 cells were plated on 13 mm coverslips pretreated with Poly-L-lysine (Sigma-Aldrich) at a density of 5 × 10⁴ cells/well in 24-well plates. After 24 h, cells were incubated with 50 L of SLNplex (SLN:pET28A). Additional cells were treated with TGF-
(10 ng/mL) in RPMI medium without FBS, and non-treated cells were kept only in RPMI medium without FBS (negative control). After treatments, cells were washed with PBS and fixed with 4% paraformaldehyde for 20 min at 37 °C. Next, cells were permeabilized with 0.1% Triton X-100 for 5 min at room temperature, washed with PBS, and blocked with 10% FBS in PBS (blocking buffer) for 10 min at room temperature. For protein staining (Smad2, SNAIL, ZEB1, and Vimentin), coverslips were covered with a 30 μL drop containing a dilution of the antibody in blocking buffer for 60 min at 37 °C in a humid chamber. After incubation, coverslips were washed thrice in blocking buffer and incubated with the secondary antibody, as described below, and nuclei were counterstained with 1 μg/mL of Hoechst 33342 (Sigma-Aldrich, Germany). After 30 min incubation in a humid chamber, the coverslips were washed thrice with PBS and mounted onto slides with Faramount aqueous mounting medium (DAKO, Glostrup, Denmark).
Protein staining followed different regimes according to the biological approach. Smad2: after 45 min, 1 h, 2 h, and 4 h of treatment with SLN, cells were fixed and then stained with Smad2 antibody (Smad2 D43B4 XP Rabbit mAb, Cell Signaling Technology, USA, Dilution 1: 200). SNAIL and ZEB1: after 4 h of SLN transfection, the treatment medium was replaced with RPMI medium without FBS, and the cells were kept in the incubator for 4 h, 7 h, or 24 h. Next, cells were stained for SNAIL (Snail C15D3 Rabbit mAb, 1:200 dilution, Cell Signaling Technology, USA) and ZEB1 proteins (TCF8/ZEB1 D80D3 Rabbit mAb, 1:300 dilution, Cell Signaling Technology, USA), followed by Secondary Antibody Alexa Fluor 488 stain and Hoechst 33342. Vimentin: After 24 h in serum starvation to mimic the scratch assay conditions, cells were transfected for 4 h with SLN:pET28A and treated with TGF- (10 ng/mL). After 4 h, the well was scratched using a p200 tip, the cells were washed with PBS, and the medium was replaced with RPMI. After 12 h of migration, cells were fixed and stained for vimentin protein (Vimentin V6389 mouse mAb, Sigma-Aldrich, 1:100 dilution).
After the various treatments and staining protocols, cells were imaged using the Cytation 5 Hybrid Multidetection Reader (BioTek Instruments, Inc., Winooski, VT, USA) with Olympus 40/0.3 phase objective Plan Fluorite, using a digital camera with associated software Gen 5.03. We acquired the images of Hoechst using a DAPI filter cube (
= 358/461), and to acquire Alexa Fluor 488, we used a GFP filter cube (
= 469/525). After the acquisition, objects were segmented, features extracted, and data analyzed with a pipeline we developed using CellProfiler 3.8.1 (Carpenter et al. Citation2006), described in more detail below.
Image analysis
The image analysis was performed in four steps: image pre-processing, object segmentation, feature extraction, and data analysis. First, image pre-processing was performed on the raw images to allow an accurate analysis. Then, all images were submitted to quality control, a routine developed in CellProfiler 3.8.1 (Bray and Carpenter, Citation2018) to evaluate parameters related to pixel saturation and image blur. Using CellProfiler Analyst 2.2.1 software (Dao et al. Citation2016), the images were classified into positive (i.e. the image is in focus, without artifacts) and negative (out of focus, artifact present). A model was trained using the Fast Gentle Boosting classifier, which returns the 20 most important features used by the classifier to separate the images into positive and negative. Only positive images were used for the next steps in the analysis process. Finally, object segmentation was performed for the identification of nuclei, cells, and cytoplasm using CellProfiler 3.8.1 (Carpenter et al. Citation2006). After object segmentation, features were extracted related to intensity, shape of the objects, and texture, generating a table containing more than 400 features. Data analysis was performed by normalizing the features and analyzing the integrated intensity of the markers in the nuclei and cells to generate the Intensity Ratio to evaluate translocation factors (Nuclei Integrated Intensity/Cells Integrated Intensity), as well as the Integrated Intensity in the nuclei. Plots were generated using the Python 3.8 Software Foundation language (Python Language Reference, version 3.8. Available at http://www.python.org) with the aid of the Seaborn data visualization library (Available at https://seaborn.pydata.org).
Statistical analysis
All the transfection, internalization, cell migration, and proliferation data were analyzed using GraphPad Prism 6 software, to test the significant difference by Two-way ANOVA followed by Tukey test (comparison of means with all other means) with p < 0.05.
The results of Smad2 translocation, Zeb1, and Vimentin were analyzed using the language in Python 3.8 Software Foundation (Python Language Reference, version 3.8. Available at http://www.python.org) with the help of the statannotations library (Charlier et al. Citation2022) to annotate the plots with the statistical difference. The significant difference was determined by Z-test using the statsmodels package (comparison of means with all other means), and the p-value is represented using the symbol *for p-values of: 1.00e-02 < p< =5.00e-02, **1.00e-03 < p< =1.00e-02, ***1.00e-04 < p< =1.00e-03, and ****p< =1.00e-04.
For Vimentin feature selection, the Morpheus software was used witha t-test to assess features that differentiate between control and treated samples (p < 0.05) (Garcia-Fossa et al. Citation2023).
Results
Transfection efficiency mediated by cationic SLN is higher in prostate cancer than in non-cancer cells
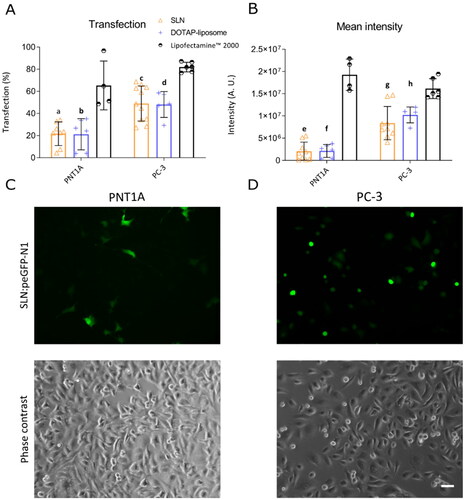
To determine the transfection efficiency of SLN, we incubated both prostate cell lines with the SLNplex (cationic SLN and the plasmid pEGFP-N1). Successfully transfected cells express a green fluorescent protein (EGFP), which is used as a reporter system, allowing quantification of fluorescence intensity and percentage of EGFP-expressing cells. We used Lipofectamine 2000 conjugated with pEGFP-N1, a commercially available gene delivery system, as a positive control for transfection. shows higher transfection efficiency of SLN into PC-3 human prostate cancer cells (60%) compared to human non-cancer prostate cells PNT1A (
20%), consistent with previous results (de Jesus et al. Citation2014; Radaic, de Paula, and de Jesus Citation2015). In addition to the percentage of EGFP-positive cells, the total fluorescence intensity of EGFP was quantified by multiplying the average fluorescence of EGFP by the number of cells transfected. Total fluorescence intensity provides information on the overall expression levels of the EGFP protein in cells. Although the intensity profile was lower than the positive control (B)), the same expression profile was found between cancer and non-cancer cells. This difference in transfection efficiency and overall EGFP expression suggests an cationic SLN preference for delivering cargo into the tumor cell. Nanoparticles that target tumor cells are constantly being sought in gene therapy because they can act preferentially on tumor cells, making them therapeutically more effective and less toxic (Roacho‑Perez et al. Citation2018). Therefore, in this study, we decided to investigate the mechanisms underlying the higher transfection rate of SLN into PC-3 cells.
Figure 1. SLN-mediated transfection in prostate cells. PNT1A and PC-3 cells were plated in a 12-well plate. After 24 h, cells were incubated with SLNplex (SLN:pEGFP-N1) for 4 h, and the transfection medium was replaced with a complete RPMI medium. After 24 h of transfection, cells were trypsinized and transfection efficiency was determined by flow cytometry using FACS calibur. (A) Transfection efficiency in PNT1A and PC-3 cells; (B) Fluorescence intensity in PNT1A and PC-3 cells. The Lipofectamine 2000 group was used as a positive control for transfection. (C) PNT1A cells transfected with SLN:pEGFP-N1 and cell morphology (phase contrast); (D) PC-3 cells transfected with SLN:pEGFP-N1 and cell morphology (phase contrast). Each value represents the average of three independent experiments (n = 2). (a and e) SLN vs. Lipofectamine 2000 (PNT1A); (b and f) DOTAP vs. Lipofectamine 2000 (PNT1A), (c and g) SLN vs. Lipofectamine 2000 (PC-3); (d and h) DOTAP vs. Lipofectamine 2000 (PC-3), p significant difference by Two-way ANOVA, followed by sidak’s mutual comparison test. Scale bar 50
m.
Cationic SLN enhances cell migration in PC-3 prostate cancer cells
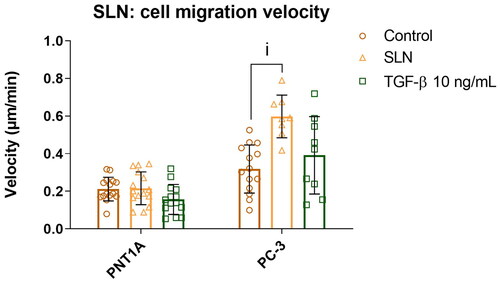
Cancer cell motility is closely related to tumor development and aggressiveness and directly impacts patient prognosis. Therefore, we assessed cell motility after incubation with SLNplex using the cell migration assay (Bouchalova and Bouchal Citation2022; Pijuan et al. Citation2019). In this assay, a scratch is made in the center of the well and cell migration toward the scratch area is monitored using images acquired over time. To reduce the contribution of cell proliferation to scratch closure, we serum-starved cells for 24 hours before treatment (Grada et al. Citation2017). TGF- at 10 ng/mL was used to check if cationic SLN triggered a similar pathway since this cytokine can induce the pro-invasive response in PC-3 prostate tumor cells, thereby increasing cell motility (Kimbrough-Allah, Millena, and Khan Citation2018; Vo et al. Citation2013). In PNT1A cells, there was no significant enhancement in cell migration in the presence either of SLN or TGF-
(, the median for the control is 0.19
m/min, SLN 0.20
m/min, and TGF-
0.15
m/min). Cells treated with TGF-
showed a similar rate of migration as untreated cells, which is to be expected given that PNT1A cells are derived from normal tissue. Surprisingly, PC-3 cells incubated with cationic SLN experienced an almost two-fold increase in migration velocity (, median for Control: 0.31
m/min, SLN: 0.59
m/min, and TGF-
0.42
m/min, p < 0.05). Intrigued by the higher cell migration velocity induced by cationic SLN, we next attempt to identify if any of the cationic SLN components triggered the migration in prostate cancer cells.
Figure 2. Cell migration velocity of prostate cells in the presence of SLN. PNT1A and PC-3 cells were plated at a density of cells/well. On the following day, cells were serum-starved for 24 h before being incubated for 4 h with SLN or TGF-
(10 ng/mL). Then, the scratch was made and images were acquired every 15 minutes on Cytation 5 Hybrid Multidetection Reader (BioTek Instruments, Inc., Winooski, VT, USA). Cell migration velocity is in
/min. Each value represents the mean
standard deviation (SD). The points represents all the replicates of three independent experiments (n = 2). (i) SLN vs. Control (PC-3), p
significant difference by Two-way ANOVA, followed by Sidak’s mutual comparison test.
Cationic SLN components must be organized as nanoparticles to increase the migration velocity in PC-3 cells
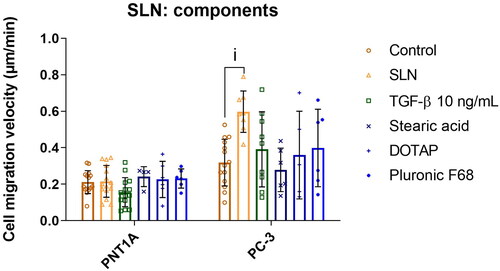
After observing that cationic SLN increased the migration velocity only in cancer cells (PC-3), we decided to determine which component (i.e. stearic acid, DOTAP, and Pluronic F68) was responsible for the effect. For this purpose, components were individually prepared following the same method used to prepare the SLN and tested separately at the same concentrations as they are present in the SLN formulation. PNT1A cells were unresponsive to any isolated component. Interestingly, in PC-3 cells, only SLNplex could increase migration velocity significantly. At the same time, individual SLN components did not affect cell migration (, the median for Control: 0.31 m/min, SLN: 0.59
m/min, TGF-
0.42
m/min, Stearic acid 0.26
m/min, DOTAP 0.30
m/min, and Pluronic F68 0.40
m/min). Notably, the components must be organized as a structure (i.e. SLN) to stimulate the migratory velocity and not as isolated components. These findings led to the hypothesis that the interaction between the SLN and the prostate cancer cell is responsible for the observed effect.
Figure 3. Cell migration velocity of prostate cells in the presence of SLN and its components. PC-3 cells were plated at a density of cells/well. After 24 h, the cells were serum starved for 24 h. Afterward, the cells were treated with SLN, TGF-
and the individual components stearic acid, DOTAP, and pluronic F68 for 4 h. Then, the scratch was made and images were acquired every 15 min in Cytation 5 Cell Imaging Multi-Mode Reader (BioTek Instruments, Inc., Winooski, VT, USA) for 48 h. Cell migration velocity in
/min for PNT1A and PC-3 cells. Each value represents the mean
the standard deviation of three independent experiments (n = 2). (i) SLN vs. Control (PC-3), p
significant difference by Two-way ANOVA, followed by Tukey’s multiple comparisons tests.
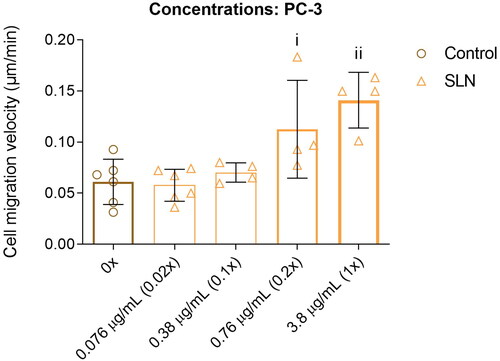
Cationic SLN affects cell migration in PC-3 cells in a concentration-dependent manner
We next sought to determine whether the enhancement in cell migration in PC-3 cells depends on the cationic SLN concentration. Therefore, we incubated PC-3 cells with an SLN concentration-response curve ranging from 0.076 to 3.6 g/mL (0.02× to 1× concentrations used in transfection assays). Lower concentrations of 0.02× (0.076
g/mL) and 0.1× (0.38
g/mL) elicited no measurable change in cell migration (). At 0.76
g/mL (0.2× concentration), cell migration showed behavior similar to that of 1× SLN (). Therefore, the enhancement of cell migration in PC-3 cells depends on the SLN concentration.
Figure 4. SLN induces the migration of PC-3 cells in a dose-dependent manner. PC-3 cells were plated at a density of cells/well. After 24 h, the cells were serum starved for 24 h. The cells were then treated for 4 h with SLN in the following concentrations: 0
/mL (0×, control), 0.076
/mL (0.02×), 0.38
/mL (0.1×), 0.76
/mL (0.2×), and 3.8
/ml (1×). Then, the scratch was made and images were acquired every 15 min in Cytation 5 Cell Imaging Multi-Mode Reader (BioTek Instruments, Inc., Winooski, VT, USA) for 48 h. Cell migration velocity in
/min. Each value represents the mean
the standard deviation. The points represent all the replications of three independent experiments (n = 2). (i) Control (0x) vs. 0.76
/mL, (ii) Control (0x) vs. 3.8
/ml (1×), p
significant difference by Two-way ANOVA, followed by Tukey’s multiple comparisons test.
Cell proliferation is not responsible for the cationic SLN effect on cell migration
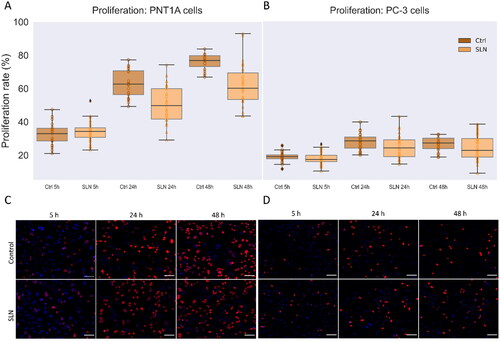
To better understand the biological mechanism underlying the enhancement in cell migration triggered by cationic SLN, we investigate cell proliferation in the presence of SLN. To assess the contribution of proliferation, we evaluated the incorporation of the thymidine analogue EdU using the Click-iT Plus EdU Cell Proliferation Kit for Imaging. We follow cell proliferation in PNT1A and PC-3 cells at 5 h, 24 h, and 48 h in the presence of SLNplex. No significant change in proliferation rate was observed for PNT1A cells in the presence of SLNplex (A), medians at 5 h: Control 34.3% and SLN 32.9%, 24 h: Control 62.6% and SLN 59.7%, 48 h: Control 76.8% and SLN 60.2%). However, the proliferation rate increased even at serum deprivation, reaching 76.8% in 48 h. This finding agrees with the literature because although PNT1A cells originate from non-cancer prostate epithelial tissue, they have a high proliferation rate, reported as approximately 100% after 24 h at serum deprivation (Domińska et al. Citation2016). For PC-3 cells, no significant change in proliferation rate was observed in the presence of SLNplex (, median at 5 h: Control 13.7% and SLN 15.4%, 24 h: Control 25.4% and SLN 21.1%, 48 h: Control 24.1% and SLN 19.4%). Even after 48 hours, the proliferation rate remained at baseline in the presence or absence of cationic SLN, suggesting that serum starvation decreases proliferation rates in PC-3 cells. These results demonstrate that serum starvation is a robust method to maintain PC-3 cell proliferation at basal levels for up to 48 hours, while in PNT1A cells, it is insufficient to arrest cell proliferation. Therefore, we exclude a significant contribution of SLN-induced proliferation to explain the increase in cell migration in PC-3 cells. Hence, we next investigate proteins related to cell migration as an alternative biological mechanism underlying cell migration enhancement.
Figure 5. Cell proliferation in the presence of SLN in PC-3 and PNT1A cells. Cells were plated at a density of cells/well onto coverslips. After overnight incubation, the cells were serum starved for 24 h. Next, the cells were incubated with SLN:pET28A for 4 h. After that, the medium was replaced by RPMI without FBS but containing EdU, and after 5, 24, and 48 h, the cells were fixed with 4% PFA and prepared for Click-iT Plus EdU Cell Proliferation Kit for Imaging, Alexa Fluor 647. The images were acquired in a Cytation 5 Cell Imaging Multi-Mode Reader (BioTek Instruments, Inc., Winooski, VT, USA) with a 20× objective. Cell proliferation rate is based on the ratio of cells labeled with EdU (in red) to the total cells (DAPI, in blue) at 5, 24, and 48 h for PNT1A (A) and PC-3 (B) cells; Representative images of the control cells and treated with SLN after 5 h, 24 h, and 48 h of PNT1A cells (C) and PC-3 cells (D). Each value represents the median (central line in the boxplot)
the lower quartile, the upper quartile, and outliers represented by points above or below the boxplot, from two independent experiments (n = 2) p
significant difference by One Way ANOVA. About 7,000 cells were counted in each treatment. Scale bar 100
SLN modulates vimentin distribution in PC-3 cells
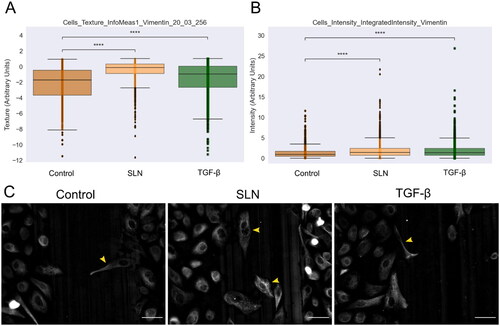
During cell migration and metastasis, cells undergo a process of cytoskeletal remodeling and reorganization. This process requires a complex molecular mechanism, including the epithelial-to-mesenchymal transition (EMT), responsible for increasing cell motility potential. One of the mesenchymal markers is vimentin, an intermediate filament protein abundant in various cell types during EMT (Lo et al. Citation2017) due to its role in cell adhesion and migration (Ridge et al. Citation2018). Thus, to assess whether vimentin is reorganized during cell migration enhancement in the presence of cationic SLN, we performed the scratch assay and monitored protein distribution by immunocytochemistry. After 12 h of migration, cells were fixed and immunostained for vimentin (). In PNT1A cells, vimentin expression and distribution did not change, independent of the presence of TGF- or SLNplex (Supplementary Material Figure 1). In PC-3, the cells at the migration front were more elongated and showed a mesenchymal phenotype, and were observed in the center of the scratch (C), yellow arrows). TGF-
also contained few examples of elongated cells (). We performed a single-cell analysis and feature extraction to quantify this visual difference. Haralick texture features were the most relevant to differentiate between the control and treated samples (t-test, p< 0.05). In , we present two features that have higher values for cationic SLN and TGF-
when compared to the control; higher values of this feature indicate that the texture in those cells is more complex and detailed, with higher heterogeneity and diverse texture. A diverse spatial pattern within the vimentin indicates a reorganization of the cytoskeleton, providing an estimation of morphological diversity within the treated cells (Basak et al. Citation2021; Di Cataldo and Ficarra Citation2017). The integrated intensity of vimentin in cells is higher than the control both in cationic SLN and TGF-
treated cells. This indicates that SLN and TGF-
treatment lead to a noticeable difference, likely driven by a subpopulation of cells, as evidenced by the outliers in both treated groups (). These findings suggest that SLNplex and TGF-
induce an upregulation in vimentin expression and modulate its distribution within PC3 cells.
Figure 6. Vimentin expression in PC-3 cells at the migratory front in the presence of SLN after 12 hours of migration. PC-3 cells were deprived of FBS for 24 h, then were treated with SLN:pET28A or TGF- (10 ng/mL) for 4 h. After treatment, the culture medium was replaced with RPMI without SFB and vertically scratched using a p200 pipette tip. The cells were fixed after 12 h of migration and immunostained for vimentin. Images were acquired on Cytation 5 cell Imaging Multi-Mode Reader (BioTek Instruments, Inc., Winooski, VT, USA) using 20× objective. Quantification of the intensity and texture in single-cells was made using CellProfiler. Cells with mesenchymal-like phenotypes are indicated with a yellow arrow. Scale bar represents 50
(A) Cells_texture_InfoMeas1_vimentin_20_03_256 feature,(B) Cells_intensity_IntegratedIntensity_vimentin, and (C) Representative images of PC-3 cells. Cells with mesenchymal-like phenotypes are pointed by yellow arrows. Scale bar 50 µm. All points represent the single-cells of two independent experiments (n = 1). Z-test (comparison of means with all other means) was performed using statannotations and statmodels package: ****for p< =1.00e-04.
SLN do not affect Smad2 translocation: excluding TGF- canonical participation
Since cell remodeling was observed upon SLNplex treatment, we postulated that the TGF- signaling pathway might be involved in this process. Activation of canonical TGF-
signaling is characterized by nuclear translocation of phosphorylated Smad2, where it modulates the expression of hundreds of genes (David and Massagué Citation2018). Therefore, we investigated whether SLNplex induces Smad2 translocation during enhanced PC-3 cell migration. Single cells were analyzed for nuclear translocation of Smad2. TGF-
(10 ng/ml) was used as a positive control for Smad2 translocation. In PNT1A cells, TGF-
induced translocation of Smad2 into the nucleus for up to 4 h, shown by the higher integrated intensity of Smad2 in the nuclei (). After this time, while Smad2 is still present in the nucleus, some of it translocate back to the cytoplasm (A), significant differences in Nuclei Intensity and images in C). Although there are significant differences in the nuclei intensity, and visual inspection shows Smad2 in the nuclei of TGF-
-treated cells, there is no significant difference in the ratio intensity between nuclei and cells after 4 h (B)). No differences were detected between untreated cells and in the presence of SLN, suggesting that SLN did not induce Smad2 translocation in PNT1A cells over the period examined. In PC-3 cells, treatment with TGF-
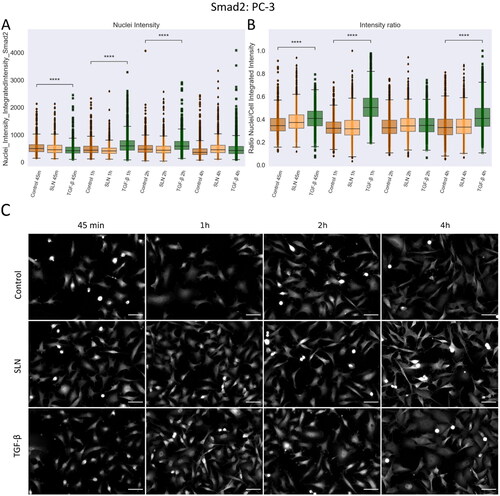
also induced translocation of the Smad2 protein into the nuclei, which peaked between the first hour of treatment up to two hours ((A), TGF-
45 min, 1 h, and 2 h, significant difference to control). The statistical difference is maintained when the ratio of intensity between the nuclei and the cells was measured, confirming the translocation of Smad2 to the nuclei (). During the period evaluated, cationic SLN did not induce any translocation of Smad2 into the nuclei of PC-3 cells (, representative images in (C)). These results, along with vimentin remodeling, led us to investigate whether cationic SLN could enhance migration through the epithelial-to-mesenchymal transition (EMT), considering that PC-3 cells are in a partial transitional state and, therefore, a part of the cell population still present are susceptible to EMT induction, prompting us to examine some important proteins of this signaling pathway.
Figure 7. Nuclear translocation of Smad2 in PNT1A cells. PNT1A cells were plated on coverslips previously treated with poly-L-lysine and plated at a density of cells/well. After 24 hours, cells were treated with SLN:pET28A or TGF-
(10 ng/mL) for 45 min, 1 h, 2 h, and 4 h. After the treatment periods, the cells were fixed with 4% PFA and prepared for immunofluorescence of Smad2, and then labeled with Alexa Fluor 488. After immunostaining, the images were acquired using a 10× objective with Cytation 5 Cell Imaging Multi-Mode Reader (BioTek Instruments, Inc., Winooski, VT, USA). (A) Single-cells nuclei integrated intensity of Smad2 after 45 min, 1 h, 2 h, and 4 h; (B) Intensity ratio between the integrated intensity of the nuclei/integrated intensity of the cells; (C) Representative images of Smad2 in grayscale. Each value represents the median (central line in the boxplot)
the lower and upper quartile, and outliers are represented by points from three independent experiments (n = 2). Z-test (comparison of means with all other means) was performed using statannotations and statmodels package: ****For p< = 1.00e-04. Scale bar 50
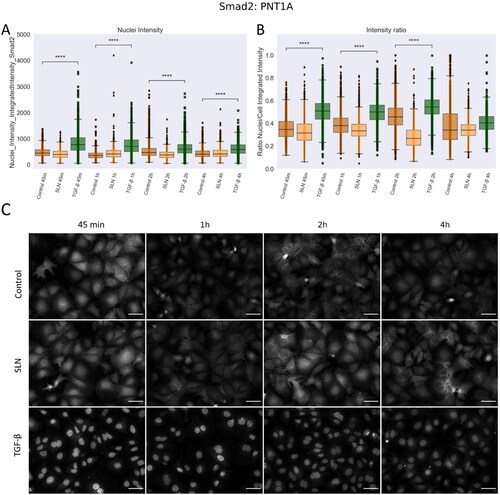
Figure 8. Nuclear translocation of Smad2 in PC3 cells. PC-3 cells were plated on coverslips previously treated with poly-L-lysine and plated at a density of cells/well. After 24 hours, cells were treated with SLN:pET28A or TGF-
10 ng/mL for 45 min, 1 h, 2 h, and 4 h. After the treatment periods, the cells were fixed with 4% PFA and prepared for immunofluorescence of Smad2, and then labeled with Alexa Fluor 488. After immunostaining, the images were acquired using a 10x objective with Cytation 5 Cell Imaging Multi-Mode Reader (BioTek Instruments, Inc., Winooski, VT, USA). (A) Single-cells nuclei integrated intensity of Smad2 after 45 min, 1 h, 2 h, and 4 h; (B) Intensity ratio between the integrated intensity of the nuclei/integrated intensity of the cells; (C) Representative images of Smad2 in grayscale. Each value represents the median (central line in the boxplot)
the lower quartile, the upper quartile, and outliers represented by points from three independent experiments (n = 2), Z-test (comparison of means with all other means) was performed using statannotations and statmodels package: ****For p< =1.00e-04. Scale bar 50
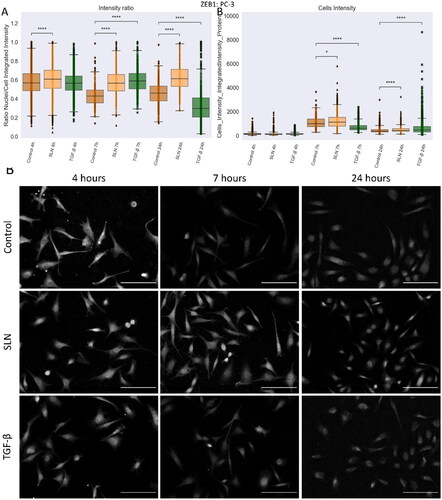
Cationic SLN increases ZEB1 nuclear translocation in PC-3 cells over a longer period
EMT is crucial during the progression from non-metastatic to metastatic cancer, and the TGF-β ligand family is among the extracellular signals that can trigger this event (Zhang and Weinberg Citation2018). This process is ultimately mediated by transcription factors such as ZEB1 and SNAIL. Therefore, we follow the translocations and expression of these EMT regulators. To determine whether the translocation of ZEB1 into the nucleus of PC-3 cells was triggered before 24 h, we evaluated the distribution of ZEB1 after 4, 7, and 24 h in PNT1A and PC-3 cells in the presence or absence of cationic SLN (). The integrated intensity of ZEB1 was measured in the nuclei of single cells, and an intensity ratio value (nuclei/cells integrated intensity) was generated. In PNT1A cells, both SNAIL and ZEB1 were unaffected in the presence of SLN (Supplementary Figure 2). Only PNT1A cells treated with TGF- had decreased ZEB1 intensity in the nucleus (Supplementary Figure 2). An increase in nuclear ZEB1 intensity was observed in PC-3 cells after incubation with cationic SLN (A)), which peaked after 7 hours for SLN and also TGF-
-treated PC-3 cells, confirmed by the intensity ratio (). The increase in ZEB1 intensity in SLN-treated cells () is remarkable because the protein is concentrated in the nuclei even after 24 h of cationic SLN treatment. For TGF-
-treated PC-3 cells, the intensity ratio after 24 h is lower than the control cells, showing that ZEB1 returned to the cytoplasm (). For SNAIL, the treatments showed no difference in expression or localization after 24 h (Supplementary Figure 3). Our results demonstrate that cationic SLN triggers ZEB1 nuclear translocation and keeps the transcription factor within the nucleus longer.
Figure 9. ZEB1 protein in PC3 cells after 24 h of treatment. PC-3 cells were treated with SLN:pET28A and TGF- (10 ng/mL) for 4 h. After 4 h, the culture medium was replaced by RPMI without FBS. The cells were fixed at 4, 7, and 24 h after transfection and prepared for immunofluorescence for ZEB1 and SNAIL. The images were acquired in Cytation 5 cell Imaging Multi-Mode Reader (BioTek Instruments, Inc., Winooski, VT, USA) using a 10× objective. On average,
cells were counted in each treatment. (A) Intensity ratio between the integrated intensity of the nuclei/integrated intensity of the cells for ZEB1; (B) Integrated intensity of ZEB1 within the cells, and (C) Representative images of the PC-3 cells for ZEB1 marker. Each value represents the median (central line in the boxplot)
the lower quartile, the upper quartile, and outliers represented by points from three independent experiments (n = 1) Z-test (comparison of means with all other means) was performed using statannotations and statmodels package: ****For p< =1.00e-04. Scale bar 50
Discussion
The use of nanoparticles for gene delivery has attracted attention in recent years, particularly with the development of COVID-19 vaccines made from lipid nanoparticles to deliver miRNA (Milane and Amiji Citation2021). Therefore, uncovering molecular mechanisms of interaction between nanoparticles and cells has become essential for further developing safe and more efficient nonviral gene delivery systems for treating and preventing diseases (Webb et al. Citation2022). In this study, we investigate the effects of cationic SLN as a gene delivery system on prostate cancer (PC-3) and non-cancer prostate cells (PNT1A). We show that cationic SLN deliver the gene reporter more efficiently (approximately three times more efficiently) to PC-3 than to PNT1A cells. This result led to investigating the molecular mechanisms by which cationic SLN deliver genes to the studied prostate cell lines. Interestingly, we demonstrate for the first time, to the best of our knowledge, that cationic SLN enhance the cell migration velocity of PC-3 prostate cancer cells. To better understand these unexpected findings, we determined that the effect on cell migration is nanoparticle dependent since individual SLN components did not affect PC-3 migration, and this effect is concentration dependent since SLN even smaller concentrations of cationic SLN increases PC-3 migration velocity. Our results provide molecular details about the interaction of SLN with prostate cancer cells, wherein nanoparticles enhance vimentin expression and reinforce ZEB1 nucleus translocation, suggesting the mechanism by which SLN changes the behavior of prostate cancer cells.
Our results reveal that cationic SLN enhanced PC-3 cancer cell migration in a nanoparticle and concentration-dependent manner. Many nanoparticles have been reported to enhance the wound healing response in desirable situations, e.g. in wounds and pathological scars due to diabetes (Meng et al. Citation2018; Oryan, Alemzadeh, and Zarei Citation2019). However, the adverse effects of nanoparticles regarding cell migration, especially SLN, are often overlooked (Moraes-Lacerda and de Jesus Citation2022). Although essential under physiological conditions, increased cell migration in tumor cells are undesirable as it increases cancer cell motility, potentially leading to metastasis. During metastasis, cells form new tumor colonies outside of the primary tumor. To do this, the cells must enter the bloodstream and migrate to distant tissues (Paul, Mistriotis, and Konstantopoulos Citation2017). To navigate through tissues, cells must undergo an intense cytoskeletal deformation and reorganization process. The migration velocity of these migrating cells indicates how quickly cells can organize their cytoskeleton to move from one tissue to another. One hypothesis is that cells with phenotypes that favor cell motility are selected to drive tumor progression (Liu et al. Citation2020). Therefore, our results raise awareness on potential safety concerns of using cationic SLN as a gene delivery system for prostate cancer cells
We found that cationic SLN induced the translocation of ZEB1 into the nuclei of PC-3 cells and remained in the nucleus up to 24 hours after SLN transfection. It is important to consider that PC-3 prostate cancer cells express both epithelial and mesenchymal phenotypes. Hence, they are considered a mixed phenotype population with features associated with a partial epithelial-mesenchymal state (pEMT, partial epithelial-to-mesenchymal transition) (Fontana et al. Citation2019). Acquiring a partial EMT phenotype from epithelial tumor cells may increase invasion and metastatic potential; studies suggest that transcription factors such as ZEB1/2 and SNAIL1/2 might mediate the induction of the EMT phenotype in PC-3 cells (Kong et al. Citation2009). In addition, prostate cancer cells from primary sites may have acquired MET (mesenchymal-to-epithelial transition) properties when they arrived at the metastatic site (PC-3 is bone-derived), and this is related to the phenotype of the fused cells (Kong et al. Citation2011). EMT is a common process in embryogenesis in which epithelial cells (which exhibit cohesive intercellular adhesion and low cell motility) transition to the mesenchymal phenotype, marked by the loss of cell-cell interaction and increased cell motility. In cancer, EMT is given a new purpose by enabling cell invasion and migration through loss of E-cadherin expression, cytoskeletal rearrangement, and increased expression of N-cadherin, SNAIL1/2, ZEB1/2, and vimentin (David and Massagué Citation2018; Katsuno et al. Citation2019). Vimentin is an intermediate filament protein associated with mesenchymal cells, and during EMT, vimentin is commonly expressed or upregulated, reorganizing in the cytoplasm and contributing to cell motility. Activation of a bidirectional switch SNAIL1/miR34 was shown to transition EMT from the epithelial state to the TGF--triggered partial state, thereby reducing E-cadherin expression and enhancing vimentin. The cells then transition from the partial to the mesenchymal state by activating the ZEB1/miR200 switch, and E-cadherin is lost with an increase in vimentin (Zhang et al. Citation2014). ZEB1 is important for the partial EMT phenotype of PC-3 cells since its downregulation by miR200 leads to higher expression of E-cadherin (Kong et al. Citation2009), and the transcription factor is required for transendothelial migration of a subpopulation of PC-3 cells (Drake et al. Citation2009). The SLN-induced increase in vimentin expression after 12 hours of cell migration and the results regarding ZEB1 suggest that SLN enhances PC-3 cell migration by modulating these factors.
We have addressed the potential adverse effects of SLN as a gene delivery system in prostate cells for the first time. However, we cannot make a general statement about the overall toxicological effects of the SLN as a drug delivery system nor under different conditions in vitro or in vivo. Therefore, further studies should determine whether SLN can increase the migration of prostate cancer cells in patients. We emphasize that the effect of nanoparticles is cell-dependent, which would allow additional cell lines to be tested to support or reject this hypothesis. As previously mentioned, a cell line may contain subpopulations that respond differently to treatment, as in the case of PC-3 cells that exhibit epithelial and mesenchymal phenotypes in the same population (Fontana et al. Citation2019). Our results contribute to the urgent need for a more detailed understanding of the cytotoxicity of nonviral gene delivery systems and undoubtedly contribute to the development of safe translational nanomaterials.
Conclusion
To the best of our knowledge, we have reported for the first time that cationic SLN promote cell migration in PC-3 prostate cancer cells. We provide a first insight into the underlying mechanism and propose that the effect of SLN on PC-3 migration is due to ZEB1 retention in the nucleus for prolonged periods and enhanced vimentin expression, resulting in an alteration of the PC-3 phenotype. The observed molecular changes raise awareness of the potential implications of the use of SLN for cancer treatment. These and other nanoparticles have been widely used to deliver gene or drug treatment into cancer cells. However, as we demonstrate here, nanoparticles could have side effects, such as changes in gene expression, resulting in abnormal cell migration and cytoskeletal regulators. Subsequent investigations should explore the possibility of nanoparticles increasing the likelihood of metastasis in certain cell lines since changes in gene expression can drive cancer cell migration and invasion (Novikov et al. Citation2021). These studies are imperative to ensure the safe use of nanoparticles. Our work brings to light important concerns about nanotoxicity – nanoparticles that at first glance appear harmless due to their biocompatible composition can perform below expectations and have subtle but malignant effects on cancer cells. Therefore, we emphasize that in vitro work is essential to identify these subtle effects and may point to further relevant in vivo studies and clinical trials using cationic SLN.
Supplemental Material
Download PDF (3.4 MB)Disclosure statement
No potential conflict of interest was reported by the author(s).
Data availability statement
All data generated or analyzed during this study are included in this published article and its supplementary information files.
Additional information
Funding
References
- Akanda, M. H., R. Rai, I. J. Slipper, B. Z. Chowdhry, D. Lamprou, G. Getti, and D. Douroumis. 2015. “Delivery of Retinoic Acid to LNCap Human Prostate Cancer Cells Using Solid Lipid Nanoparticles.” International Journal of Pharmaceutics 493 (1–2): 161–171. https://doi.org/10.1016/j.ijpharm.2015.07.042
- Badawi, N. M., M. H. Teaima, K. M. El-Say, D. A. Attia, M. A. El-Nabarawi, and M. M. Elmazar. 2018. “Pomegranate Extract-Loaded Solid Lipid Nanoparticles: design, Optimization, and in Vitro Cytotoxicity Study.” International Journal of Nanomedicine 13: 1313–1326. https://doi.org/10.2147/IJN.S154033
- Barrett, C. S. X., A. C. Millena, and S. A. Khan. 2017. “TGF-β Effects on Prostate Cancer Cell Migration and Invasion Require FosB.” The Prostate 77 (1): 72–81. https://doi.org/10.1002/pros.23250
- Basak, A. K., M. Mirzaei, K. Strzałka, and K. Yamada. 2021. “Texture Feature Extraction from Microscope Images Enables a Robust Estimation of ER Body Phenotype in Arabidopsis.” Plant Methods.17 (1): 109. https://doi.org/10.1186/s13007-021-00810-w
- Bhagwat, G. S., R. B. Athawale, R. P. Gude, S. Md, N. A. Alhakamy, U. A. Fahmy, and P. Kesharwani. 2020. “Formulation and Development of Transferrin Targeted Solid Lipid Nanoparticles for Breast Cancer Therapy.” Frontiers in Pharmacology 11: 614290. https://doi.org/10.3389/fphar.2020.614290
- Bhatt, S., J. Sharma, M. Singh, and V. Saini. 2018. “Solid Lipid Nanoparticles: A Promising Technology for Delivery of Poorly Water-Soluble Drugs.” ACTA Pharmaceutica Sciencia 56 (3): 27. https://doi.org/10.23893/1307-2080.APS.05616
- Bouchalova, P., and P. Bouchal. 2022. “Current Methods for Studying Metastatic Potential of Tumor Cells.” Cancer Cell International 22 (1): 1–22. https://doi.org/10.1186/s12935-022-02801-w
- Bray, M.A., A. E. Carpenter. 2018. “Quality Control for High-Throughput Imaging Experiments Using Machine Learning in CellProfiler”. Methods Mol. Biol. 1683, 89–112. https://doi.org/10.1007/978-1-4939-7357-6_7
- Carpenter, A. E., T. R. Jones, M. R. Lamprecht, C. Clarke, I. H. Kang, O. Friman, D. A. Guertin, et al. 2006. “CellProfiler: image Analysis Software for Identifying and Quantifying Cell Phenotypes.” Genome Biology 7 (10): R100. https://doi.org/10.1186/gb-2006-7-10-r100
- Charlier, F., M. Weber, D. Izak, E. Harkin, M. Magnus, J. Lalli, L. Fresnais, et al. 2022. “Statannotations (v0.6).” Zenodo. https://doi.org/10.5281/zenodo.7213391.
- Dao, D., A. N. Fraser, J. Hung, V. Ljosa, S. Singh, and A. E. Carpenter. 2016. “CellProfiler Analyst: interactive Data Exploration, Analysis and Classification of Large Biological Image Sets.” Bioinformatics 32 (20): 3210–3212. https://doi.org/10.1093/bioinformatics/btw390
- David, C. J., and J. Massagué. 2018. “Contextual Determinants of TGFβ Action in Development, Immunity and Cancer.” Nature Reviews. Molecular Cell Biology 19 (7): 419–435. https://doi.org/10.1038/s41580-018-0007-0
- de Jesus, M. B., C. V. Ferreira, E. de Paula, D. Hoekstra, and I. S. Zuhorn. 2010. “Design of Solid Lipid Nanoparticles for Gene Delivery into Prostate Cancer.” Journal of Controlled Release: 148 (1): e89-90–e90. https://doi.org/10.1016/j.jconrel.2010.07.065
- de Jesus, M. B., A. Radaic, W. L. J. Hinrichs, C. V. Ferreira, E. de Paula, D. Hoekstra, and I. S. Zuhorn. 2014. “Inclusion of the Helper Lipid Dioleoyl-Phosphatidylethanolamine in Solid Lipid Nanoparticles Inhibits Their Transfection Efficiency.” Journal of Biomedical Nanotechnology 10 (2): 355–365. https://doi.org/10.1166/jbn.2014.1804
- de Jesus, M. B., A. Radaic, I. S. Zuhorn, and E. de Paula. 2013. “Microemulsion Extrusion Technique: A New Method to Produce Lipid Nanoparticles.” Journal of Nanoparticle Research 15 (10): 1960. https://doi.org/10.1007/s11051-013-1960-3
- de Jesus, M. B., and I. S. Zuhorn. 2015. “Solid Lipid Nanoparticles as Nucleic Acid Delivery System: Properties and Molecular Mechanisms.” Journal of Controlled Release 201: 1–13. https://doi.org/10.1016/j.jconrel.2015.01.010
- Debelec-Butuner, B., M. Kotmakci, E. Oner, G. Ozduman, and A. G. Kantarci. 2019. “Nutlin3a-Loaded Nanoparticles Show Enhanced Apoptotic Activity on Prostate Cancer Cells.” Molecular Biotechnology 61 (7): 489–497. https://doi.org/10.1007/s12033-019-00178-2
- Di Cataldo, S., and E. Ficarra. 2017. “Mining Textural Knowledge in Biological Images: Applications, Methods and Trends.” Computational and Structural Biotechnology Journal 15: 56–67. https://doi.org/10.1016/j.csbj.2016.11.002
- Domińska, K., T. Ochędalski, K. Kowalska, Z. E. Matysiak-Burzyńska, E. Płuciennik, and A. W. Piastowska-Ciesielska. 2016. “A Common Effect of Angiotensin II and Relaxin 2 on the PNT1A Normal Prostate Epithelial Cell Line.” Journal of Physiology and Biochemistry 72 (3): 381–392. https://doi.org/10.1007/s13105-016-0489-1
- Drake, J. M., G. Strohbehn, T. B. Bair, J. G. Moreland, and M. D. Henry. 2009. “ZEB1 Enhances Transendothelial Migration and Represses the Epithelial Phenotype of Prostate Cancer Cells.” Molecular Biology of the Cell 20 (8): 2207–2217. https://doi.org/10.1091/mbc.E08-10-1076
- Fontana, F., M. Raimondi, M. Marzagalli, M. Sommariva, P. Limonta, and N. Gagliano. 2019. “Epithelial-To-Mesenchymal Transition Markers and CD44 Isoforms Are Differently Expressed in 2D and 3D Cell Cultures of Prostate Cancer Cells.” Cells 8 (2): 143. https://doi.org/10.3390/cells8020143
- Garcia-Fossa, F., M. C. Cruz, M. Haghighi, M. B. de Jesus, S. Singh, A. E. Carpenter, and B. A. Cimini. 2023. “Interpreting Image-Based Profiles Using Similarity Clustering and Single-Cell Visualization.” Current Protocols 3 (3): e713. https://doi.org/10.1002/cpz1.713
- Garcia-Fossa, F., V. Gaal, and M. B. de Jesus. 2020. “PyScratch: An Ease of Use Tool for Analysis of Scratch Assays.” Computer Methods and Programs in Biomedicine 193: 105476. https://doi.org/10.1016/j.cmpb.2020.105476
- Grada, A., M. Otero-Vinas, F. Prieto-Castrillo, Z. Obagi, and V. Falanga. 2017. “Research Techniques Made Simple: Analysis of Collective Cell Migration Using the Wound Healing Assay.” The Journal of Investigative Dermatology 137 (2): e11–e16. https://doi.org/10.1016/j.jid.2016.11.020
- Katsuno, Y., D. S. Meyer, Z. Zhang, K. M. Shokat, R. J. Akhurst, K. Miyazono, and R. Derynck. 2019. “Chronic TGF-β Exposure Drives Stabilized EMT, Tumor Stemness, and Cancer Drug Resistance with Vulnerability to Bitopic mTOR Inhibition.” Science Signaling 12 (570): eaau8544. https://doi.org/10.1126/scisignal.aau8544
- Kimbrough-Allah, M. N., A. C. Millena, and S. A. Khan. 2018. “Differential Role of PTEN in Transforming Growth Factor β (TGF-β) Effects on Proliferation and Migration in Prostate Cancer Cells.” The Prostate 78 (5): 377–389. https://doi.org/10.1002/pros.23482
- Kong, D., Y. Li, Z. Wang, S. Banerjee, A. Ahmad, H.-R. C. Kim, and F. H. Sarkar. 2009. “The miR-200 Regulates PDGF-D Mediated Epithelial-Mesenchymal Transition, Adhesion and Invasion of Prostate Cancer Cells.” Stem Cells 27 (8): 1712–1721. https://doi.org/10.1002/stem.101
- Kong, D., Y. Li, Z. Wang, and F. H. Sarkar. 2011. “Cancer Stem Cells and Epithelial-to-Mesenchymal Transition (EMT)-Phenotypic Cells: Are They Cousins or Twins?” Cancers 3 (1): 716–729. https://doi.org/10.3390/cancers30100716
- Liu, Z., S. J. Lee, S. Park, K. Konstantopoulos, K. Glunde, Y. Chen, and I. Barman. 2020. “Cancer Cells Display Increased Migration and Deformability in Pace with Metastatic Progression.” FASEB Journal 34 (7): 9307–9315. https://doi.org/10.1096/fj.202000101RR
- Lo, U.-G., C.-F. Lee, M.-S. Lee, and J.-T. Hsieh. 2017. “The Role and Mechanism of Epithelial-to-Mesenchymal Transition in Prostate Cancer Progression.” International Journal of Molecular Sciences 18 (10): 2079. https://doi.org/10.3390/ijms18102079
- Lonez, C., M. F. Lensink, M. Vandenbranden, and J.-M. Ruysschaert. 2009. “Cationic Lipids Activate Cellular Cascades. Which Receptors Are Involved?” Biochimica et Biophysica Acta 1790 (6): 425–430. https://doi.org/10.1016/j.bbagen.2009.02.015
- Lonez, C., M. Vandenbranden, and J.-M. Ruysschaert. 2012. “Cationic Lipids Activate Intracellular Signaling Pathways.” Advanced Drug Delivery Reviews 64 (15): 1749–1758. https://doi.org/10.1016/j.addr.2012.05.009
- Ma, J., C. Ji, D. Xiao, and Q. Fan. 2018. “Quercetin-Loaded Solid Lipid Nanoparticles-Enriched Hydrogel Prevents the Formation of Skin Scars by Inhibiting TGF-β/Smad Signaling Pathway.” Biomedical Research 29 (7): 1321–1326. https://doi.org/10.4066/biomedicalresearch.29-17-2202
- Mendonça, M. C. P., A. Radaic, F. Garcia-Fossa, M. A. da Cruz-Höfling, M. A. R. Vinolo, and M. B. de Jesus. 2019. “The in Vivo Toxicological Profile of Cationic Solid Lipid Nanoparticles.” Drug Delivery and Translational Research 10 (1): 34–42. https://doi.org/10.1007/s13346-019-00657-8
- Meng, Z., D. Zhou, Y. Gao, M. Zeng, and W. Wang. 2018. “miRNA Delivery for Skin Wound Healing.” Advanced Drug Delivery Reviews 129: 308–318. https://doi.org/10.1016/j.addr.2017.12.011
- Milane, L., and M. Amiji. 2021. “Clinical Approval of Nanotechnology-Based SARS-CoV-2 mRNA Vaccines: Impact on Translational Nanomedicine.” Drug Delivery and Translational Research 11 (4): 1309–1315. https://doi.org/10.1007/s13346-021-00911-y
- Moraes-Lacerda, T., and M. B. de Jesus. 2022. “Mechanisms of Solid Lipid Nanoparticles-Triggered Signaling Pathways in Eukaryotic Cells.” Colloids and Surfaces. B, Biointerfaces 220: 112863. https://doi.org/10.1016/j.colsurfb.2022.112863
- Novikov, N. M., S. Y. Zolotaryova, A. M. Gautreau, and E. V. Denisov. 2021. “Mutational Drivers of Cancer Cell Migration and Invasion.” British Journal of Cancer 124 (1): 102–114. https://doi.org/10.1038/s41416-020-01149-0
- Oner, E., M. Kotmakci, A.-M. Baird, S. G. Gray, B. Debelec Butuner, E. Bozkurt, A. G. Kantarci, and S. P. Finn. 2021. “Development of EphA2 siRNA-Loaded Lipid Nanoparticles and Combination with a Small‐Molecule Histone Demethylase Inhibitor in Prostate Cancer Cells and Tumor Spheroids.” Journal of Nanobiotechnology 19 (1): 71. https://doi.org/10.1186/s12951-021-00781-z
- Oryan, A., E. Alemzadeh, and M. Zarei. 2019. “Basic Concepts, Current Evidence, and Future Potential for Gene Therapy in Managing Cutaneous Wounds.” Biotechnology Letters 41 (8–9): 889–898. https://doi.org/10.1007/s10529-019-02701-6
- Paul, C. D., P. Mistriotis, and K. Konstantopoulos. 2017. “Cancer Cell Motility: lessons from Migration in Confined Spaces.” Nature Reviews. Cancer 17 (2): 131–140. https://doi.org/10.1038/nrc.2016.123
- Payne, C. M., L. P. Burke, B. Cavanagh, D. O’Toole, S.-A. Cryan, and H. M. Kelly. 2019. “Evaluation of the Immunomodulatory Effects of All-Trans Retinoic Acid Solid Lipid Nanoparticles and Human Mesenchymal Stem Cells in an A549 Epithelial Cell Line Model.” Pharmaceutical Research 36 (4): 50. https://doi.org/10.1007/s11095-019-2583-x
- Pijuan, J., C. Barceló, D. F. Moreno, O. Maiques, P. Sisó, R. M. Marti, A. Macià, and A. Panosa. 2019. “In Vitro Cell Migration, Invasion, and Adhesion Assays: From Cell Imaging to Data Analysis.” Frontiers in Cell and Developmental Biology 7 (107): 1–16. https://doi.org/10.3389/fcell.2019.00107
- Radaic, A., and M. B. de Jesus. 2018. “Solid Lipid Nanoparticles Release DNA upon Endosomal Acidification in Human Embryonic Kidney Cells.” Nanotechnology 29 (31): 315102. https://doi.org/10.1088/1361-6528/aac447
- Radaic, A., E. de Paula, and M. B. de Jesus. 2015. “Factorial Design and Development of Solid Lipid Nanoparticles (SLN) for Gene Delivery.” Journal of Nanoscience and Nanotechnology 15 (2): 1793–1800. https://doi.org/10.1166/jnn.2015.9002
- Ridge, S. M., D. Bhattacharyya, E. Dervan, S. D. Naicker, A. J. Burke, J. M. Murphy, K. O'leary, et al. 2018. “Secreted Factors from Metastatic Prostate Cancer Cells Stimulate Mesenchymal Stem Cell Transition to a Pro-Tumourigenic ‘Activated’ State That Enhances Prostate Cancer Cell Migration.” International Journal of Cancer 142 (10): 2056–2067. https://doi.org/10.1002/ijc.31226
- Roacho‑Perez, J. A., H. L. Gallardo‑Blanco, M. Sanchez‑Dominguez, P. E. Garcia‑Casillas, C. Chapa‑Gonzalez, and C. N. Sanchez‑Dominguez. 2018. “Nanoparticles for Death‑Induced Gene Therapy in Cancer (Review).” Molecular Medicine Reports 17: 1413–1420. https://doi.org/10.3892/mmr.2017.8091
- Rüger, J., S. Ioannou, D. Castanotto, and C. A. Stein. 2020. “Oligonucleotides to the (Gene) Rescue: FDA Approvals 2017–2019.” Trends in Pharmacological Sciences 41 (1): 27–41. https://doi.org/10.1016/j.tips.2019.10.009
- Scheideler, M., I. Vidakovic, and R. Prassl. 2020. “Lipid Nanocarriers for microRNA Delivery.” Chemistry and Physics of Lipids 226: 104837. https://doi.org/10.1016/j.chemphyslip.2019.104837
- Shahryari, A., I. Burtscher, Z. Nazari, and H. Lickert. 2021. “Engineering Gene Therapy: Advances and Barriers.” Advanced Therapeutics 4 (9): 2100040. https://doi.org/10.1002/adtp.202100040
- Silva, A. H., C. Locatelli, F. B. Filippin-Monteiro, B. G. Zanetti-Ramos, A. Conte, and T. B. Creczynski-Pasa. 2014. “Solid Lipid Nanoparticles Induced Hematological Changes and Inflammatory Response in Mice.” Nanotoxicology 8 (2): 212–219. https://doi.org/10.3109/17435390.2013.782076
- Smith, T., K. Affram, E. L. Nottingham, B. Han, F. Amissah, S. Krishnan, J. Trevino, and E. Agyare. 2020. “Application of Smart Solid Lipid Nanoparticles to Enhance the Efficacy of 5-Fluorouracil in the Treatment of Colorectal Cancer.” Scientific Reports 10 (1): 16989. https://doi.org/10.1038/s41598-020-73218-6
- Vo, B. T., D. Morton, S. Komaragiri, A. C. Millena, C. Leath, and S. A. Khan. 2013. “TGF-β Effects on Prostate Cancer Cell Migration and Invasion Are Mediated by PGE2 through Activation of PI3K/AKT/mTOR Pathway.” Endocrinology 154 (5): 1768–1779. https://doi.org/10.1210/en.2012-2074
- Webb, C., S. Ip, N. V. Bathula, P. Popova, S. K. V. Soriano, H. H. Ly, B. Eryilmaz, et al. 2022. “Current Status and Future Perspectives on MRNA Drug Manufacturing.” Molecular Pharmaceutics 19 (4): 1047–1058. https://doi.org/10.1021/acs.molpharmaceut.2c00010
- Zhang, J., X.-J. Tian, H. Zhang, Y. Teng, R. Li, F. Bai, S. Elankumaran, and J. Xing. 2014. “TGF-β–Induced Epithelial-to-Mesenchymal Transition Proceeds through Stepwise Activation of Multiple Feedback Loops.” Science Signaling 7 (345): ra91. https://doi.org/10.1126/scisignal.2005304
- Zhang, Y., and R. A. Weinberg. 2018. “Epithelial-to-Mesenchymal Transition in Cancer: complexity and Opportunities.” Frontiers of Medicine 12 (4): 361–373. https://doi.org/10.1007/s11684-018-0656-6