
 ?Mathematical formulae have been encoded as MathML and are displayed in this HTML version using MathJax in order to improve their display. Uncheck the box to turn MathJax off. This feature requires Javascript. Click on a formula to zoom.
ABSTRACT
For a long time, the most vivid evidence of earnings management has been a discontinuity of earnings distributions at the threshold of profits and losses, indicating loss-avoidance behavior. In the US, this discontinuity disappeared around the time the Sarbanes-Oxley Act was implemented, suggesting that the reform had successfully pushed back earnings management. In 2006, the EU established its own set of rules for audits, public oversight of audits and investor protection in Directive 2006/43/EC, sometimes referred to as ‘European SOX’. We analyse whether the zero earnings discontinuity in Europe has disappeared after the introduction of European SOX and find that this is not the case: In contrast to the US, the discontinuity has remained stable in Europe, and it remains more pronounced in code law countries and in cultures of high uncertainty avoidance.
1. Introduction
After major accounting scandals such as Enron and Worldcom, an overall objective of the Sarbanes-Oxley Act (SOX) in the US was to improve the accuracy and reliability of financial reporting, which includes pushing back earnings management. For a long time, the most vivid evidence of earnings management has been that earnings distributions show a discontinuity at the threshold of gains and losses. This so called zero earnings (ZE) discontinuity (also referred to as the ZE kink) was discovered by Burgstahler and Dichev (Citation1997) and has been confirmed by many other studies.Footnote1 If SOX succeeded in pushing back earnings management, we would expect the ZE discontinuity in the US to decline after 2002. This is what the seminal paper of Gilliam et al. (Citation2015) actually finds: the ZE discontinuity disappeared around the time when SOX was implemented. Studies based on accrual measures of earnings management have confirmed this finding (Bartov & Cohen, Citation2009; Cohen et al., Citation2008; Lobo & Zhou, Citation2006, Citation2010).
Accounting scandals at the turn of the millennium also occurred outside the US (e.g. Seibu Railway and Kanebo in Japan and Comroad and Royal Ahold in Europe), which led to new regulations partly similar to SOX. The Japanese version of SOX known as J-SOX consists of the Financial Instruments and Exchange Act of 2006, which had to be applied for fiscal years starting in April 2008. Enomoto and Yamaguchi (Citation2017) show that in contrast to the US, J-SOX did not make the ZE discontinuity in Japan disappear. The authors offer two possible explanations: SOX in the US could have been more effective than J-SOX, or Japanese firms may have stronger incentives to avoid losses.
In a similar attempt to strengthen oversight of financial reporting, the European Union (EU) passed Directive 2006/43/ECC in May 2006. Although this regulation is less comprehensive than SOX in the US, there is is a substantial overlap, which is why it is sometimes referred to as ‘European SOX’ (Tiron-Tudor & Boţa-Avram, Citation2013). The regulation was further strengthened and expanded in 2014 by Directive 2014/56/EU and the Audit Regulation No 537/2014. To assess the effectiveness of European SOX, it is of interest to know whether it has curbed earnings management in a similar way as SOX in the US. Therefore, our research question is whether the ZE earnings discontinuity in earnings distributions has similarly declined and disappeared in Europe after implementation of European SOX.
To answer this research question, it is necessary to analyse the changes of the discontinuity over time in detail. As Gilliam et al. (Citation2015) note, it is the combination of a consistent kink before SOX and the permanent disappearance afterwards that suggests a potential causal effect of SOX: ‘we find evidence of a zero-earnings discontinuity in every year from 1976 through 2002 but one [..] and no evidence of a discontinuity in any year from 2003 through 2012’ (Gilliam et al., Citation2015, p. 118). However, the SOX effect is still controversial, as other studies find a gradual decline of the ZE kink in the US already in the second half of the 1990s, which could be due to changes in the listing requirements of the NYSE (Dechow et al., Citation2003, p. 379) or a technical effect of a changing sample composition due to newly listed internet companies (Chardonnens et al., Citation2022). This gradual decline before 2002 cannot have been caused by SOX, so it is important not only to compare pooled data before and after SOX, but to accurately track the development of the kink over the years.
We compare the development of the kink in Europe and the US on a year-by-year basis from 1988 to 2019, where we control for differences in the industry composition between Europe and the US by using a matched industry approach. In this way we reproduce the results of Gilliam et al. (Citation2015) for a US sample that is structurally similar to our European sample. We test whether a structural break in the time series of the kink in Europe occurred when the European SOX directive of 2006 and the audit regulation of 2014 were implemented. Since Europe is not a homogeneous unity, we also examine the change of the kink on the level of individual European countries. Based on factors that have been shown in the literature to be associated with the extent of the kink, we analyse whether these relationships remained stable or changed significantly after European SOX.
Our year-by-year analysis of the ZE discontinuity shows a significant difference between the US and Europe: While the discontinuity in the US has gradually declined and eventually disappeared, it has remained stable in Europe and is, therefore, still substantial. The implementation of Directive 2006/43/EC in 2008 and of Regulation No 537/2014 in 2016 does not seem to have had an impact on the kink. Similar to the situation before European SOX, the kink afterwards tends to be smaller in common law countries and more pronounced in countries with a high degree of uncertainty avoidance and a stronger long-term orientation. The stability of these relationships confirms the overall finding that European SOX has not pushed back loss-avoidance behavior.
Our contribution is to analyse whether the ZE discontinuity has disappeared after European SOX, adding to the evidence on the effects of SOX-related regulations in different legislations. We find a clear difference to the US, which could be due to the fact that SOX in the US is more comprehensive, including strict rules for internal controls and personal accountability of executive managers. Our cross-country results suggest that another reason may be that the practice of income smoothing and avoiding reporting losses is rooted in cultural characteristics such as the way uncertainty is dealt with.
The remainder of the paper proceeds as follows. Section 2 gives an overview of related literature on the ZE discontinuity. Section 3 summarizes the European SOX regulations and develops our hypotheses. Sections 4 and 5 describe our data and methods, respectively. Section 6 presents our empirical results. We first show evidence for Europe as a whole and then analyse changes on the country level after implementation of European SOX.
2. Literature review
In this section, we review the literature on the ZE discontinuity while leaving out studies that apply discretionary accrual models. The distributional approach and the accrual approach rest on different assumptions that cannot easily be reconciled.Footnote2
A first group of previous studies analyses the discontinuity by combining all observations from the sample period into one distribution, thus excluding the question of how the kink has changed. Early evidence of Daske et al. (Citation2006) for an EU sample from 1986 to 2001 shows that the discontinuity is ‘much more pronounced in the EU compared to the US’ (p. 137). Within Europe, the discontinuity in the UK is similar to the US, while it is more pronounced in continental Europe. The differences across Europe prevail ‘despite the various EU harmonization efforts that have taken place’ (p. 137). The results are less clear in Glaum et al. (Citation2004) who find that firms in Germany and the US show a similarly strong tendency to avoid small losses in the period from 1991 to 2000. For an EU sample from 1997 to 2003, Burgstahler et al. (Citation2006) find higher levels of earnings management in weak legal systems and in private firms. For UK firms from 1989 to 1998, Gore et al. (Citation2007) document a link between discontinuities and potentially managed working capital accruals. For the period from 2003 to 2015, Haga et al. (Citation2019) study a sample of 47 countries from 2003 to 2015 and show that the extent of the ZE discontinuity is positively associated with the long-term orientation of a country.
A second group of studies examines the change of the ZE discontinuity around the adoption of IFRS. Callao and Jarne (Citation2010) find that in eight of 11 EU countries the kink is more pronounced in 2005/2006 (after IFRS became mandatory) than in 2003/2004. However, due to the short sample period, it is not possible to derive an overall trend comparable to the one reported by Gilliam et al. (Citation2015).Footnote3 Trimble (Citation2018) examines the ZE discontinuity in a sample of 46 developed and developing countries (the US is not included) from 1997 to 2013, comparing pre-IFRS distributions (combined observations from 1997 to 2004) with post-IFRS distributions (combined observations from 2005 to 2013) for (1) EU and non-EU samples, (2) low- and high-enforcement samples and (3) common and code law samples. The results show that the discontinuity declines in both EU and non-EU countries, suggesting that the pattern found in Gilliam et al. (Citation2015) for the US may apply more generally. However, based on the distributions of the pooled observations over eight years before and after the adoption of IFRS, it is not possible to assess whether the kink declined abruptly or gradually over time. Only a sharp decline would be consistent with a causal effect of IFRS (Atanasov & Black, Citation2016).
3. Relevant regulations and hypotheses development
3.1. European SOX
Four years after SOX had been adopted in the US, the EU established its own set of rules for audits, public oversight of audits and investor protection, sometimes referred to as ‘European SOX’ (Tiron-Tudor & Boţa-Avram, Citation2013). Directive 2006/43/EC of May 2006, which had to be adopted by member states until June 2008, revised and expanded existing regulations for audits of annual and consolidated financial statements.Footnote4 An objective of the new directive was to clarify the duties of statutory auditors and the criteria of their independence. For example, auditors were newly required to separately disclose the fees charged for auditing, assurance services, tax advisory and other non-audit services. Another objective of the reform was to establish public oversight of the auditing profession and to ensure external quality assurance of audit and financial reporting processes. In particular, member states are required to approve and register auditors and to establish a system of public oversight that ensures the application of international auditing standards and adequate internal quality control systems. Public-interest entities (PIEs), which are companies with listed equity or debt instruments, are required to establish an audit committee. Its main responsibilities are to select the auditor, ensure the independence of the auditor, monitor the financial reporting process and oversee the internal control and risk management systems.Footnote5
In April 2014, Directive 2006/43/EC was amended by Directive 2014/56/EU. At the same time, new regulations for PIEs were introduced in Regulation No 537/2014, which had to be applied from June 2016.Footnote6 The four objectives of this reform were to enhance transparency for investors, further strengthen auditor independence, stimulate competition in the market segment of large mandates (dominated by the ‘big four’ audit firms), and strengthen oversight of cross-border activities of audit firms (European Union, Citation2022). The new requirements for PIEs include the mandatory rotation of audit firms after a maximum of ten years and a tender process for the selection of the new auditor.
The regulation also contains a list of services that audit firms are not allowed to provide to PIEs, including certain advisory and valuation services. In practice, this means that the joint provision of audit services and most types of non-audit services is prohibited (Castillo-Merino et al., Citation2020). However, activities that are part of audits in accordance with international auditing standards remain permissible. This includes the evaluation of the audited company's internal controls including the risks of the internal control system and the effectiveness of the internal auditing processes.
In 2022, the EU published a comprehensive report comparing the implementation of the audit reform of 2014 in the member states. The study concludes that ‘the reform effectively increased levels of independence but did not impact competition as intended. The switch across different types of auditors has been limited, with a persistently high market share for the Big Four’ (European Union, Citation2022, p. 6).
3.2. Hypotheses
The outlined audit regulations in the EU are similar to the corresponding rules introduced by SOX in the US. A remaining difference is that SOX places more emphasis on tests of internal controls and personal accountability of the principal executive and financial officers of the company. According to Section 404 of SOX in the US, management must assess the effectiveness of the internal control system annually and report on the results.Footnote7 The evaluation of this management assessment is part of the external audit. Section 302 requires the principal officers, typically the CEO and CFO, to attest that the reported financial statements are materially correct and not misleading, with severe penalties for misstatements. These regulations are stricter than requirements for internal control and personal accountability in the EU.
Despite this difference, Directive 2006/43/EC (amended by Directive 2014/56/EU) and Regulation No 537/2014 have strengthened independent audits and public oversight of auditors in a comparable way to the US.Footnote8 Therefore, we hypothesize that earnings management in the EU has decreased similarly to the US:
Hypothesis 1: The ZE discontinuity in Europe significantly declined after implementation of Directive 2006/43/EC in 2008 (‘European SOX’) and eventually disappeared after implementation of Regulation No 537/2014 in 2016.
Consistent with this expectation, we also expect country differences to become smaller after adoption of European SOX. Previous literature has identified variables that are associated with the extent of the ZE discontinuity in various countries. It tends to be smaller in common law countries than in code law countries (Daske et al., Citation2006; Leuz et al., Citation2003; Trimble, Citation2018) and in countries with strict enforcement and high reporting quality requirements (Burgstahler et al., Citation2006; Trimble, Citation2018). Moreover, it seems to be positively associated with cultural dimensions of Hofstede et al. (Citation2010). Therefore, our second hypothesis is:Footnote9
Hypothesis 2: The cross-country association of the ZE discontinuity with characteristics such as legal system, enforcement of corporate transparency and cultural dimensions significantly declined after implementation of Directive 2006/43/EC in 2008 (‘European SOX’).
4. Data and descriptive statistics
We use Worldscope data from LSEG Datastream (formerly Refinitiv Datastream) from 1988 to 2019 for the US and the European Union (EU)Footnote10 extended to the EFTA states that have signed the Agreement on the European Economic Area (Iceland, Liechtenstein and Norway). We exclude firms operating in regulated industries and financial institutions with SIC codes ranging from 4400 to 5000 and from 6000 to 7000.Footnote11 Following previous research, we remove observations with a net income of exactly zero (58 firm-years in the European sample and 13 firm-years in the US sample).Footnote12 We also remove firm-years with insubstantial sales, which we define as total sales of less than 2 million USD. Since these firms inevitably report losses, they could distort our loss avoidance measures (see Chardonnens et al., Citation2022).
We also apply a filter for firms with negligible market capitalization. In finance practice, stocks with a market capitalization of less than 50 million USD are classified as ‘nano caps’ or ‘penny stocks’ (compared to micro caps, small caps, large caps and blue chips). These stocks are typically traded in OTC markets and are considered highly speculative investments not only in terms of return fluctuations but also in terms of potential market manipulations. Penny stocks are numerous in the Worldscope database because of its broad coverage of OTC markets, but they are not of interest to typical institutional or private investors. Therefore, we require a market capitalization level in 2019 of 50 million USD and deflate this number by 3% per year such that the minimum requirement in 1988 is 20 million USD.Footnote13 To ensure a minimum size regardless of market fluctuations, we apply the same threshold (20 million USD in 1988 to 50 million USD in 2019) to total assets. The remaining firms represent more than 99% of the overall market capitalization and 69.3% (74.6%) of firm-years in the European (US) sample.
Our final filter is to remove firm-years with an absolute value of net income (scaled by total assets) or operating cash flow less depreciation and amortization (scaled by total assets) higher than 50%. This removes 6.9% of firm-years from the European sample and 3.5% of firm-years from the US sample. These outlier observations are not included in the main analyses. It is important to note that the outlier correction does not affect our empirical analysis of the ZE discontinuity but only serves to report meaningful descriptive statistics in . Our final sample contains 65,052 firm-years for the US and 50,625 firm-years for Europe. US firms tend to have a larger market capitalization (MCap) than European firms. The difference is small for total assets, and the distributions of earnings are similar in both samples.
Table 1. Descriptive statistics for the US and European samples.
5. Methods
5.1. Discontinuity measure
The most commonly used discontinuity measure, the standardized differences test statistic, is based on the frequency distribution of scaled earnings for a specific interval width. Let i denote ordered intervals such that i = 1 is the interval of the lowest profits, i = 2 is the interval for the next range of profits, i = −1 is the interval of the lowest losses and i = −2 is the next loss interval. Additionally, let denote the number of observations in interval i, let N denote the total number of observations in the sample and let
denote the proportion of observations falling in interval i. The standardized differences test statistic is then defined as the standardized difference between the actual number of observations in interval i and the expected number of observations assuming no discontinuity (Burgstahler & Dichev, Citation1997):
(1)
(1) where
is the standard error of the difference:
(2)
(2) In the presence of a ZE discontinuity,
will be negative and
will be positive.
A disadvantage of the SD statistic is that it increases as the sample size increases. This blending of the effect size and test power is undesirable in comparisons over time when the sample size varies. Specifically, when the sample size is small in early years, the SD statistic will underestimate the potential decline in the discontinuity. Another critical aspect is that the expected frequency is defined as the average frequency of the adjacent intervals. When these in turn are distorted, the statistic is difficult to interpret.
For these reasons, we use the modified measure proposed by Chardonnens et al. (Citation2022), which is based on a kernel density estimation inspired by Lahr (Citation2014). We choose a standard Gaussian estimator for scaled earnings ranging from to 0.15.Footnote14 The measure ‘small loss deviation’ is defined as
(3)
(3) where
is the actual number of observations in the first loss interval and
is the expected number according to the kernel density estimation (integral over the first loss interval). The ‘small profit deviation’ is analogously defined as
(4)
(4) where subscript 1 represents the first profit interval.
Following Gilliam et al. (Citation2015), we consider interval widths of 0.005 and 0.015. In the case of 0.015, the actual observations of the first three loss and profit intervals of width 0.005 are compared to the expected value according to the kernel density over the same range.
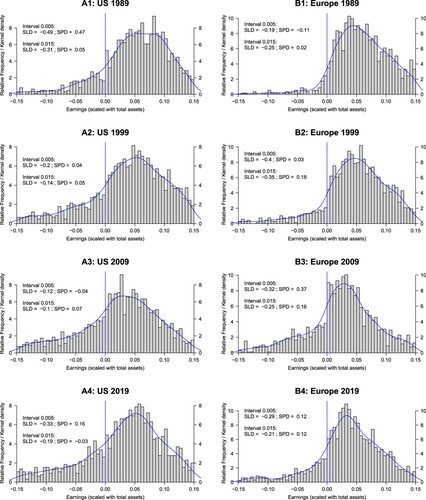
shows examples of frequency distributions and kernel densities (blue lines) for the US (left column) and Europe (right column) and reports the corresponding small loss deviations (SLD) and small profit deviations (SPD).
Figure 1. Frequency distributions and kernel densities for scaling with total assets.
The distributions are shown for four years spread over the sample period. Left graphs: sample of US firms; right graphs: sample of European firms. Vertical line at zero scaled earnings. Earnings are scaled with total assets at the beginning of the year. A bar in the diagram represents a width of 0.005. SLD: small loss deviation; SPD: small profit deviation.
5.2. Matched industry samples
To address the possibility that the comparison between Europe and the US is distorted by different industry structures (e.g. Gaio, Citation2010), we follow Ball and Shivakumar (Citation2005) and construct a matched sample based on the first two digits of the SIC code and market capitalization.Footnote15 For each year-industry combination, we first identify the subsample with the smaller number of observations (the US or Europe). We match these observations with observations from the other subsample (without replacement) based on market capitalization using the nearest neighbor method. Over the whole sample period, 42,865 observations of both subsamples are matched, which means that 22,187 US firm-years and 7,760 European firm-years are discarded.
5.3. Time-series and cross-country regressions
Following Enomoto and Yamaguchi (Citation2017), we test whether the ZE discontinuity decreased after European SOX (Directive 2006/43/EC) by running a time-trend regression with a potential shift at the time when the regulation came into effect (year 2008). We allow for an additional shift when Audit Regulation No 537/2014 came into force (year 2016). This leads to the following regression model:
(5)
(5) where
is our discontinuity measure –either SLD or SPD– for the European sample as a whole in year t, Time is the distance to the beginning of the sample period (1988) in years,
is a dummy variable equal to one for years from 2008 to 2019 and 0 otherwise, and
is a dummy variable equal to 1 for years from 2016, when the Audit Regulation (AR) No 537/2014 was implemented, and 0 for earlier years. According to Hypothesis 1, we expect to find positive (negative) coefficients
and
for SLD (SPD) as dependent variable, indicating that the ZE discontinuity has decreased after European SOX and the later audit regulation. We also estimate these regressions for the US sample. In this case, the dummy variable
is equal to 1 for years from 2003 to 2019, and variable
is removed from the regression.
On the individual country level, it is not possible to estimate the kink on an annual basis. Therefore, we divide the sample period into subperiods before and after European SOX (1988–2007; 2008–2019) and pool the country-level observations in each subperiod into one group for which we measure the small loss deviation SLD using an interval width of 0.015.
To formally test for differences between the two periods, we estimate the following regression model:
(6)
(6) where
,
,
and
are regression coefficients,
is a dummy variable equal to 1 for observations from the second period and 0 otherwise, and Var is the variable of interest hypothesized to explain part of the variation of SLD. Coefficient
captures a change in the overall level of the kink after European SOX, and the interaction-term coefficient
indicates the corresponding change in the slope coefficient. According to Hypothesis 2, we expect to obtain significant coefficients
with the opposite sign of
.
For the explanatory variable, we consider country characteristics that have been shown in previous literature to be related to earnings management. Leuz et al. (Citation2003, p. 506) ‘focus on investor protection as a significant determinant of earnings management activity around the world’. They ‘argue that strong and well-enforced outsider rights limit insiders’ acquisition of private control benefits, and consequently, mitigate insiders' incentives to manage accounting earnings because they have little to conceal from outsiders”. Country clusters by investor protection ‘closely parallel simple code-law and common-law […] characterizations’ (Leuz et al., Citation2003, p. 507).
Earnings management also has been found to be related to cultural dimensions of Hofstede et al. (Citation2010), namely a country's long-term orientation (Haga et al., Citation2019) and the strength of uncertainty avoidance (Han et al., Citation2010; Nabar & Boonlert-U-Thai, Citation2007).Footnote16 Uncertainty avoidance is expected to favor income smoothing to reduce earnings volatility, implying a tendency to turn small pre-managed losses into small profits.Footnote17 Reported losses could also challenge the perception of a stable, healthy and predictable company and thus create discomfort among stakeholders. Therefore, perceived uncertainty could be significantly greater for companies reporting small losses than for companies reporting small profits. This would mean that managers in countries with high uncertainty avoidance have a strong incentive to steer earnings into positive territory. Haga et al. (Citation2019) find that cultures with a long-term orientation also engage more than average in earnings management to avoid reporting losses, which could be explained by the aim of better representing the long-term profit potential. However, the direction of the relationship is not unambiguous (Haga et al., Citation2019, pp. 100f.).
Based on these considerations, we use the following proxy variables Var in regression model (Equation6(6)
(6) ): (1) Common Law: equal to 1 for the common law countries US and UK and 0 otherwise; (2) UAI: Uncertainty Avoidance Index of Hofstede et al. (Citation2010)Footnote18; (3) LTO: Long-Term Orientation Index of Hofstede et al. (Citation2010) in the updated version of the World Value Survey;Footnote19 (4) Shareholder Rights (SR): Shareholder Rights index on a scale from 0 (poor) to 10.5 (Doing Business Database, World Bank); (5) Corporate Transparency (CT): Corporate Transparency index on a scale from 0 (poor) to 9 (Doing Business Database, World Bank). Since changes over time are not available, all variables are assumed to be constant, which is a limitation of our study. While the characteristics are thought to be relatively stable, changes may have occurred in some countries during the sample period of more than 30 years.
Regression Equation6(6)
(6) requires a weighted least squares (WLS) estimation because the precision of discontinuity measures depends on the sample size.Footnote20 Therefore, we choose weights corresponding to the number of available observations in each country. For information, we will also show the results of OLS regressions.
6. Empirical results
6.1. Development of the ZE discontinuity before and after European SOX
shows the yearly estimates of SLD (blue crosses) and SPD (black circles) for the sample of US (left panels) and European firms (right panels). The upper and lower panels are based on interval widths of 0.005 and 0.015, respectively. in the Appendix reports the exact values.
Figure 2. Discontinuity measures for the US and Europe for scaling with total assets.
The discontinuity measures capture the share of excess observations (pos. sign) or missing observations (neg. sign) in the intervals of scaled earnings directly below and above the zero threshold. SLD: small loss deviation; SPD: small profit deviation. Earnings are scaled with total assets at the beginning of the year.
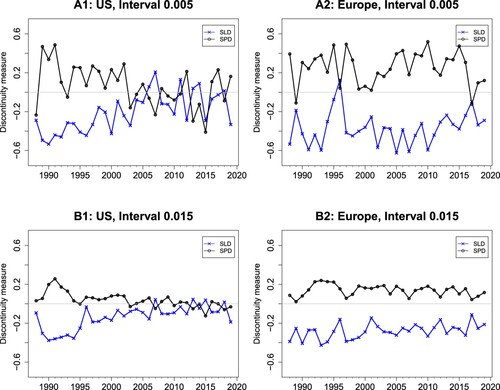
In the US sample, the ZE discontinuity for an interval width of 0.005 (Panel A1 in Figure ) is very pronounced at the beginning of the sample period in 1988, but it diminishes in the following years. From 2004, the lines for SLD and SPD fluctuate around zero. For the interval of 0.015, we observe the same decline until the kink disappears in approximately the year 2007 (Panel B1).
The time pattern is clearly different in the European sample (Panels A2 and B2). The gap between the upper line for SPD and the lower line for SLD signifies a pronounced ZE discontinuity over the whole sample period. On average, 28.1% of the expected number of small losses for interval 0.015 is missing. The gap tends to be even more pronounced for the interval of 0.005, where on average, 37.0% of expected small losses are missing. in the Appendix confirms the statistical significance of these results: the standardized difference for interval 0.015 is significantly negative in every year and
is significantly positive in most years. Therefore, compared to the US, the kink in the European sample is relatively stable over time.
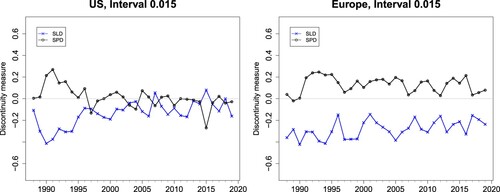
shows the discontinuity results for the matched sample (interval width 0.015). The results are very similar to the previous results for the full sample: In Europe, the ZE discontinuity is present over the whole sample period, while it has disappeared in the US.
Figure 3. Results for matched industry samples.
Discontinuity measures analogous to Panels B1 and B2 in Figure (interval width 0.015). SLD: small loss deviation; SPD: small profit deviation.
Consistent with and , the estimates of regression model (Equation5(5)
(5) ) in show a significant base level (intercept) of the ZE earnings discontinuity in the US and in Europe, but for the European sample no significant time trend. Contrary to Hypothesis 1, there is no evidence of a significant decrease of the ZE discontinuity in Europe after European SOX.
Table 2. Results of time-series regressions.
For the US, three of the four time-trend coefficients are significant on the 10% level, and the magnitude of the coefficients is consistent with the disappearance of the ZE discontinuity. The SOX dummy variable, however, is not significant. One reason for this result may be that the time trend does not seem to be linear (see and ). A significant part of the decrease occurred already in the second half of the 1990s, which is consistent with the findings of Dechow et al. (Citation2003). Therefore, the incremental effect of SOX on the ZE discontinuity in the US is debatable (Chardonnens et al., Citation2022) and difficult to measure precisely. Since we are mainly interested in the effect of European SOX, we do not analyse this question further.
We conduct the following robustness checks. Our results are confirmed when earnings are scaled by the market value of equity instead of by total assets.Footnote21 For this alternative scaling, we show a replication of in in the Appendix. To test whether our results are driven by stocks with very small market capitalization (‘micro caps’), we double the minimum market capitalizations (20 to 50 million USD; see Section 4) and obtain similar results. This is also the case when using net income before extraordinary items as our earnings measure.
6.2. Cross-country analysis before and after European SOX
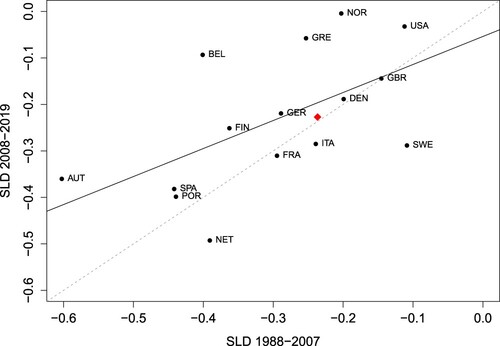
compares the country values for SLD before and after European SOX (1988–2007 and 2008–2019).Footnote22 The positive correlation indicates continued loss-avoidance behavior. The regression of SLD in period 2 on SLD in period 1 provides a slope coefficient of 0.60 (significant at the 5% level) and an of 0.33 (solid line in ). Consistent with our previous results, Europe as a whole is positioned close to the 45 degree line, while the US is clearly above, which means that SLD in the US declined in the second period from an already low level of the first period.Footnote23
Figure 4. Comparison of small loss avoidance before and after European SOX.
SLD is the small loss deviation for an interval width of 0.015. The solid line is the regression line, the dashed line is the 45 degree line. The red diamond indicates the weighted average of the European countries (with the number of observations as weights). The country codes are defined in in the Appendix.
The estimation results for regression model (Equation6(6)
(6) ) are shown in . In the following, we focus on the WLS results in Panel B, but the OLS results in Panel A confirm the main findings.
Table 3. Results of cross-country regressions.
For Common Law as explanatory variable, the intercept is significantly negative, indicating a pronounced average kink (SLD = −0.29) in code law countries in the first period. The kink is only half as strong in common law countries, as indicated by the positive slope coefficient of 0.15. The third and fourth coefficients are small and not statistically significant, which means that we cannot reject the null hypothesis that the level and slope coefficients remain the same after European SOX.
Before European SOX, the extent of the discontinuity is positively associated with Hofstede's Uncertainty Avoidance Index UAI and Long-Term Orientation LTO. These relationships remain unchanged in the second period, as indicated by the small coefficients of the interaction terms and
. The proxy variables for investor protection and corporate transparency are only weakly associated with our discontinuity measure (10% significance level), again without significant changes after European SOX.
The regression results in are based on all sample countries. As a robustness check, to account for the different timing of SOX and European SOX, we repeat the analysis without the US and find very similar results. The results are also confirmed when SPD is used as the dependent variable instead of SLD.
For illustrative purposes, we plot the UAI- and LTO-regressions in . The left graphs show the scatterplot and regression line before European SOX, the right graphs after European SOX.
Figure 5. Relationship of small loss avoidance with UAI and LTO.
Upper panels: UAI, lower panels: LTO. Left graphs cover the subperiod before European SOX (1988–2007), the right graphs cover the subperiod after European SOX (2008–2019). SLD is the small loss deviation for an interval width of 0.015 based on pooled data of the respective period. UAI is the Uncertainty Avoidance Index, LTO is Long-Term Orientation. The blue solid line (black dashed line) is the WLS (OLS) regression line. The red diamond indicates the weighted average of the European countries (with the number of observations as weights). The country codes are defined in in the Appendix.
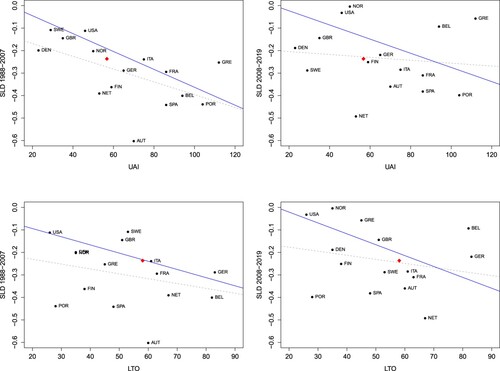
With respect to the origin of local accounting (see Daske et al., Citation2006), a general trend can be identified from the upper left graph in : Countries with British (UK, US) or Scandinavian accounting origin (DEN, FIN, NOR, SWE) tend to have low UAI and low loss avoidance, countries from the German accounting system (AUT, GER) tend to be found in the middle, and countries associated with the French accounting system tend to have high UAI and a strong ZE discontinuity (BEL, FRA, GRE, ITA, NET, POR, SPA). The lower left graph shows a similar relationship of loss avoidance with LTO, with the US being the most short-term oriented and Germany the most long-term oriented country. On average, the European countries have higher UAI and LTO and show a stronger discontinuity than the US, which is consistent with the results in Section 6.1 (see the red diamond in for Europe as a whole).
After European SOX, the country-specific SLD measure is more dispersed (right graphs in ) because the measured kink has changed significantly in some small countries, in particular in Belgium and Greece. These two countries had a pronounced kink before and a much smaller kink after European SOX, which are by far the largest changes in the sample. Because of the small number of observations near the zero earnings threshold, it is difficult to assess whether the changes in these countries are real or are partly due to measurement error. This again shows why a WLS estimation is required.
7. Conclusion
Motivated by the finding of Gilliam et al. (Citation2015) that the ZE discontinuity in the US disappeared around the time SOX was implemented, we examine whether a similar change occurred when the EU established its own set of rules for audits, public oversight of audits and investor protection in Directive/43/EC (European SOX) and Regulation No 537/2014. Our sample covers the US and the EU (extended to the EFTA states Iceland, Liechtenstein and Norway) from 1988 to 2019. Our main finding is that the ZE discontinuity in Europe did not shift or even disappear when these reforms were adopted. The discontinuity has remained stable and is still substantial. It is more pronounced in code law countries than in common law countries and in countries with high uncertainty avoidance and long-term orientation. These relationships are nearly identical before and after European SOX.
We propose two possible reasons why our results differ from those in the US. One explanation could be that European SOX has been less effective in pushing back earnings management, because the reform has been less stringent and comprehensive than in the US. In particular, it does not contain provisions equivalent to Sections 404 and 302 of SOX on internal control and management accountability. A second reason is that incentives for companies to avoid losses may be stronger in Europe than in the US. Our results suggest that such incentives may be rooted in cultural differences. In particular, a high degree of uncertainty avoidance could lead to income smoothing with the aim of reporting positive earnings with low variance. Over time, this practice proves to be expectation-building, so that investors might interpret reported losses negatively, inferring that the company was unable to manage earnings upwards beyond the zero threshold. This interpretation would reinforce the initial incentive to avoid losses. Professional financial analyses could counter this expectation, but coverage of stocks by financial analysts is generally lower in Europe than in the US. Future research could try to uncover the reasons for the different results in Europe and the US in more detail. It would also be interesting to further investigate the relationship between uncertainty avoidance, financial analyst coverage and loss avoidance.
Our contribution is to show that the ZE discontinuity in Europe persists after European SOX, in contrast to the results of Gilliam et al. (Citation2015) for SOX in the US. Our findings should be of interest to regulators, investors and researchers with their different perspectives on earnings management. Regulators in Europe need to know whether there is still discretion in financial reporting and to what extent it is used to avoid reporting losses. They also need to ensure that the accuracy of financial reporting in Europe does not fall behind the level in the US. Apart from European SOX, IFRS adoption could also have led to a reduction of earnings management over time, so that its effect would coincide with a possible effect of European SOX. According to our results, however, neither IFRS adoption nor European SOX have significantly reduced the kink. This should be taken into account when evaluating past accounting and auditing reforms. Investors confronted with our results will interpret small gains with caution and check whether there is further evidence of earnings management. Finally, researchers have long studied earnings management. Nevertheless, our results suggest that the ZE earnings discontinuity deserves further attention as it is still one of the clearest indicators of earnings management in Europe that can provide useful information about the constraints and incentives of accounting practices.
Acknowledgments
We thank the editor-in-chief Andrei Filip and two anonymous reviewers for their very valuable comments and suggestions.
Disclosure statement
No potential conflict of interest was reported by the author(s).
Notes
1 See, e.g. Degeorge et al. (Citation1999), Dechow et al. (Citation2003), Leuz et al. (Citation2003), Burgstahler and Eames (Citation2006), and Burgstahler and Chuk (Citation2017). Measures of small loss avoidance are among the proxies for earnings quality in the review of Dechow et al. (Citation2010) in their Sections 3.1.4 and 3.1.5.
2 A disadvantage of using accrual models for our purpose is that the decomposition of total accruals into normal and discretionary accruals is associated with high standard errors that make it almost impossible to recognize a small step over the ZE threshold.
3 Another important difference is the interval width. To ensure a sufficient number of observations near the ZE threshold, the authors choose a wide interval width of 4 percentage points ROA compared to 0.5 and 1.5 percentage points in Gilliam et al. (Citation2015).
4 In the following, we use the term ‘European SOX’ as shorthand for this audit Directive 2006/43/EU. The term is not intended to suggest that this regulation is comparable to SOX in every respect.
5 For a more detailed summary of the directive, see Sener (Citation2010).
6 For the origin of the reform, see Quaglia (Citation2014) and Gros and Worret (Citation2016).
7 See in more detail Verdoes et al. (Citation2022). Arping and Sautner (Citation2013) identify the effect of Section 404 by comparing cross-listed and non-cross-listed firms and find that it has increased corporate transparency.
8 In the words of Sener (Citation2010, p. 143), referring to the 2006 reform:
The EU has adopted provisions that are very similar to those of the SOX considering the fact that the same problems may arise regarding its publicly traded companies. Both pieces of legislation aim to make companies disclose accurate and reliable financial statements. They consider the independence of auditors as being fundamental for investors, creditors, employees and other stakeholders in public companies.
9 In contrast to Hypothesis 1, we cannot distinguish here between the change of the ZE discontinuity after implementation of Directive 2006/43/EC in 2008 and Regulation No 537/2014 in 2016, as the period from 2016 to 2019 is too short to accurately measure the relation of the ZE discontinuity with country characteristics.
10 The United Kingdom (UK) is included since it was part of the EU during our sample period.
11 See similarly, e.g. Beaver et al. (Citation2007), Brown and Caylor (Citation2005), Burgstahler and Dichev (Citation1997), Chen et al. (Citation2010), Durtschi and Easton (Citation2005), Durtschi and Easton (Citation2009), Gilliam et al. (Citation2015), Haga et al. (Citation2019), Kerstein and Rai (Citation2007), Roychowdhury (Citation2006) and Makarem et al. (Citation2018).
12 See Burgstahler and Dichev (Citation1997), Gilliam et al. (Citation2015), Dechow et al. (Citation2003), Beaver et al. (Citation2007), Burgstahler and Eames (Citation2006), and Lahr (Citation2014).
13 A value of 50 million USD in 2019 corresponds approximately to the 0.5th percentile of the market capitalization of NYSE stocks. Fama and French (Citation2008) use the 20th NYSE percentile to define micro caps. This shows that we still include very small firms.
14 The density is estimated at 512 equally spaced points. We implement the estimation in R (‘density’ function) with the bandwidth proposed by Scott (Citation1992) (option bw.nrd in R).
15 Matched samples are commonly used in prior literature; see, e.g. Barth et al. (Citation2008).
16 Empirically, these characteristics are related. For example, the US and the UK have low uncertainty avoidance, and both are common law countries with strong investor protection.
17 See Daske et al. (Citation2006, p. 138): ‘we find that income smoothing is significantly related to reporting positive earnings’.
18 We subtract 50 from Hofstede's index so that the regression intercept corresponds to the fitted SLD value at UAI of 50 (middle of the UAI scale).
19 We subtract 50 from Hofstede's index so that the regression intercept corresponds to the fitted SLD value at LTO of 50 (middle of the LTO scale).
20 For the standardized difference measure SD, this can be seen from Equation (Equation2(2)
(2) ) which shows that the variance
is proportional to 1/N, so the inverse of the variance is proportional to N. It is reasonable to assume that this is also a good approximation for our modified kernel-based measure SLD.
21 Dechow et al. (Citation2003) and Durtschi and Easton (Citation2005, Citation2009) show that the deflator can significantly affect the observed discontinuity.
22 in the Appendix reports the exact values.
23 Because of the averaging over time, the downward trend in the US is less visible here than in Section 6.1. In particular, the average US value of SLD in the first period is already affected by the downward trend.
References
- Arping, S., & Sautner, Z. (2013). Did SOX section 404 make firms less opaque? Evidence from cross-listed firms. Contemporary Accounting Research, 30(3), 1133–1165. https://doi.org/10.1111/care.2013.30.issue-3
- Atanasov, V. A., & Black, B. S. (2016). Shock-based causal inference in corporate finance and accounting research. Critical Finance Review, 5, 207–304. https://doi.org/10.1561/104.00000036
- Ball, R., & Shivakumar, L. (2005). Earnings quality in UK private firms: Comparative loss recognition timeliness. Journal of Accounting and Economics, 39(1), 83–128. https://doi.org/10.1016/j.jacceco.2004.04.001
- Barth, M. E., Landsman, W. R., & Lang, M. H. (2008). International accounting standards and accounting quality. Journal of Accounting Research, 46(3), 467–498. https://doi.org/10.1111/joar.2008.46.issue-3
- Bartov, E., & Cohen, D. A. (2009). The “numbers game” in the pre-and post-Sarbanes-Oxley eras. Journal of Accounting, Auditing & Finance, 24(4), 505–534. https://doi.org/10.1177/0148558X0902400401
- Beaver, W. H., M. F. McNichols, & Nelson, K. K. (2007). An alternative interpretation of the discontinuity in earnings distributions. Review of Accounting Studies, 12(4), 525–556. https://doi.org/10.1007/s11142-007-9053-0
- Brown, L. D., & Caylor, M. L. (2005). A temporal analysis of quarterly earnings thresholds: Propensities and valuation consequences. The Accounting Review, 80(2), 423–440. https://doi.org/10.2308/accr.2005.80.2.423
- Burgstahler, D. C., & Chuk, E. (2017). What have we learned about earnings management? Integrating discontinuity evidence. Contemporary Accounting Research, 34(2), 726–749. https://doi.org/10.1111/care.2017.34.issue-2
- Burgstahler, D. C., & Dichev, I. (1997). Earnings management to avoid earnings decreases and losses. Journal of Accounting and Economics, 24(1), 99–126. https://doi.org/10.1016/S0165-4101(97)00017-7
- Burgstahler, D. C., & Eames, M. J. (2006). Management of earnings and analysts' forecasts to achieve zero and small positive earnings surprises. Journal of Business Finance and Accounting, 33(5-6), 633–652. https://doi.org/10.1111/jbfa.2006.33.issue-5-6
- Burgstahler, D. C., Hail, L., & Leuz, C. (2006). Importance of reporting incentives: Earnings management in European firms. The Accounting Review, 81(5), 983–1016. https://doi.org/10.2308/accr.2006.81.5.983
- Callao, S., & Jarne, J. (2010). Have IFRS affected earnings management in the European Union? Accounting in Europe, 7(2), 159–189. https://doi.org/10.1080/17449480.2010.511896
- Castillo-Merino, D., Garcia-Blandon, J., & Martinez-Blasco, M. (2020). Auditor independence, current and future NAS fees and audit quality: Were European regulators right? European Accounting Review, 29(2), 233–262. https://doi.org/10.1080/09638180.2019.1577151
- Chardonnens, P., Fiechter, P., & Wallmeier, M. (2022). The disappearance of the zero-earnings discontinuity: SOX, dotcom boom or gradual decline?. Finance Research Letters, 49, 103033. https://doi.org/10.1016/j.frl.2022.103033
- Chen, S. K., Lin, B. X., Wang, Y., & Wu, L. (2010). The frequency and magnitude of earnings management: Time-series and multi-threshold comparisons. International Review of Economics and Finance, 19(4), 671–685. https://doi.org/10.1016/j.iref.2010.02.005
- Cohen, D. A., Dey, A., & Lys, T. Z. (2008). Real and accrual-based earnings management in the pre-and post-Sarbanes-Oxley periods. The Accounting Review, 83(3), 757–787. https://doi.org/10.2308/accr.2008.83.3.757
- Daske, H., Gebhardt, G., & McLeay, S. (2006). The distribution of earnings relative to targets in the European Union. Accounting and Business Research, 36(3), 137–167. https://doi.org/10.1080/00014788.2006.9730019
- Dechow, P., Ge, W., & Schrand, C. (2010). Understanding earnings quality: A review of the proxies, their determinants and their consequences. Journal of Accounting and Economics, 50(2-3), 344–401. https://doi.org/10.1016/j.jacceco.2010.09.001
- Dechow, P. M., Richardson, S. A., & Tuna, I. (2003). Why are earnings kinky? An examination of the earnings management explanation. Review of Accounting Studies, 8(2/3), 355–384. https://doi.org/10.1023/A:1024481916719
- Degeorge, F., Patel, J., & Zeckhauser, R. (1999). Earnings management to exceed thresholds. Journal of Business, 72(1), 1–33. https://doi.org/10.1086/jb.1999.72.issue-1
- Durtschi, C., & Easton, P. (2005). Earnings management? The shapes of the frequency distributions of earnings metrics are not evidence ipso facto. Journal of Accounting Research, 43(4), 557–592. https://doi.org/10.1111/joar.2005.43.issue-4
- Durtschi, C., & Easton, P. (2009). Earnings management? Erroneous inferences based on earnings frequency distributions. Journal of Accounting Research, 47(5), 1249–1281. https://doi.org/10.1111/joar.2009.47.issue-5
- Enomoto, M., & Yamaguchi, T. (2017). Discontinuities in earnings and earnings change distributions after J-SOX implementation: Empirical evidence from Japan. Journal of Accounting and Public Policy, 36(1), 82–98. https://doi.org/10.1016/j.jaccpubpol.2016.11.005
- European Union (Ed.) (2022). Study on the audit directive (Directive 2006/43/EC as amended by directive 2014/56/EU) and the audit regulation (Regulation (EU) 537/2014): Final Report. Luxembourg: Publications Office of the European Union.
- Fama, E. F., & French, K. R. (2008). Dissecting anomalies. Journal of Finance, 63(4), 1653–1678. https://doi.org/10.1111/jofi.2008.63.issue-4
- Gaio, C. (2010). The relative importance of firm and country characteristics for earnings quality around the world. European Accounting Review, 19(4), 693–738. https://doi.org/10.1080/09638180903384643
- Gilliam, T. A., Heflin, F., & Paterson, J. S. (2015). Evidence that the zero-earnings discontinuity has disappeared. Journal of Accounting and Economics, 60(1), 117–132. https://doi.org/10.1016/j.jacceco.2014.07.001
- Glaum, M., Lichtblau, K., & Lindemann, J. (2004). The extent of earnings management in the U.S. and Germany. Journal of International Accounting Research, 3(2), 45–77. https://doi.org/10.2308/jiar.2004.3.2.45
- Gore, P., Pope, P. F., & Singh, A. K. (2007). Earnings management and the distribution of earnings relative to targets: UK evidence. Accounting and Business Research, 37(2), 123–149. https://doi.org/10.1080/00014788.2007.9730065
- Gros, M., & Worret, D. (2016). Lobbying and audit regulation in the EU. Accounting in Europe, 13(3), 381–403. https://doi.org/10.1080/17449480.2016.1255343
- Haga, J., Huhtamäki, F., & Sundvik, D. (2019). Long-term orientation and earnings management strategies. Journal of International Accounting Research, 18(3), 97–119. https://doi.org/10.2308/jiar-52501
- Han, S., Kang, T., Salter, S., & Yoo, Y. K. (2010). A cross-country study on the effects of national culture on earnings management. Journal of International Business Studies, 41(1), 123–141. https://doi.org/10.1057/jibs.2008.78
- Hofstede, G., Hofstede, G. J., & Minkov, M. (2010). Cultures and organizations: Software of the mind (3rd ed.). Mcgraw-Hill New York.
- Kerstein, J., & Rai, A. (2007). Intra-year shifts in the earnings distribution and their implications for earnings management. Journal of Accounting and Economics, 44(3), 399–419. https://doi.org/10.1016/j.jacceco.2007.04.004
- Lahr, H. (2014). An improved test for earnings management using kernel density estimation. European Accounting Review, 23(4), 559–591. https://doi.org/10.1080/09638180.2013.860044
- Leuz, C., Nanda, D., & Wysocki, P. D. (2003). Earnings management and investor protection: An international comparison. Journal of Financial Economics, 69(3), 505–527. https://doi.org/10.1016/S0304-405X(03)00121-1
- Lobo, G. J., & Zhou, J. (2006). Did conservatism in financial reporting increase after the Sarbanes-Oxley Act? Initial evidence. Accounting Horizons, 20(1), 57–73. https://doi.org/10.2308/acch.2006.20.1.57
- Lobo, G. J., & Zhou, J. (2010). Changes in discretionary financial reporting behavior following the Sarbanes-Oxley Act. Journal of Accounting, Auditing and Finance, 25(1), 1–26. https://doi.org/10.1177/0148558X1002500101
- Makarem, N., Hussainey, K., & Zalata, A. (2018). Earnings management in the aftermath of the zero-earnings discontinuity disappearance. Journal of Applied Accounting Research, 19(3), 401–422. https://doi.org/10.1108/JAAR-03-2017-0047
- Nabar, S., & Boonlert-U-Thai, K. (2007). Earnings management, investor protection, and national culture. Journal of International Accounting Research, 6(2), 35–54. https://doi.org/10.2308/jiar.2007.6.2.35
- Quaglia, L. (2014). The European Union and global financial regulation. Oxford University Press.
- Roychowdhury, S. (2006). Earnings management through real activities manipulation. Journal of Accounting and Economics, 42(3), 335–370. https://doi.org/10.1016/j.jacceco.2006.01.002
- Scott, D. (1992). Multivariate density estimation: Theory, practice, and visualization. John Wiley & Sons.
- Sener, Z. (2010). Effect of the Sarbanes-Oxley Act of 2002 on the EU law regarding auditors and auditors' independence. Business Law International, 11(2), 133–143.
- Tiron-Tudor, A., & Boţa-Avram, C. (2013). European Union Directive: The 8th company law directive on disclosure and transparency. In S. O. Idowu, N. Capaldi, L. Zu, & A. D. Gupta (Eds.), Encyclopedia of corporate social responsibility (pp. 1097–1104). Springer.
- Trimble, M. (2018). A reinvestigation into accounting quality following global IFRS adoption: Evidence via earnings distributions. Journal of International Accounting, Auditing and Taxation, 33, 18–39. https://doi.org/10.1016/j.intaccaudtax.2018.09.001
- Verdoes, T., à Nijeholt, M. L., & Koster, H. (2022). Could the USA's SOX in-control regime serve as an example for EU member states?. European Company Law, 19(3), 73–81.
Appendix
Table A1. Discontinuity measures in the US and European samples.
Figure A1. Discontinuity measures for the US and Europe for scaling with the market value of equity.
The discontinuity measures capture the share of excess observations (pos. sign) or missing observations (neg. sign) in the intervals of scaled earnings directly below and above the zero threshold. SLD: small loss deviation; SPD: small profit deviation. Earnings are scaled with the market value of equity at the beginning of the year.
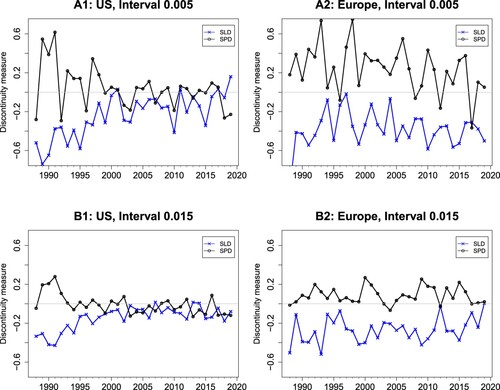
Table A2. Discontinuity measure and country characteristics before and after implementation of European SOX.