Abstract
Background Measured bone density correlates well with the mechanical properties of the bone. Our objective was to evaluate optical densitometry as a method of measuring the periprosthetic bone density of the tibial platform in total knee replacement using serial dual-energy X-ray absorptiometry (DXA) as the reference test.
Methods 30 patients who underwent a cemented total knee replacement were followed up for over 2 years. Standard radiographs of the knee were obtained at 12 and 24 months. These were photographed with a digital camera and enhanced with image processing software. A DXA scan was performed at the same time as the reference method. 3 regions of interest were defined under the tibial plateau (medial, lateral and stem positions).
Results After 24 months of follow-up there was a significant decrease in density in the 3 regions, both with the optical and DXA methods. The concordance between methods was studied using Bland and Altman plots, Cronbach's alpha and intraclass correlation coefficients resulted in values from 0.72 to 0.87, depending on the region and the follow-up time.
Interpretation Quantification of optical density values with a standardized measurement system on conventional radiographs is a reliable and efficient method of determining the bone mineral density.
▪
Failures of total knee replacement (TKR) are more common on the tibial side and they are related to alignment errors, with an unstable fixation or with a decrease in bone quality near the prosthesis (Li et al. Citation2000). The mineral density of trabecular bone is directly related to the mechanical properties and the quality of the bone; thus, the mechanical properties of the trabecular bone in the proximal part of the tibia are considered to be an important predictor of TKR failure.
Visual examination of radiographs is not sufficiently accurate to allow evaluation of bone loss, and it does not provide any way of quantifying that loss with the passage of time. Radiographs only reveal a large degree of reduction in bone mineral density (BMD), while the conventional densitometric study permits quantification of the bone loss (Robertson el al. Citation1994). Serial dual-energy X-ray absorptiometry (DXA) scans cannot be used in many locations due to absence of the necessary infrastructure, and also due to the high cost of this technique.
We assessed whether a digital radiographic image acquisition and processing system might be used to replace the conventional densitometry method in measurement of bone mineral density in the periprosthetic tibial region of TKRs.
Patients and methods
At our department, 169 patients underwent TKR in 1999 and 2000. We took a random sample of 30 patients and evaluated 29 of them (20 women) because 1 of the sampled patients could not be contacted at the 24-month follow-up. Inclusion criteria were normal clinical and radiographic outcome, and no complications. None of the patients was given medication for osteoporosis. The mean age was 70 (58–86) years. In all patients, the implanted prosthesis was Interax (Stryker Howmedica Osteonics, Allendale, NJ), with cruciate retention. It had a cylindrical tibial stem 35 mm in length and all-cemented components. The study was approved by the Regional Ethics Committee.
All study subjects had a standard anteroposterior radiograph taken 12 and 24 months after surgery, using Philips Optimus equipment (Royal Philips Electronics, the Netherlands). The radiograph was taken following a previously established protocol: adjustment to 52 kV/s and 10 mA, focus-film distance 1 m, patients positioned at 180° knee extension using a splinting shank to avoid (or at least minimize) artefactual movements so that we could obtain reproducible data. Fluoroscopy was used to ensure correct adjustment to the anteroposterior plane. A vitallium reference (the same chrome, cobalt and molybdenum alloy as the prosthesis) was placed onto the skin of the knee to ensure that the density of the prosthesis matched the reference density.
The radiographs were photographed with a Canon Powershot 600 digital camera (Canon US Inc., NY) with a 570,000-pixel CCD (832 × 608 pixel spatial resolution; CCD size: 4.8 inch × 3.6 inch), fixed focal length 50 mm, Iso rating 100 and maximum aperture f2.5. The images were captured in a 256-level gray scale using the RAW format (no compression). The digital image analysis was performed on a PC using the public domain ImageJ program for Windows (developed at the U.S. National Institutes of Health and available at http://rsb.info.nih.gov/ij).
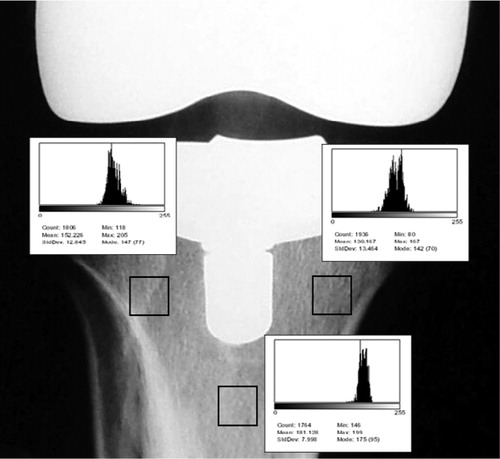
We defined three regions of interest (ROIs) of 1 cm2 area, each one located under the tibial component and coincident with Ewald's (1989) zones 2, 3 and 6: ROI-1 at the medial position, ROI-2 at the lateral position, and ROI-3 at the stem position. ROI-1 and ROI-2 were situated 1 cm underneath the tibial plateau and 1 cm from the external and internal border of the stem, respectively (). ROI-3 was localized 1 cm below the end of the central stem. First of all, a histogram of equalization was made to ensure standardization of the grayscale levels using the metal density and the air density as the maximum and minimum density references (). The optical density was measured in the defined ROI over a 0–255 gray scale.
Figure 1. Definition of ROI-1 and ROI-2 in radiographs and DXA scans.
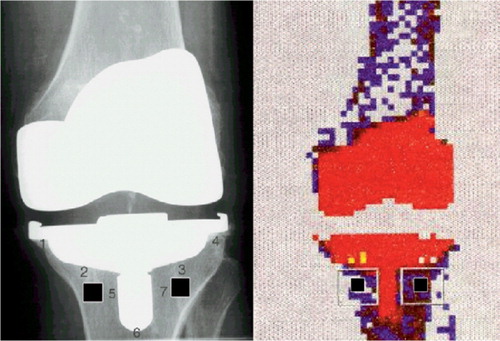
Figure 2. ROIs and density measurement by the optical method.
At the same time that the radiographic examination was done, we performed DXA scans of the knees with a Norland XR 26 MARK II ™ system (Cooper Surgical, Inc., Trumbull, CT). The mean density of the previously defined ROI was determined in g/cm2 units. For each patient, we calculated two mean density values—both for the optical values and for the DXA values. One of them (M3) averaged the three ROIs, while the other (M2) averaged only ROI-1 and ROI-2. This was done because the periprosthetic bone near the stem (ROI-3) is affected by mechanical forces differently in comparison to the other regions.
Statistics
We used Kolmogorov-Smirnoff Normality adjustment tests for continuous variables. Parametric or nonparametric tests were used, depending on the distribution of variables. We used Student's t-test or the Mann-Whitney test to test continuous or ordinal variables within two groups. We used Chi-square test or Fisher's exact test for categorical or dichotomous variables.
We performed a reliability analysis to assess the concordance between optical and densitometry measurements. Both scales were standardized to compensate for the different units of measurement (g/cm2vs. gray-scale level), thus giving Z-scores for M2 and M3 values both for the 12 months and 24 months. The consistency was calculated by Cronbach's alpha and intraclass correlation coefficient (fixed effects model), and graphically represented with Bland and Altman (Citation1986) plots. We also performed a linear regression analysis to obtain a prediction model where we could estimate the DXA value from the optical densitometry value. P-values less than 0.05 were considered to be statistically significant. Statistical calculations and plots were done with SPSS version 11 (SPSS Inc., whereabouts) and Medcalc version 7.4.3.1 (supplier, whereabouts) for Windows.
Results
The M3 values (density average of the three ROIs) were higher in men, both at 12 and at 24 months and using both measurement methods (). We found a decrease in density from 12 to 24 months in the three ROIs individually, and also in the averaged M2 and M3. This reduction in density was statistically significant in all the ROIs and for both methods ().
Table 1. Mean of density in the three ROIs at 12 and 24 months, and relationship regarding gender of patients
Table 2. Density obtained in the three ROIs, and average at 12 and 24 months
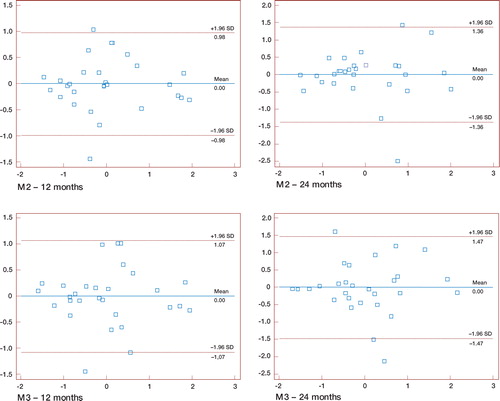
The consistency between DXA and the optical method calculated with Cronbach's alpha was 0.93 at 12 months and 0.86 at 24 months for M2 values, and 0.92 (12 months) and 0.84 (24 months) for M3 values. The intraclass correlation coefficient between both methods was 0.88 and 0.85 for M2 and M3 values, respectively, at 12 months and 0.76 and 0.72 for M2 and M3 values, respectively, at 24 months. All differences were significant at the p < 0.001 level. Bland and Altman plots within the 1.96 SD limits () confirmed a high concordance between the two measurement methods. We calculated linear regression models for each of the ROIs and the M2 and M3 averages to predict the value of the DXA value from the value of the optical density (at 24 months: y = 0.2058 + 0.005 ×for M2, and y = 0.2172 + 0.0049 ×for M3) (DXA value prediction (y) from radiographic values (x)).
Figure 3. Bland and Altman plots for M2 and M3 at 12 and 24 months.Average of DXA (g/cm2) and optical density (gray-scale value) is shown on the horizontal axis.DXA (g/cm2) – optical density (gray-scale value) is shown on the vertical axis.
Discussion
A reduction in bone mineral density is an early sign of alteration in the mechanical limb axis or implant migration. A reduction of BMD in the supportive areas of the prosthesis can cause subsidence of some components, especially of the tibial plateau. The conventional radiographs do not have enough sensitivity to allow diagnosis of the bone loss, and do not allow quantification. Several studies have shown that a loss of 30–50% of bone must occur before a change is detectable visually (Mirsky and Einhorm Citation1998).
Different quantitative methods for determination of BMD have been developed. Although it cannot discriminate between trabecular and cortical bone, the DXA seems to be the most accurate method, combining high precision and low radiation dose. There have been many studies confirming the usefulness of DXA for monitoring implant stability (Trevisan et al. Citation1998), early measurement of changes in periprosthetic density, and bone reaction after an arthroplasty (Cohen and Rushton Citation1995, Karbowski et al. Citation1999, Ishii et al. Citation2000, Mirsky et al. 2001). Many studies (Lonner et al. Citation2001, Van Loon at al. Citation2001) have demonstrated a change, especially a decrease, in the BMD after TKR. DXA scan is an expensive method, however, which is not available in many hospitals with limited resources.
We thus determined whether optical densitometry (measured from standard radiographs) could be used as an alternative to DXA. Digital image analysis systems are up to 20 times more accurate than the human eye (Bould et al. Citation1999) and improve the accuracy and reproducibility of radio-graphic measurements. Many articles recommend it for analysis of radiographs after surgery (Pedersen et al. Citation1998, Kolbeck et al. Citation1999, Holdsworth et al. Citation2000). In our study, the digital image is acquired from the X-ray film with a digital camera. A digital image processing software is used. In proper digital radiology, the image sensor is a digital device so the images are digital throughout; therefore, it is not necessary to convert anything to digital form. However, this system is rather expensive and not available in many health centers. The main aim of our work was neither to measure bone density nor to study densitometric changes in the regions near the TKR, but to determine whether optical densitometry could substitute for DXA analysis.
We found that both methods can demonstrate a reduction in BMD from 12 to 24 months in all ROIs. These observations are in accordance with one study in the literature (Levitz et al. Citation1995). We observed lower density values with the two measurement methods in the three ROIs for women, both at 12 and at 24 months of follow-up. This finding can be related to the higher prevalence of osteoporosis in the female population; however, it does not agree with another study which did not show any differences related to gender (Petersen et al. Citation1995).
The intraclass correlation coefficients and Cronbach's alpha showed good concordance between both density measurement methods. The optical density measurement allows estimation of the DXA values; thus, knowing the optical density value and using the regression model, we could calculate a densitometry value near to the one obtained with DXA.
This work was supported by a grant FIS 99/0592 from the Spanish National Institutes of Health.
- Bland J M, Altman D G. Statistical methods for assessing agreement between two methods of clinical measurement. Lancet 1986; 1(8476)307–10
- Bould M, Barnard S, Learmonth I D, Cunningham J L, Hardy J R. Digital image analysis: improving accuracy and reproducibility of radiographic measurement. Clin Biomech 1999; 14(6)434–7
- Cohen B, Rushton N. Accuracy of DEXA measurement of bone mineral density after total hip arthroplasty. J Bone Joint Surg (Br) 1995; 77(3)479–83
- Ewald F C. The Knee Society total knee arthroplasty roentgenographic evaluation and scoring system. Clin Orthop 1989, 248: 9–12
- Holdsworth D W, Thornton M M, Drost D, Watson P H, Fraher L J, Hodsman A B. Rapid small-animal dual-energy X-ray absorptiometry using digital radiography. J Bone Miner Res 2000; 15(12)2451–7
- Ishii Y, Yagisawa K, Ikezawa Y. Changes in bone mineral density of the proximal femur after total knee arthroplasty. J Arthroplasty 2000; 15(4)519–22
- Karbowski A, Schwitalle M, Eckardt A, Heine J. Periprosthetic bone remodelling after total knee arthroplasty: early assessment by dual energy X-ray absorptiometry. Arch Orthop Trauma Surg 1999; 119(5-6)324–6
- Kolbeck S, Bail H, Weiler A, Windhagen H, Haas N, Raschke M. Digital radiography. A predictor of regenerate bone stiffness in distraction osteogenesis. Clin Orthop 1999, 366: 221–8
- Levitz C L, Lotke P A, Karp J S. Long-term changes in bone mineral density following total knee replacement. Clin Orthop 1995, 321: 68–72
- Li M G, Nilsson K G. Changes in bone mineral density at the proximal tibia after total knee arthroplasty: a 2-year follow-up of 28 knees using dual energy X-ray absorptiometry. J Orthop Res 2000; 18(1)40–7
- Lonner J H, Klotz M, Levitz C, Lotke P A. Changes in bone density after cemented total knee arthroplasty: influence of stem design. J Arthroplasty 2001; 16(1)107–11
- Mirsky E C, Einhorn T A. Current Concepts Review. Bone densitometry in orthopaedic practice. J Bone Joint Surg (Am) 1998; 80(11)1687–98
- Pedersen D R, Brown T D, Hillis S L, Callaghan J J. Prediction of long-term polyethylene wear in total hip arthroplasty, based on early wear measurements made using digital image analysis. J Orthop Res 1998; 16(5)557–63
- Petersen M M, Nielsen P T, Lauritzen J B, Lund B. Changes in bone mineral density of the proximal tibia after uncemented total knee arthroplasty. A 3-year follow-up of 25 knees. Acta Orthop Scand 1995; 66(6)513–6
- Robertson D D, Mintzer C M, Weissman B N, Ewald F C, LeBoff M, Spector M. Distal loss of femoral bone following total knee arthroplasty. Measurement with visual and computer-processing of roentgenograms and dual-energy x-ray absorptiometry. J Bone Joint Surg (Am) 1994; 76(1)66–76
- Trevisan C, Bigoni M, Denti M, Marinoni E C, Ortolani S. Bone assessment after total knee arthroplasty by dual-energy X-ray absorptiometry: analysis protocol and reproducibility. Calcif Tissue Int 1998; 62(4)359–61
- Van Loon C J, Oyen W J, de Waal Malefijt M C, Verdonshot N. Distal femoral bone mineral density after total knee arthroplasty: a comparison with general bone mineral density. Arch Orthop Trauma Surg 2001; 121(5)282–5