Abstract
Background Acetabular cementation during total hip arthroplasty is considered difficult mainly due to the appearance and anatomy of the acetabulum. Improved cementation technique has been shown to improve the longevity of acetabular components.
Method We designed a ceramic model to investigate the effect of varying the initial cement pressurization and cup introduction times on the depth of cement penetration. 4 groups were prepared, 2 of which involved varying initial cement pressurization and cup introduction times. Group 3 involved initial cement pressurization with no cup introduction, while group 4 involved cup introduction with no prior cement pressurization.
Results and interpretation Most cement penetration occurred in the early pressurization phase, and we conclude that a relatively early and longer cement pressurization time and late cup introduction are positive factors for increased cement penetration in the acetabulum model.
Modern cementing techniques aim at optimizing the cement-bone interface to improve mechanical interlocking with the bone bed. The strength of fixation of the bone-cement interface depends on the quality of the bone bed, the intrinsic properties of the bone cement, and the depth of penetration of the cement. Increased penetration into the porous bone has been shown experimentally to lead to a stronger interface (Askew et al. Citation1984, Maltry et al. Citation1995).
In the acetabulum, a suboptimal cementation— as shown by even minor radiological demarcation in the cement-bone interface during the first year—has been reported to lead to 35–45% radiographic loosening at 10 years (Hodgkinson et al. Citation1993, Ranawat et al. Citation1995, Garcia-Cimbrelo et al. Citation1997, Ritter et al. Citation1999). Improved cementation technique with cement pressurization in the acetabulum has been shown to improve the longevity of acetabular components (Hodgkinson et al. Citation1993, Malchau et al. Citation1993, Ranawat et al. Citation1997). Late aseptic loosening of the acetabular component remains a problem, however (Mulroy et al. Citation1995, Ranawat et al. Citation1995), and is thought to be partly due to the difficulty in achieving adequate cementation pressure in the acetabulum given its anatomy. The acetabulum has a large surface area combined with a wide opening and discontinuity of the wall, which makes it difficult to develop and maintain a high enough extrusion pressure on the injected cement. We investigated the relationship between the initial cement pressurization time, cup introduction time, cement viscosity, and depth of cement penetration in a ceramic acetabular model.
Material and methods
Viscosity measurement
The rheological properties of Palacos R cement (Biomet Cementing Technologies AB, Sjöbo, Sweden) were investigated using a rotational paral-lel-plate AR2000 rheometer (TA Instruments, New Castle, DE) and data were analyzed using Rheology Advantage Data Analysis software (TA Instruments). Palacos R was vacuum-mixed for 30 sec using an Optivac mixing system (Biomet Cementing Technologies). Once mixed, a small amount of the cement was then transferred onto the lower plate of the rheometer (25 mm in diameter) and the total gap between the upper and lower plates was allowed to reach 100 μm. The procedure was performed in stress control mode on 3 cement samples using an oscillating stress of 10 Pa and angular frequency of 1 Hz for a minimum of 10 min (time sweep). The normal force was controlled to 0.5 N, with a tolerance level of 0.1 N.
Ceramic acetabular model
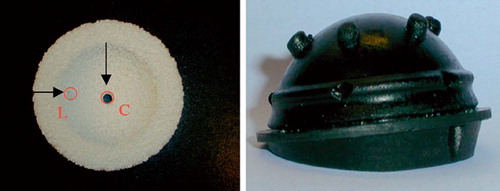
Open-pore ceramic sheets (grade 80 cell size: 600–700 μm) (Sivex; Pyrotek SA, Sierre, Switzerland) were used as acetabular models. The ceramic material was reamed to a 54-mm size in order to fit a 52-mm cup (demonstration Opticup; Biomet Cementing Technologies) (). The Opticup contained 5 spacers (4.65 mm in diameter and 3.33 mm in length), thus ensuring a cement mantle thickness of approximately 3 mm around the cup. 2 holes were drilled in each ceramic model at the central and lateral positions (10 mm from the edge) to allow the placement of pressure transducers. Pressure transducers were placed centrally and laterally in the ceramic model with their tips positioned at the surface of the ceramic, where they came in contact with the injected cement (). Such positioning permitted the continuous measurement of pressures during cement pressurization and cup introduction stages.
Figure 1. Ceramic acetabular model (L: lateral, C: central) and a 52–mm demonstration Opticup.
4 groups of ceramic acetabular models were prepared, with groups 1 and 2 consisting of 3 subgroups each (Table). Pre-chilled Palacos R bone cement (40 g polymer powder and 20 mL monomer liquid) was vacuum mixed using an Optivac vacuum system and injected onto the surface of the open-porous ceramic acetabular model. Once the cement was injected, it was pressurized using a Pressurizer (Biomet Cementing Technologies) that was attached to an Instron machine () in load-control mode, at different time points from the onset of cement mixing (Table). The force applied during this initial pressurization stage was 150 N at a rate of 10 N/sec until the cup was introduced. The cup was placed on the surface of the cement and introduced with a force of 150 N at 30 N/sec for the first 10 sec. This force was then reduced to 25 N until the cement had cured (groups 1 and 2; Table).
Figure 2. Set–up of the ceramic model during initial pressurization.
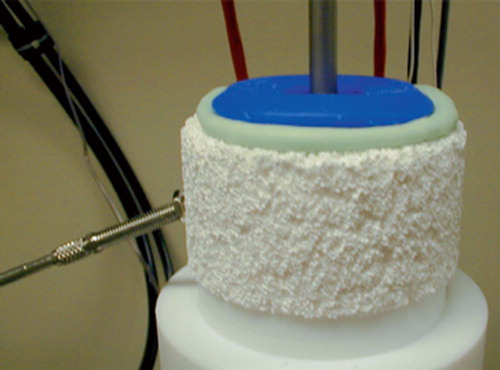
Table 1. Groups of ceramic acetabular models
The effect of initial pressurization alone and cup introduction alone on the resultant penetration depth was investigated in groups 3 and 4. In group 3, the cement pressurization commenced at 2.5 min after the start of mixing with 150 N, which was maintained for 2 min, and no cup was introduced. In group 4, the cup was introduced at 4.5 min with a force of 150 N for the first 10 sec with no prior cement pressurization, as shown in the Table.
Analysis
The ceramic acetabular model was cut longitudinally along the center of the cup (). Each cut section was then scanned with an Epson Perfection 1670 scanner (Seiko Epson Corp., Japan) and measurements of the depth of cement penetration were taken from zones 1 and 2 corresponding to the modified Charnley DeLee zones (cup divided into 3 zones of 60°), using Adobe Photoshop software. The depth of penetration was measured every 7.5°, thus giving a total of 8 measurements within each zone. The Adobe software allowed the measurement of the number of pixels of each depth measured, as illustrated in . The pixel number was then converted into millimeter (mm) length by taking into account the ratio of mm to pixels in the true size of the measured ceramic section (47.24 pixel/mm). Only 1 section of each model was measured, as the distribution of the cement was assumed to be homogenous due to the fact that each Opticup contained spacers that ensured a uniform cement mantle around the cup.
Figure 3. Photograph showing the cut ceramic acetabular model with cemented demonstration Opticup. PD (↔): depth of cement penetration, PT: pressure transducer.
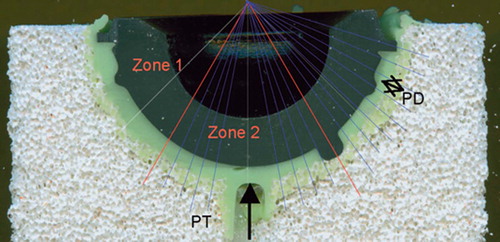
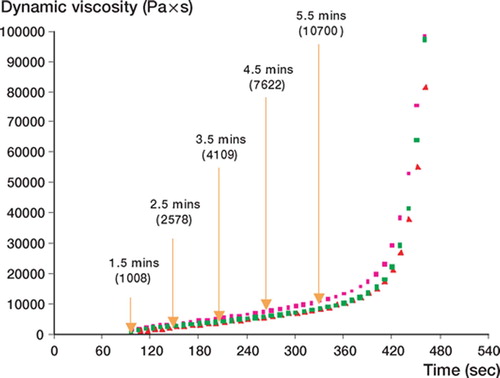
Figure 4. Viscosity profile of Palacos R bone cement.
Statistics
Statistical analysis of the penetration depths within each group and amongst all groups was performed using two-way ANOVA with post hoc tests (Stat-View; SAS Institute Inc., 2-letter code for state). Pvalues less than 0.05 were considered significant.
Results
At the start of the measurement, the dynamic viscosity of the cement was at its lowest, measuring only 1008 Pa at 1.5 min. This was then found to increase steadily with time until approximately 7 min, when it increased dramatically as the cement began to set ().
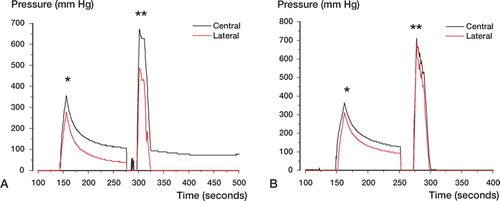
shows typical pressure profiles for groups 1 and 2 (panels A and B, respectively), recorded during initial cement pressurization and cup introduction stages. The first peak represents initial cement pressurization, followed by a short time span with no significant pressure measure-ment—representing the time at which the pressurizer was exchanged for the cup. The second peak of pressure was recorded during introduction of the cup into the acetabular model, and was found to decrease sharply once the cup reached its final position. In all cases, the pressure during cup insertion was higher than during cement pressurization, which we assume reflects the differences in cement viscosity at these times.
Figure 5. Pressure profile during cement pressurization (*) and cup insertion (**) in (A) group 1 (with initial cement pressurization at 2.5 minutes), and (B) group 2 (with cup introduction at 4.5 min).
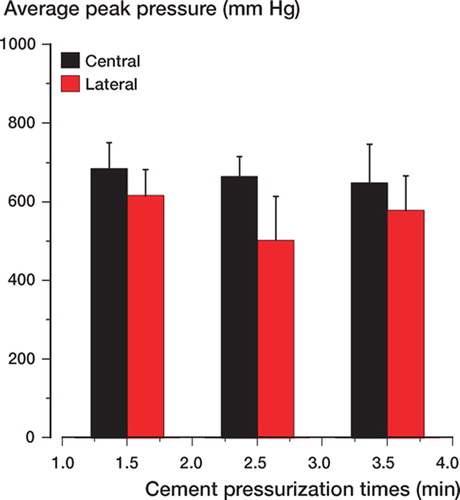
In group 1, a difference in the average peak pressures was observed between the central and lateral zones among the three time points during the cup introduction stage () (p = 0.002).
Figure 6. Average peak pressure measurements in the central and lateral zones during cup introduction in group 1.
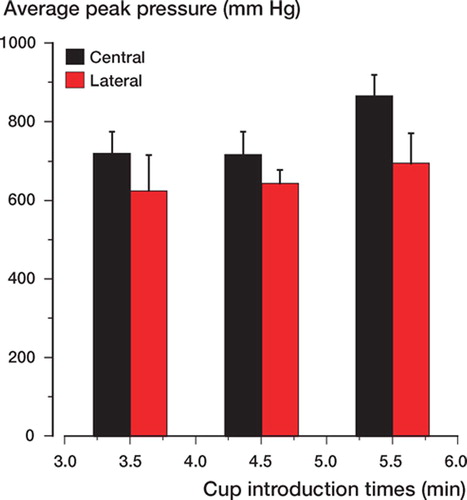
In group 2, the peak pressures during cup introduction at 3.5, 4.5, and 5.5 min differed significantly () (p = 0.002). However, further analysis using the Bonferroni test showed that the significant differences occurred between pressures generated at 5.5 min and those generated at 3.5 and 4.5 min. In comparison, pressures generated in the central zone during the three different time points were significantly higher than in the lateral zone (p < 0.001).
Figure 7. Average peak pressure measurements in the central and lateral zones during cup introduction in group 2.
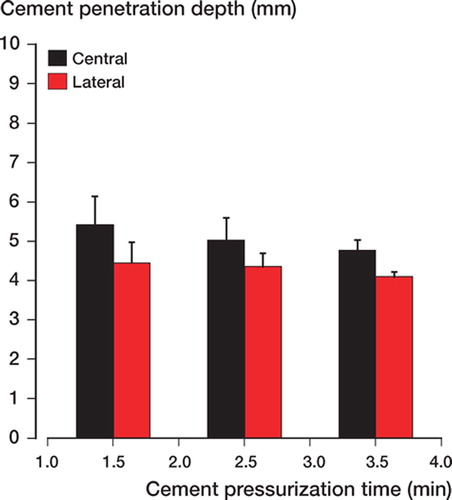
The results of measurement of penetration depth in group 1 are shown in . The increase in penetration depth was reduced with the postponement of the initial cement pressurization times (p < 0.006). The Bonferroni test showed that such reduction was significant between time points 1.5 and 2.5 min or 1.5 and 3.5 min. The penetration depth in the central zone was found to be significantly higher than in the lateral zone (p < 0.001).
Figure 8. Average cement penetration depth in the central and lateral zones during cup insertion in group 1.
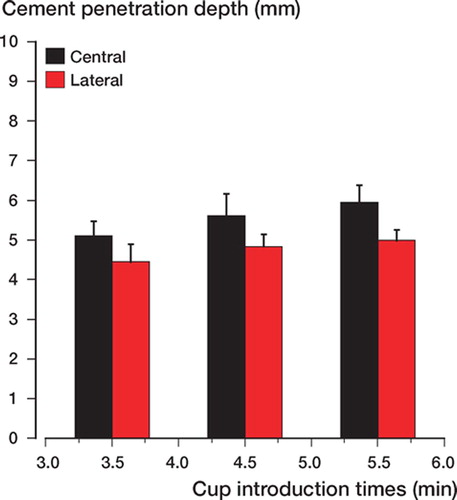
The results of group 2 showed a more defined pattern with regard to the penetration depth (). An increase in penetration depth was achieved with increasing time of cup introduction (p = 0.001). This increase was also associated with longer pressurization times (Table). Further analysis using the Bonferroni test showed that the significant increase in penetration depth was evident between 3.5 and 4.5 min or 3.5 and 5.5 min cup introduction times. In addition, the penetration depths in the central zone were significantly higher than those in the lateral zone for all cup introduction times (p < 0.001).
Figure 9. Average cement penetration depth in the central and lateral zones during cup introduction in group 2.
Discussion
Three independent variables, which are under the control of the surgeon, determine the intrusion characteristics of the cement: magnitude of cement pressure, duration of pressure application, and viscosity of acrylic cement (Askew et al. Citation1984). Achievement of an adequate cement pressure and penetration in the acetabulum is particularly difficult, given its appearance and anatomy. The acetabulum has a large surface area, a wide opening, and a discontinuity in the wall under the transverse ligament—all of which make it difficult to achieve adequate intrusion pressure on the cement.
We investigated the influence of varying the initial cement pressurization and cup introduction times, and the effect of cement viscosity during such times, on the final depth of penetration of cement in a ceramic acetabular model.
In terms of the pressures recorded, we found that mean peak pressure during initial pressurization was significantly lower than that recorded during introduction of the cup. This was mainly due to the higher cement viscosity at the time of cup introduction relative to the initial pressurization stage. The viscosity profile of Palacos R showed that the measured dynamic viscosity of the cement increased by 155% between 1.5 and 2.5 min. By the time of the latest cup introduction (group 1 at 5 min, and group 2 at 5.5 min), the viscosity of the cement had increased by over 500% of its starting value. The reason for this sharp increase in viscosity was the rapid increase in polymer chain formation during the polymerization process, which consequently leads to higher molecular weight. Dunne and Orr (Citation1998) described bone cement as a material with interesting viscoelastic characteristics where in a relatively short period of time it becomes transformed from a material showing fluid-like properties through a dough-like phase to a solid material. In addition, bone cement is a non-Newtonian, pseudoplastic material that undergoes a phenomenon known as shear-thinning, whereby the viscosity of the material becomes reduced with increasing shear rate.
The magnitude of force used to pressurize the cement during the initial pressurization and cup introduction stages was the same for all groups in this study (150 N); however, the viscosity of the cement during these 2 stages was clearly different, as discussed previously. Due to the shear-thinning nature of the cement, a lower velocity/injection rate (10 N/s) was used during the low viscosity stage (initial pressurization) to avoid excess leakage. However, a higher velocity (30 N/s) was used during introduction of the cup due to the increased viscosity of the cement.
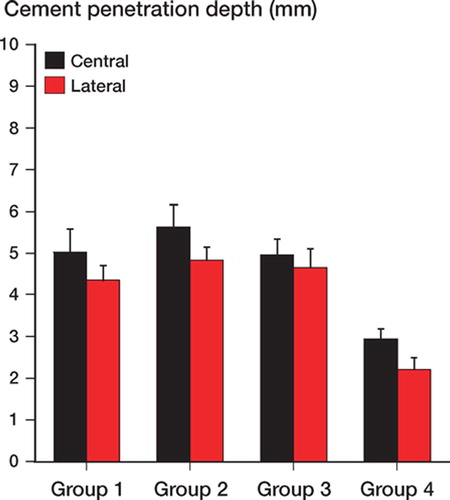
The most interesting findings of this study were the results of groups 3 and 4. The results showed that most cement penetration occurred during the initial pressurization and not during cup introduction (). When comparing groups 3 and 4 to groups 1 and 2 (at the same time points for pressurizer and cup introduction) we found that the use of a pressurizer prior to cup introduction (group 1 vs. 3) was responsible for 98% of the overall penetration in group 1 (central zone). In comparison, cup introduction with no prior cement pressurization (group 4) had accounted for only 52% of the final penetration depth in group 2. Cup introduction was therefore not a major factor in further increasing the depth of cement penetration. These findings are in agreement with the results of Flivik et al. (Citation2004), who showed that although the highest peak pressure was achieved during cup introduction, this did not affect the depth of cement penetration any further. Thus, the cement took the path of least resistance instead and escaped out of the acetabulum around the advancing cup where there was no counter pressure. This observation also supports our findings of lower penetration depths being achieved in the lateral zones where there was a higher possibility of the cement escaping out on the edges of the ceramic model in comparison to the central zone (). Additionally, cup introduction does not offer the same seal-like effect achieved by the pressurizer. In comparison, higher cement penetration during the initial pressurization stage was not only due to the lower cement viscosity, but also to the cement penetrating an open-pore structure with no resistance from bone marrow or circulating blood and under the sealing effect of the pressurizer. Juliusson et al. (Citation1995) showed that the presence of blood circulation reduced cement penetration by 50%. Thus, it is important to remember that this was an in vitro study in which the effects of bone marrow, fat, and bleeding pressure were not taken into account; therefore, the absolute depths of cement penetration in this study are not directly comparable to an in vivo situation.
Figure 10. Comparison of penetration depth in groups 1–4 with common time points. Group 1: onset of cement pressurization 2.5 min; cup introduction time 5 min. Group 2: onset of cement pressurization 2.5 min; cup introduction 4.5 min. Group 3: onset of cement pressurization 2.5 min; no cup introduction. Group 4: onset of cup introduction 4.5 min; no initial pressurization.
The limitations of our study include not taking into account the effects of the pore interconnections and cement holes on the development of the pressure generated during initial pressurization and cup introduction stages. The effects of such parameters on the pressure and cement penetration will be considered in a separate study. In addition, we also decided to conduct the study at room temperature and not to introduce a wet model, as the study was not designed to be clinically controlled.
This project was supported by a Marie Curie fellowship grant from the European Commission (MEIF-CT-2003-502109). Special thanks to Mr Mats Christensson for producing the ceramic models. Bone cement and cement mixing devices were kindly donated by Biomet Cementing Technologies AB, Sjöbo, Sweden.
Contributions of authors
SA: project setup, planning, experiment execution, data collection, data interpretation and writing the manuscript. JSW, ID and GF: project setup, planning, data interpretation and statistics.
- Askew M J, Steege J W, Lewis J L, Ranieri J R, Wixson R L. Effect of cement pressure and bone strength on poly-methyl-methacrylate fixation. J Orthop Res 1984; 1: 412–20
- Dunne N J, Orr J F. Flow characteristics of curing polymethyl methacrylate bone cement. Proc Instn Mech Engrs 1998; 212H: 199–207
- Flivik G, Wulff K, Sanfridsson J, Ryd L. Improved acetabular pressurization gives better cement penetration: In vivo measurements during total hip arthroplasty. J Arthroplasty 2004; 9(7)911–8
- Garcia-Cimbrelo E, Diez-Vazquez V, Madero R, Munuera L. Progression of radiolucent lines adjacent to the acetabular component and factors influencing migration after Charnley low-friction total hip arthroplasty. J Bone Joint Surg (Am) 1997; 79(9)1373–80
- Hodgkinson J P, Maskell A P, Paul A, Wroblewski B M. Flanged acetabular components in cemented Charnley hip arthroplasty: Ten-year follow-up of 350 patients. J Bone Joint Surg (Br) 1993; 75(3)464–7
- Juliusson R, Flivik G, Nilsson J, Ryd L, Önnerfält R. Circulating blood diminishes cement penetration into cancellous bone: In vivo study of 21 arthrotic femoral heads. Acta Orthop Scand 1995; 66(3)234–8
- Malchau H, Herberts P, Ahnfelt L. Prognosis of total hip replacement in Sweden: Follow-up of 92,675 operations performed 1978-1990. Acta Orthop Scand 1993; 64: 497–506
- Maltry J A, Noble P C, Kamaric E, Tullos H S. Factors influencing pressurization of the femoral canal during cemented total hip arthroplasty. J Arthroplasty 1995; 10(4)492–7
- Mulroy W F, Estok D M, Harris W H. Total hip arthroplasty with use of so-called second-generation cementing techniques: A fifteen-year-average follow-up study. J Bone Joint Surg (Am) 1995; 77(12)1845–52
- Ranawat C S, Deshmukh R G, Peters L E, Umlas M E. Prediction of the long-term durability of all-polyethylene cemented sockets. Clin Orthop 1995, 317: 89–105
- Ranawat C S, Peters L E, Umlas M E. Fixation of the acetabular component The case for cement. Clin Orthop 1997, 344: 207–15
- Ritter M A, Zhou H, Keating C M, Keating E M, Faris P M, Meding J B, Berend M E. Radiological factors influencing femoral and acetabular failure in cemented Charnley total hip arthroplasties. J Bone Joint Surg (Br) 1999; 81(6)982–6