Surgeons have the difficult task of deciding which treatment or procedure is best for their patients, while considering the expenses in their department. Increasing costs of healthcare, decreasing health resources, an aging population, and an increased rate of diffusion of new technologies are forcing them to provide cost-efficient, high-quality care (Bozic et al. Citation2004). Economic evaluations can be a useful tool to help them provide "value for money", and to help in deciding which new surgical procedures should be implemented.
Why do we need economic evaluations?
The healthcare system is fundamentally aiming to achieve maximum benefit for patients in terms of health and welfare. While there are limited resources (staff, facilities, time, and money), it is not enough to only test the clinical efficiency of a new intervention or procedure (e.g. with clinical trials). It is also of great importance to weigh the clinical outcomes by the costs which are directly made as well as all future costs. According to Gold et al. (Citation1996), an economic analysis consists of two features: "inputs and outputs" (or costs and consequences) and "choices". Due to the scarcity of resources and the inability to achieve all desired outputs, physicians and healthcare administrators need to make choices—based on clinical and economic criteria—about which therapy to use or perform.
An important concept in economic evaluations is opportunity costs. These are the health benefits that are lost because the next-best alternative was not selected (Gold et al. Citation1996). When money is spend in one place, it cannot be spent elsewhere. For example, using an expensive tool might reduce the percentage of re-operations afterwards, but considering the fact that there are limited resources, the money spent on this tool cannot be spend on more assistance in surgery, which might also be needed (Drummond et al. Citation2005). Thus, economic evaluations provide a framework for decision making that can be used by physicians and administrators to make decisions that take into account both the clinical and economic consequences associated with these choices (Drummond et al. Citation1997).
There are several excellent textbooks (Gold et al. Citation1996, Drummond et al. Citation1997, Citation2005) and guidelines on how to perform an economic analysis (Udvarhelyi et al. Citation1992, Robinson Citation1993a. Citationb, Citationc, Citationd, Citatione, Saleh et al. Citation1999, Thompson and Barber Citation2000, Goodacre and McCabe Citation2002b, Kocher and Henley Citation2003) and how to read and write an economic article (Drummond and Jefferson Citation1996, Drummond et al. Citation1997, Goodacre andMcCabe Citation2002a). However, according to the article of Bozic et al. (Citation2004), who reviewed 81 economic evaluations of total hip replacement conducted between January 1966 and July 2002, the methodological quality of many of these studies remains inadequate.
To assist in performing economic evaluations and in comprehending them, this article presents the most important concepts in economic evaluations. The paper starts with an introduction to the types of economic evaluations before describing how to perform economic analyses of healthcare programmes. More advanced concepts—such as the treatment of uncertainty in economic evaluations—are introduced thereafter. The concepts are illustrated by examples for educational purposes, although the authors do not take any position on the quality of the economic evaluations cited in this paper.
Types of economic evaluations
Economic evaluation has been defined as "the comparative analysis of alternative courses of action in terms of both their costs and consequences" (Drummond et al. Citation2005). Economic evaluations serve to inform us about choices regarding how to use scarce resources. When comparing two or more alternatives in terms of costs and consequences, there are four types of analyses depending on the clinical outcome (Goodacre and McCabe Citation2002a, Drummond et al. Citation1997). We will describe the ones most commonly used, and show an example of each type from a recent study.
Cost minimization (or identification) analysis is the simplest form of economic evaluation. When the primary endpoint of the trial is considered to be equivalent between treatment groups (which is quite rare), a cost-minimization analysis can be performed to identify the least costly intervention (Robinson Citation1993d). This makes cost-minimization analysis the easiest type of analysis to perform. However, Briggs and O'Brien (Citation2001) argued that unless a study was designed to show equivalence of treatment, it is not appropriate to perform a cost-minimization analysis on the basis of a lack of observed difference between treatment options. This lack of observed difference in the mean estimates does not mean that there is not any difference between treatment groups when the full distributions (rather than the mean estimates) are taken into account. Thus, cost-minimization analysis is no longer considered a “full” economic evaluation (Drummond et al. Citation2005) and cost-effectiveness (or cost-utility) should be used for all studies that have not been designed to show equivalence between treatments. An example of cost-minimization analysis is the study by Gonano et al. (Citation2006). This study, from a hospital point of view, analyzed the costs of spinal versus general anaesthesia for orthopedic surgery. As the clinical outcome was found to be similar in both groups, a cost-minimization analysis was performed showing that spinal anesthesia is less costly than general anesthesia in patients undergoing hip or knee replacement.
Cost-effectiveness analysis (CEA) and cost-utility analysis (CUA) are methods for determining the trade-off between additional costs and additional outcomes. In CEA, the consequences are expressed in terms of non-monetary units that describe the desired objective such as lives saved (i.e. life years gained), number of hospitalizations avoided or cases prevented (e.g. nonunion fractures avoided). Compared to mortality outcomes, the use of disease-specific outcomes (e.g. nonunion fractures avoided) in CEA may limit the comparability of the results with different interventions or medical conditions. In addition, CEA cannot be used to compare interventions with different health outcomes (Drummond et al. Citation2005), or when quality of life is the important outcome. An example of a CEA can be found in the study by Gordois et al. (Citation2003). This study uses a decision analytic model to asses the cost-effectiveness of selective antithrombotic fondaparinux against low-molecular-weight heparin enoxaparin. Comparing costs and effects, fondaparinux was found to be more effective and to reduce costs, and was therefore the recommended strategy.
When quality of life is an important factor to consider, a cost-utility analysis can be performed. Cost-utility analysis is similar to a cost-effectiveness analysis on the cost side, but different with respect to the outcome, which is often expressed in terms of quality-adjusted life years (QALY) gained. QALYs have been described as a composite measure of outcome where utilities for health states (on a 0–1 scale) act as qualitative weights (Weinstein and Stason Citation1977). For example, 20 years in perfect health with 1.0 utility (i.e 20 QALYs) are assumed to be equivalent to 40 years at 0.5 utility (20 QALYs).
Utilities, which measure patient preferences for a particular health state on a scale from 0 (death) to 1 (perfect health), are often obtained by using preexisting utility questionnaires. Using scoring algorithms to calculate participants’ utilities based on their responses, it is then possible to derive the QALYs by weighting the time spent in the different health states considered in the economic evaluation (e.g. healthy, diseased, dead) by their corresponding utilities (e.g. 1.0, 0.5, and 0, respectively). The EQ–5D questionnaire developed in Europe (5 questions as well as a visual analog scale) and the Health Utility Index (HUI) questionnaire developed in Canada (14 questions) have been used in different settings and populations to compute utilities. It is also possible to derive utilities through direct measurement using either a standard gamble approach (live with disease A forever or take a drug which can cure or kill you with a certain probability p) or a time trade-off approach (live with disease A forever or live shorter in a better state of health). However, these 2 methods may be more complicated to implement than the administration of a questionnaire (e.g. EQ–5D). An example of a cost-utility analysis is the study by Fielden et al. (Citation2005). This study, from a societal perspective, evaluated the economic and health outcomes of waiting for hip arthoplasty. The relationship between waiting lists and QALYs were analyzed together with costs. QALYs were measured using the EQ–5D questionnaire.
In addition to utility questionnaires, the use of disease-specific and generic questionnaires when conducting trials is also recommended. Disease-specific questionnaires are based on aspects of health specific to a particular medical condition. They are more likely to detect changes between treatment groups over time (i.e. increased sensitivity). For example, the WOMAC Osteoarthritis Index provides information on the condition of the arthritis by measuring pain, stiffness, and function (Ritter and Albohm Citation1997). The study of Fielden et al. (Citation2005) used the WOMAC Osteoarthritis Index and the EQ–5D to assess the health-related quality of life of patients waiting for hip arthroplasty.
In contrast, generic questionnaires relate to health in general, including physical and mental function, mobility, pain, vitality, or other domains. Generic questionnaires allow comparison to a normative group or comparison across programs or diseases. Examples of generic questionnaires are QWB (quality of well-being), which is a long questionnaire and which uses a recall period of 6 days (instead of today, like most other questionnaires) (Kaplan et al. Citation1996), and SF–36 (Short Form-36 and SF–6D), which is a short instrument and the most widely used generic questionnaire (Mooney Citation2006). The study of Polly et al. (Citation2007) made use of the SF–36 to assess quality of life after lumbar spine fusion surgery, and calculated lumbar fusion cost per benefit. The SF–6D was developed from the SF‐36 by reducing the 8 dimensions to 6 dimensions. This reduced questionnaire, which includes 6 domains, was developed to calculate quality adjusted life years from the SF–36, similar to the EQ–5D questionnaire (Nemeth Citation2006).
The last type of economic evaluation is cost-benefit analysis (CBA). In CBAs, monetary values are assigned to both costs and benefits (Robinson Citation1993a). This method makes it possible to determine whether the new intervention gives a total benefit to society, with benefits exceeding costs, which give a more full analysis compared to a cost-effectiveness analysis (Robinson Citation1993a). However, ideally this requires both complete and comparable data on all alternatives, which is not easily obtained (Drummondet al. 2005). Several methods exist to monetarize benefits. For example, in a willingness-to-pay approach, individuals (e.g. patients, the general public) are asked what they are willing to pay to achieve a particular outcome or state of health (Drummond et al. Citation1997). It is also possible to assign a monetary value to a life (e.g. the value of lost productivity for society due to premature death). An example of a cost-benefit analysis is the study by Reitman et al. (Citation2004). In this study concerning patients undergoing lumbar fusion surgery, the outcome was blood loss. This blood loss was subsequently valued in monetary terms.
While CBAs allow comparison of programs or interventions with entirely different outcomes, CBAs have not been widely embraced in the literature, largely due to the difficulty in assigning monetary values to health outcomes. Out of 81 economic studies on total hip replacement reviewed by Bozic et al. (Citation2004), only 1 was a cost-benefit analysis. In comparison, 47 of these studies were cost-minimization studies (which should be used in rare circumstances!), 20 were cost-effectiveness analyses, and 13 were cost-utility analyses.
Dominance versus trade-off
In performing a cost-effectiveness analysis, the first step is to determine if one treatment dominates over another treatment. This situation happens when one treatment is more effective and is also less costly than another treatment. In the absence of dominance (i.e. one treatment is more effective but more costly than the other treatment), incremental cost-effectiveness or cost-utility ratios are calculated.
Average versus incremental CE ratios
For each treatment group, it may be tempting to compute an average cost-effectiveness ratio by dividing costs by benefits (e.g. life years gained) associated with each intervention and then selecting the intervention with the lowest cost-effectiveness ratio. Average cost-effectiveness ratios play no role in decision making, however, as average cost-effectiveness ratios compare a treatment with an alternative with zero costs and zero outcomes, which does not exist. Even a "wait and see" approach will result in costs and consequences over time! In addition, most of the time we are interested in knowing how much more it costs to get a unit of effect with a new treatment strategy compared to an existing treatment (e.g. usual care). For these reasons, we strongly recommend that one should compute incremental cost-effectiveness ratios (ICERs) when comparing 2 treatments rather than average cost-effectiveness ratios. ICERs are defined as the ratio of the difference in costs between 2 treatments (here designated A and B) and the difference in units of effects between these 2 treatments.
Cost-effectiveness plane
A useful way to illustrate the additional costs (incremental costs) compared to the additional treatment effects is to present the comparators on a cost-effectiveness plane. In a CE plane (), costs (“new treatment more/less expensive”) are plotted on the y-axis against benefits (“new treatment more/less effective”) represented on the x-axis. The origin represents the reference treatment (i.e. usual care, or treatment A).
Figure 1. Cost-effectiveness plane.
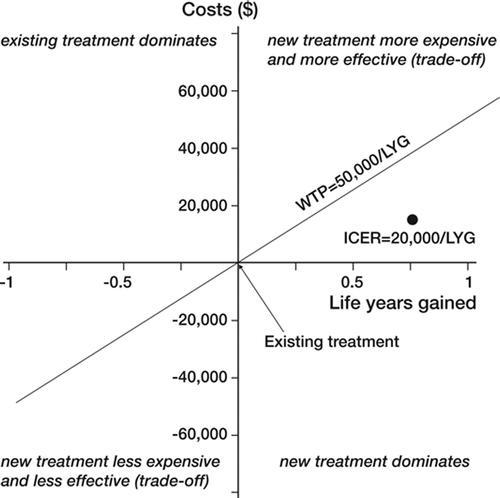
This plane defines 4 quadrants, which have different interpretations in terms of cost-effectiveness. In the southeast quadrant (), the new treatment dominates as it is more effective and less costly. This is opposite to the case in the northwest quadrant, in which the existing treatment is more effective and less expensive than the new treatment (i.e. existing treatment is dominant). The two other quadrants represent situations in which either the new treatment is more expensive but more effective than the reference treatment (northeast quadrant) or less expensive but less effective (southwest quadrant). In these two scenarios, the decision to adopt the new treatment is based on a trade-off between costs and effectiveness.
In reality, most of the time new treatments are more effective than existing treatments but these additional benefits come at an additional cost. However, if this ICER is below a certain threshold (e.g. how much society is willing to pay to save one year or life or to gain one QALY), the new intervention is deemed cost-effective compared to the existing treatment. There are several ways to set a threshold value, such as using willingness to pay for a QALY by the public or politicians or choosing a threshold value that results in the most efficient use of a healthcare budget (Buxton Citation2006). In the UK, the National Institute for Clinical Excellence (NICE) considers that threshold values should lie between £20,000 and £30,000 (≈ ?29,240 and ?43,850) per QALY or LYG (Buxton Citation2006). George et al. (Citation2001) stated that between 1991 and 1996, the PBAC (Australian Pharmaceutical Benefits Advisory Committee) showed a willingness to pay between $AU 42,000 and $AU 76,000 (≈ ?25,350 and ?45,880) for a life year gained (George et al. Citation2001). Other guidelines or countries may use different threshold values (e.g. Canada (Laupacis et al. Citation1992)) in accepting a technology. presents these concepts using a hypothetical threshold of ?50,000 per QALY for a hypothetical ICER of ?20,000 per QALY. Here, the new technology would be considered cost-effective in relation to what society is willing to pay.
The economic perspective
Several standpoints can be considered in economic evaluations (e.g. those of the patient, hospital, government, insurer, employer, or society) (Robinson Citation1993e) to reflect different levels of a healthcare system (e.g. patient, hospital, county, country). An economic evaluation usually includes two types of costs: direct costs (i.e. healthcare resources used for management of the condition and related illnesses) and indirect costs (i.e. the value of the economic output lost because of illness, injury-related work disability, or premature death—such as mortality or morbidity-mortality costs).
From a hospital perspective, only direct medical costs incurred by the hospital (e.g. inpatient drugs, medical devices, and services) are taken into consideration. A Ministry of Health (i.e. payer) perspective will also include direct medical costs associated with outpatient care (e.g. follow-up care). The societal perspective, however, will also take into consideration indirect costs such as patients’ out-of-pocket expenditure (e.g. travel costs, over-the-counter drugs) and the costs of loss in productivity (e.g. time of work).
When performing an economic evaluation, the most preferred approach is the societal perspective, which takes into consideration every possible aspect of cost and benefit, even when the patient is transferred to another hospital, or when resource costs are shifted between hospital, insurers, patients, and other parties (Gold et al. Citation1996). At the start of a trial, it is better to perform an economic evaluation from a broad perspective instead of trying to collect cost data afterwards and possibly missing relevant information. Afterwards, the analysis can then be viewed from other standpoints (Drummond and Jefferson Citation1996). On the other hand, there are several guidelines recommending that the main perspective should be the payer's standpoint, with costs associated with a wider perspective reported separately (Canadian Agency for Drugs and Technologies in Health Citation2006). Even so, a review by Bozic indicated than 83% of economic evaluations of total hip replacement only considered direct costs (Bozic et al. Citation2004). Only a few studies have considered indirect costs incurred by the patient or by society.
Future medical costs
Future medical costs can be divided into three groups: (1) future-related medical costs (due to treatment during added life years), (2) future-unrelated medical costs (due to treatment of other diseases), and future non-medical costs (all non-medical costs during added life years) (Liljas et al. Citation2007). Over the years, there has been some controversy in the literature about the nature of the future costs that should be included in an economic evaluation, and what not to include. Future-related medical costs are usually part of the evaluated healthcare program and should therefore be included in the analysis. In contrast, there has been a great deal of discussion about inclusion of future-unrelated medical costs and future non-medical costs (Garber and Phelps Citation1997, Meltzer Citation1997, Nyman Citation2004, Liljas et al. Citation2007), and the debate is still going on.
Discounting
For chronic conditions (e.g. diabetes) or to evaluate certain interventions, it is important to collect both short-term and long-term costs and heath outcomes. When the time horizon of the study is longer than 1 year, it is necessary to discount (which means “reduce” in economic analysis) both costs and outcomes with future costs and outcomes receiving smaller weights than the present ones (i.e. discounted). Discounting is used to reflect individuals’ time preferences (e.g. preferring to be richer or healthier today rather than tomorrow). This so-called “time preference” causes the money and outcomes to be worth more today than tomorrow. There are several reasons for this time preference—for example, individuals may prefer to have money and benefits now than to receive them in the future, or they may prefer to postpone bad outcomes so that they happen in the future instead (Drummond et al. Citation2005). While there is still debate about which method should be used to discount (continuous or discrete discount rates), discount rates of 3% or 5% for both costs and outcomes are generally recommended in several guidelines and textbooks (Gold et al. Citation1996, Welte et al. Citation2004, Buxton Citation2006, Canadian Agency for Drugs and Technologies in Health 2006). However, in the review of Bozic et al. (Citation2004) it was found that most of the studies only included costs incurred during the first hospitalization or rehabilitation stay. Less than 20% of the studies considered a time horizon greater than one year of follow-up.
How can economic evaluations be performed?
There are two main approaches to conducting an economic evaluation: (1) alongside a trial, or (2) through the use of a decision analytic model.
Trial-based economic evaluations
In trial-based economic evaluations, use of healthcare resources or costs incurred in each treatment group (e.g. length of stay in hospital, physician visits, rehabilitation services) are collected alongside a trial—preferably a randomized, controlled trial. O‘Brien (Citation1996) referred to this method as the “vampire method”, whereas all data required for the economic evaluation are extracted from the trial. However, since it is difficult to collect costs in a trial directly (e.g. physicians or patients may not be aware of the costs of 1 day in hospital), various public and private sources external to the trial are used to do the costing.
Modeling
Decision analytic models can be developed when experiments are not possible (e.g. for ethical reasons), when the objective is to compare several treatment alternatives, or when it is necessary to extrapolate the results of a trial to a longer time horizon (Buxton et al. Citation1997). O'Brien (Citation1996) called modeling the “Frankenstein method”, as various sources of information (e.g. meta-analysis, administrative databases, expert opinion) are used to create a model.
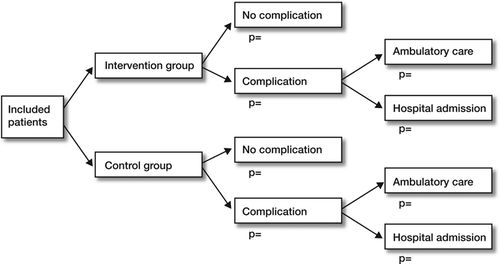
The two main kinds of models used in economic evaluations are decision trees and Markov models. A decision tree shows all decisions to be made, possible events, and associated health outcomes using branches resembling a tree. A decision tree starts from left to right with a decision node: should I treat the patient with treatment A or treatment B? Associated with this decision, there will be outcomes (complications or no complications). is an example of a simple decision tree for a hypothetical treatment.
Once the costs and outcomes associated with each branch of the tree have been identified, it is then possible to calculate the expected costs and outcomes by summing all the values of the branches, weighted by the branch probabilities. For example, let us assume that the probability of developing a complication following an intervention is 0.2 and the associated cost is €100. The cost associated with no complication is €10. The expected cost associated with this intervention is €28 (0.2 × €100 + 0.8 × €10). Similar calculations can be done for the outcomes. Once the expected costs and outcomes have been calculated for each treatment group, an incremental cost-effectiveness analysis can be conducted.
Figure 2. Decision tree.
Decision trees can become very bushy (i.e. have lots of branches) when there are many outcomes/ health states to model, or when a long time horizon is required (e.g. with chronic disease). For example, the number of branches required to model a simple 3-health-state recurrent model in which patients are either healthy, diseased, or dead is 3, 7 and 15 branches, respectively, to model out to 3 cycles (e.g. years). For these and other reasons, Markov models are easier tools than decision trees for modeling of chronic diseases, recurrent health states, or longer time horizons.
Markov models are defined by health states (e.g. healthy, diseased, or dead). At the end of each cycle (e.g. a week, a month, or a year depending on the problem), patients move from health states to health states according to transitional probabilities. shows a 3–state recurrent model (healthy, diseased, dead) in which arrows represent transitional probabilities, the values of which are given in the table below the bubble diagram.
Figure 3. Markov decision model.
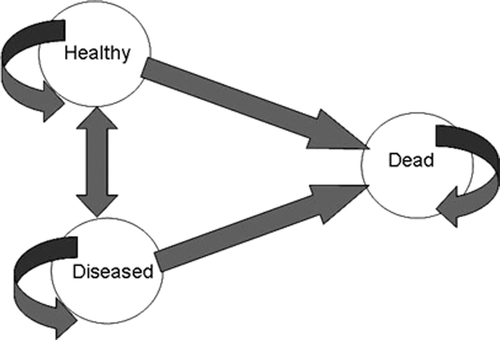
These transitional probabilities can be used to simulate a cohort of patients over time (e.g. 1,000 individuals). The costs and outcomes associated with each health state are then weighted by the time spent in these health states to calculate the expected costs and outcomes. There are 2 important assumptions associated with Markov models. The basic Markov model, as in our example in , assumes constant probabilities over time. However, this assumption can be relaxed and time-dependent probabilities can be determined based on tabular or statistical functions (Briggs et al. Citation2006). The second characteristic of Markov models is that they do not have memory. For example, the probability of dying will be the same for someone who has been healthy for 9 years and diseased for 1 year than for someone who has been healthy for 3 years and diseased for 7 years. To counteract this problem, tunnel states (which are temporary health states) are sometimes used in Markov models.
The article by Slover et al. (Citation2006) contains an example of a Markov decision model. This study analyzedthecost-effectivenessofunicompartmental and total knee arthroplasty in elderly patients. The model was designed by making clinical pathways for all patients and assigning costs and QALYs to all health states, and suggested similarity between the cost and effectiveness profiles of the two treatment groups of elderly, low-demand patients.
Uncertainty in economic evaluations
According to Drummond et al. (Citation2005), there are several types of uncertainty: methodological disagreement (what are the assumptions we made?), data requirement (have the data been calculated in the best possible way?), the need to extrapolate results over time or from intermediate to final health outcomes, and uncertainty about generalizing the results to another setting (e.g. to other hospitals or countries). The following summarizes how to deal with the major types of uncertainty.
Methodological uncertainty
Sensitivity analyses can be used on trial- or model-based economic evaluations to handle methodological uncertainty. Sensitivity analysis can be performed in several ways. The simplest form is oneway analysis, where each parameter is varied one at a time to investigate the effect on study results. Other approaches are scenario analysis (best-case and worst-case scenarios) and threshold analysis, in which critical values of a parameter are identified (e.g. by how much can I increase the price of the intervention for it to be still “cost-effective” compared to an existing treatment?). However, uni-variate sensitivity analysis cannot deal with combined variability of different factors.
Parameter uncertainty in models
In probabilistic sensitivity analysis, model parameters are varied simultaneously by randomly drawing values from predefined distributions through the use of second-order Monte Carlo simulations (Drummond et al. Citation2005). This results in a large number of expected costs and effects (Drummond et al. Citation2005). With Monte Carlo simulations, the robustness of the results against changes in parameter values can be tested and confidence intervals around the ICER calculated.
Probabilistic sensitivity analysis is said to be an important step in using the uncertainty of economic evaluations in decision making. Probabilistic sensitivity analysis generates a more realistic representation of uncertainty in the model's results, and presents this for decision makers in a comprehensible manner (Briggs et al. Citation2004, Claxton et al. Citation2005).
Sample variability in trials
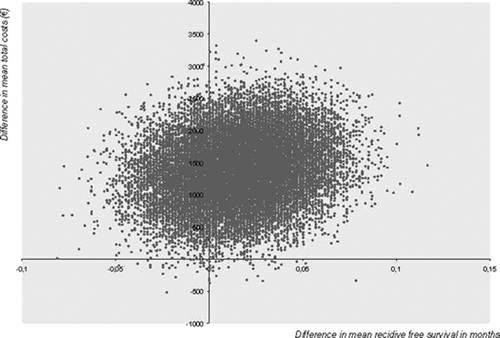
Bootstrapping, a non-parametric method, consists of drawing a sample of patients from the database (equally sized as the original dataset in both groups: treatment as well as control group) with replacement. “With replacement” means that, within a group, each patient can be drawn several times, or not at all. For this new, bootstrapped sample, the mean costs and effects associated with each group are calculated to derive the ICER. This process is repeated a number of times (generally hundreds of times) to determine the ICER and its 95% confidence interval, which can be calculated in various ways (Thompson and Barber Citation2000, Drummond et al. Citation2005). By creating a pool of bootstrap datasets originating from the original dataset, bootstrapping provides an estimate of the variability of the original sample, thus allowing computation of the ICER and its 95% CI from these re-samples. is an example of a plot with bootstrapped costs and effects.
Figure 4. Bootstrap of cost and effect pairs from a trial-based analysis.
An alternative to bootstrapping is Fieller's method, a parametric method. This method can calculate a confidence interval for skewed data, using difference in mean costs, difference in mean effects, variance of cost difference, variance of effect difference, covariance of difference in mean costs, and difference in mean effects (Drummond et al. Citation2005). The method assumes that costs and effects follow a joint normal distribution (O'Brien and Briggs Citation2002).
Presenting uncertainty of results
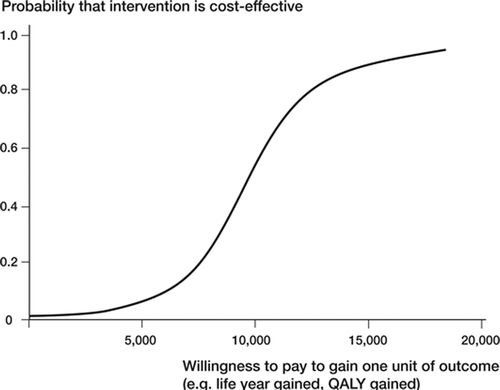
To summarize uncertainty in economic evaluations, it is possible to create a cost-effectiveness acceptability curve (Lothgren and Zethraeus Citation2000, Fen-wick et al. 2004, Canadian Agency for Drugs and Technologies in Health 2006, Bryan et al. Citation2007). A cost-effectiveness acceptability curve (CEAC) shows for several threshold values the probability that a treatment is cost-effective compared to another treatment when uncertainty is taken into account for various decision-maker thresholds (i.e. WTP values per unit of health gain). The shape of the CEAC depends on the cost-effectiveness plane from which the CEAC graph is a transformation (Fenwick et al. Citation2004). shows an example of a CEAC indicating what society would be willing to pay per QALY gained or life year gained. For example, at 5,000 € per QALY gained, the probability that the new treatment will be cost-effective is less than 0.2 when uncertainty is taken into account. If society is willing to pay 15,000 € per QALY gained, then the probability of the new intervention being cost-effective will be more than 0.8. Whether or not this new treatment should be implemented is up to the decision makers. However, by presenting the probability of a new intervention being cost-effective at different threshold values, a CEAC may help decision makers who have to make decisions under conditions of uncertainty and in relation to their own threshold values. A CEAC thus provides information about uncertainty in cost-effectiveness (Fenwick et al. Citation2004).
Figure 5. Cost-effectiveness (€) acceptability curve.
Critical appraisal of HTA
Several checklists have been developed to help evaluate the fullness of an economic evaluation (Drummond and Jefferson Citation1996, Drummond et al. Citation2005, Canadian Agency for Drugs and Technologies in Health 2006). These checklists contain several criteria such as whether the research question has been stated in an answerable form, whether the effectiveness of the programme has been established, whether all costs and consequences have been identified for each alternative, and whether sensitivity analysis has been conducted.
Recent methodological advances
Generalizability and transferability
Generalizability (or applicability) is a major problem. How can data from one country be interpreted and applied to other countries (Oostenbrink et al. Citation2002, Canadian Agency for Drugs and Technologies in Health 2006, Goeree et al. Citation2007)? Sensitivity analysis can be a tool for evaluation of the local findings and to make a prediction about applicability in, for example, the rest of the country by taking a regional parameter into account (Canadian Agency for Drugs and Technologies in Health, 2006).
Dealing with international clinical trials
When dealing with an economic evaluation alongside an international clinical trial, there are several methodological challenges. Analysis and interpretation of cost data can lead to strong and potentially misleading conclusions, when there is a lack of statistical awareness (Barber and Thompson Citation1998). Due to differences in relative prices, treatment patterns, and delivery of healthcare, it may be difficult to pool utilization of resources and also costs in different countries, and the ICER may be different from one country to another. Recently, multi-level models have been advocated to take into account the multidimensional aspect of international trials (e.g. country, hospital, and patient) while being able to present ICERs for each participant country without having to throw away data by using only the data from this country (Manca et al. Citation2005, Manca and Willan Citation2006).
Discussion
It is becoming more and more evident to decision makers that economic evaluations have to play an important role in the decision making. However, a review of the economic literature in total hip arthroplasty has shown that most of these economic studies were cost-minimization studies and were conducted from a narrow perspective (i.e. from the standpoint of the payer). In addition, only a few considered a time horizon of more than a year and less than 25% made use of sensitivity analyses to test the robustness of their results.
In conclusion, here are some recommendations. If you are planning to include an economic analysis as part of a trial, it is important to design the economic evaluation at the start of the clinical trial in order to collect all the data necessary to conduct this evaluation. When choosing the standpoint for the economic evaluation: a societal perspective is the broadest, most complete view and might be preferred to a narrower perspective (e.g. the payer standpoint), depending on the specifics of the study. When it is unfeasible or impractical to perform a clinical trial, or when it is necessary to extrapolate the data outside the follow-up time of the trial, or when there is a need to integrate several comparators, you may need to use modeling techniques. In both trial- and model-based economic evaluations, however, uncertainty in economic evaluation of healthcare programmes must always be explored extensively through the use of appropriate techniques for handling different types of uncertainty.
While there is no shortage of guidelines and textbooks with advice on conducting economic analyses, it is our hope that this article will help to give a better understanding of some key concepts in economic evaluations—and that it will be useful when designing an economic study.
- Barber J A, Thompson S G. Analysis and interpretation of cost data in randomised controlled trials: review of published studies. BMJ 1998; 317: 1195–200
- Bozic K J, Saleh K J, Rosenberg A G, Rubash H E. Economic evaluation in total hip arthroplasty: analysis and review of the literature. J Arthroplasty 2004; 19: 180–9
- Briggs A H, O'Brien B J. The death of cost-minimization analysis?. Health Econ 2001; 10: 179–84
- Briggs A, Sculpher M, Dawson J, Fitzpatrick R, Murray D, Malchau H. The use of probabilistic decision models in technology assessment: the case of total hip replacement. Appl Health Econ Health Policy 2004; 3: 79–89
- Briggs A, Claxton K, Sculpher M. Decision Modelling for Health Economic Evaluation. Handbooks for Health Economic Evaluation. Oxford University press. 2006
- Bryan S, Williams I, McIver S. Seeing the NICE side of cost-effectiveness analysis: a qualitative investigation of the use of CEA in NICE technology appraisals. Health Econ 2007; 16: 179–93
- Buxton M J. Economic evaluation and decision making in the UK. Pharmacoeconomics 2006; 24: 1133–42
- Buxton M J, Drummond M F, Van Hout B A, Prince R L, Sheldon T A, Szucs T, Vray M. Modelling in economic evaluation: an unavoidable fact of life. Health Econ 1997; 6: 217–27
- Canadian Agency for Drugs and Technologies in Health. Guidelines for the economic evaluation of health technologies. Ottawa 2006
- Claxton K, Sculpher M, McCabe C, Briggs A, Akehurst R, Buxton M, Brazier J, O'Hagan T. Probabilistic sensitivity analysis for NICE technology assessment: not an optional extra. Health Econ 2005; 14: 339–47
- Drummond M F, Jefferson T O. Guidelines for authors and peer reviewers of economic submissions to the BMJ. The BMJ Economic Evaluation Working Party. BMJ 1996; 313: 275–83
- Drummond M F, Richardson W S, O'Brien B J, Levine M, Heyland D. Users' guides to the medical literature. XIII. How to use an article on economic analysis of clinical practice. A. Are the results of the study valid? Evidence-Based Medicine Working Group. JAMA 1997; 277: 1552–7
- Drummond M F, Sculpher M F, Torrance G W, O'Brien B J, Stoddart G L. Methods for the Economic Evaluation of Health Care Programmes. Oxford University Press, New York 2005
- Fenwick E, O'Brien B J, Briggs A. Cost-effectiveness acceptability curves--facts, fallacies and frequently asked questions. Health Econ 2004; 13: 405–15
- Fielden J M, Cumming J M, Horne J G, Devane P A, Slack A, Gallagher L M. Waiting for hip arthroplasty: economic costs and health outcomes. J Arthroplasty 2005; 20: 990–7
- Garber A M, Phelps C E. Economic foundations of cost-effectiveness analysis. J Health Econ 1997; 16: 1–31
- George B, Harris A, Mitchell A. Cost-effectivEness Analysis And The Consistency Of Decision Making: evidence from pharmaceutical reimbursement in australia 1991 to 1996. Pharmacoeconomics 2001; 19: 1103–9
- Goeree R, Burke N, O'Reilly D, Manca A, Blackhouse G, Tarride J E. Transferability of economic evaluations: approaches and factors to consider when using results from one geographic area for another. Curr Med Res Opin 2007; 23: 671–82
- Gold M R, Siegel J E, Russel L B, Weinstein M C. Cost-Effectiveness in Health and Medicine. Oxford University Press, New York 1996
- Gonano C, Leitgeb U, Sitzwohl C, Ihra G, Weinstabl C, Kettner S C. Spinal versus general anesthesia for orthopedic surgery: anesthesia drug and supply costs. Anesth Analg 2006; 102: 524–9
- Goodacre S, McCabe C. An introduction to economic evaluation. Emerg Med J 2002a; 19: 198–201
- Goodacre S, McCabe C. Being economical with the truth: how to make your idea appear cost effective. Emerg Med J 2002b; 19: 301–4
- Gordois A, Posnett J, Borris L, Bossuyt P, Jonsson B, Levy E, de P G. The cost-effectiveness of fondaparinux compared with enoxaparin as prophylaxis against thrombo-embolism following major orthopedic surgery. J Thromb Haemost 2003; 1: 2167–74
- Kaplan R M, Alcaraz J E, Anderson J P, Weisman M. Quality-adjusted life years lost to arthritis: effects of gender, race,and social class. Arthritis Care Res 1996; 9: 473–82
- Kocher M S, Henley M B. It is money that matters: decision analysis and cost-effectiveness analysis. Clin Orthop 2003; 106–16
- Laupacis A, Feeny D, Detsky A S, Tugwell P X. How attractive does a new technology have to be to warrant adoption and utilization? Tentative guidelines for using clinical and economic evaluations. CMAJ 1992; 146: 473–81
- Liljas B, Karlsson G S, Stalhammar N O. On future non-medical costs in economic evaluations. Health Econ 2007
- Lothgren M, Zethraeus N. Definition, interpretation and calculation of cost-effectiveness acceptability curves. Health Econ 2000; 9: 623–30
- Manca A, Willan A R. ‘Lost in translation’: accounting for between-country differences in the analysis of multinational cost-effectiveness data. Pharmacoeconomics 2006; 24: 1101–19
- Manca A, Rice N, Sculpher M J, Briggs A H. Assessing gen-eralisability by location in trial-based cost-effectiveness analysis: the use of multilevel models. Health Econ 2005; 14: 471–85
- Meltzer D. Accounting for future costs in medical cost-effectiveness analysis. J Health Econ 1997; 16: 33–64
- Mooney A. Quality of life: questionnaires and questions. J Health Commun 2006; 11: 327–41
- Nemeth G. Health related quality of life outcome instruments. Eur Spine J (Suppl 1) 2006; 15: S44–S51
- Nyman J A. Should the consumption of survivors be included as a cost in cost-utility analysis?. Health Econ 2004; 13: 417–27
- O'Brien B. Economic evaluation of pharmaceuticals. Frankenstein's monster or vampire of trials?. Med Care 1996; 34: DS99–108
- O'Brien B J, Briggs A H. Analysis of uncertainty in health care cost-effectiveness studies: an introduction to statistical issues and methods. Stat Methods Med Res 2002; 11: 455–68
- Oostenbrink J B, Koopmanschap M A, Rutten F F. Standardisation of costs: the Dutch Manual for Costing in economic evaluations. Pharmacoeconomics 2002; 20: 443–54
- Polly D W, Jr, Glassman S D, Schwender J D, Shaffrey C I, Branch C K, Burkus J, Gornet M F. SF-36 PCS benefit-cost ratio of lumbar fusion comparison to other surgical interventions: a thought experiment. Spine 2007; 32: S20–S26
- Reitman C A, Watters W C, III, Sassard W R. The Cell Saver in adult lumbar fusion surgery: a cost-benefit outcomes study. Spine 2004; 29: 1580–3
- Ritter M A, Albohm M J. Overview: maintaining outcomes for total hip arthroplasty. The past, present, and future. Clin Orthop 1997, 344: 81–7
- Robinson R. Cost-benefit analysis. BMJ 1993a; 307: 924–6
- Robinson R. Cost-effectiveness analysis. BMJ 1993b; 307: 793–5
- Robinson R. Cost-utility analysis. BMJ 1993c; 307: 859–62
- Robinson R. Costs and cost-minimisation analysis. BMJ 1993d; 307: 726–8
- Robinson R. Economic evaluation and health care. What does it mean? BMJ 1993e; 307: 670–3
- Saleh K J, Gafni A, Saleh L, Gross A E, Schatzker J, Tile M. Economic evaluations in the hip arthroplasty literature: lessons to be learned. J Arthroplasty 1999; 14: 527–32
- Slover J, Espehaug B, Havelin L I, Engesaeter L B, Furnes O, Tomek I, Tosteson A. Cost-effectiveness of unicompartmental and total knee arthroplasty in elderly low-demand patients. A Markov decision analysis. J Bone Joint Surg Am 2006; 88: 2348–55
- Thompson S G, Barber J A. How should cost data in pragmatic randomised trials be analysed?. BMJ 2000; 320: 1197–200
- Udvarhelyi I S, Colditz G A, Rai A, Epstein A M. Cost-effectiveness and cost-benefit analyses in the medical literature. Are the methods being used correctly?. Ann Intern Med 1992; 116: 238–44
- Weinstein M C, Stason W B. Foundations of cost-effectiveness analysis for health and medical practices. N Engl J Med 1977; 296: 716–21
- Welte R, Feenstra T, Jager H, Leidl R. A decision chart for assessing and improving the transferability of economic evaluation results between countries. Pharmacoeconomics 2004; 22: 857–76