Abstract
Background and purpose Polyethylene wear is an important cause of aseptic loosening in hip arthroplasty. Detection of significant wear usually happens late on, since available diagnostic techniques are either not sensitive enough or too complicated and expensive for routine use. This study evaluates a new approach for measurement of linear wear of metal-backed acetabular cups using CT as the intended clinically feasible method.
Material and methods 8 retrieved uncemented metal-backed acetabular cups were scanned twice ex vivo using CT. The linear penetration depth of the femoral head into the cup was measured in the CT volumes using dedicated software. Landmark points were placed on the CT images of cup and head, and also on a reference plane in order to calculate the wear vector magnitude and angle to one of the axes. A coordinate-measuring machine was used to test the accuracy of the proposed CT method. For this purpose, the head diameters were also measured by both methods.
Results Accuracy of the CT method for linear wear measurements was 0.6 mm and wear vector angle was 27°. No systematic difference was found between CT scans.
Interpretation This study on explanted acetabular cups shows that CT is capable of reliable measurement of linear wear in acetabular cups at a clinically relevant level of accuracy. It was also possible to use the method for assessment of direction of wear.
Loosening in hip replacement may be triggered by wear particles from the acetabular component (Mohanty Citation1996, Revell et al. Citation1997). Today, it is difficult to measure small amounts of significant wear in vivo without using an invasive method such as radiostereometric analysis (RSA) (Schewelov et al. Citation2004). Several wear measurement techniques have been developed, ranging from single radiographic techniques to 3-dimensional (3D-) reconstructions. The methods used today are, however, difficult to use in clinical practice. For example, the common method of using anterior-posterior (AP) radiographs for monitoring wear is difficult in clinical routine since the position and orientation of the wear tract must be guessed and the accuracy tends to be less than under laboratory conditions (Clarke et al. Citation1976). Reliable methods of wear measurement for the clinical situation are essential in order to predict failure, and they would also improve the power of clinical studies of new implants and detection of clinically significant wear differences at an earlier stage.
For visual assessment in both 2D and 3D, current multislice CT offers accurate spatial volume resolution without significant distortion. Metal artifacts, historically contraindicating CT examinations in the presence of implants, are now suppressed by software algorithms provided by the CT manufacturers. We have shown that 3D-CT can be used for evaluation of acetabular cup position and migration (Olivecrona et al. Citation2002, Citation2003c, Citation2004). A study with retrievals showed that CT can be used for measurement of the 3D penetration of the femoral head into the cup at a level of accuracy of 1 mm (Olivecrona et al. Citation2005). Theoretically, it should be possible to integrate the principle of a coordinate measurement machine into the software for analysis of the CT data. The idea relies on placing several landmarks on the 3D-CT surfaces of the head and cup. Spheres are then fitted to these data points and from that, the penetration of the femoral head into the acetabular cup is calculated.
We have now evaluated this 3D-CT method for measurement of the magnitude of linear wear at a clinically relevant level and compared our findings to the results of the previous study (Olivecrona et al. Citation2005). In addition, we have investigated the possibility of measuring the direction of linear wear.
Material and methods
Implants and CT examination
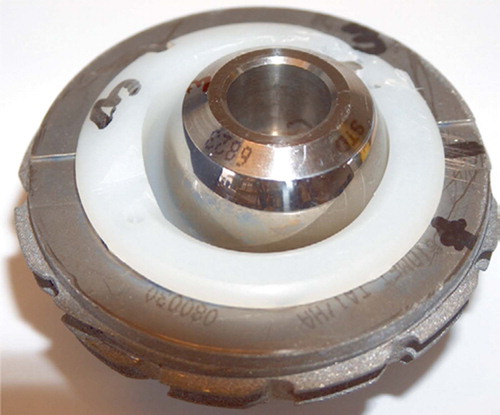
We used the same implants, CT examinations, and coordinate-measuring machine (CMM) data as in our previous publication (Olivecrona et al. Citation2005). Eight explanted acetabular cups (Romanus acetabular cup; Biomet, Warsaw, IN) and matching femoral heads were used (). Two examinations of each implant were done using a CT scanner (LightSpeed QX/I; General Electric Medical Systems, Milwaukee, WI). Volumes were acquired with 1.25 mm collimation and a pitch of 3 (0.75 mm/rotation), at 40 mA, 120 kV. Slices were reconstructed with 1.25 mm increments. To mimic different patient positions, the position of the implant in the CT scanner was altered between the scans. External pliers were used to seat the femoral head in the cup.
Figure 1. Acetabular cup, polyethylene liner, a titanium shell (52–58 mm outer diameter), and a femoral head (28 mm).
Coordinate measurements
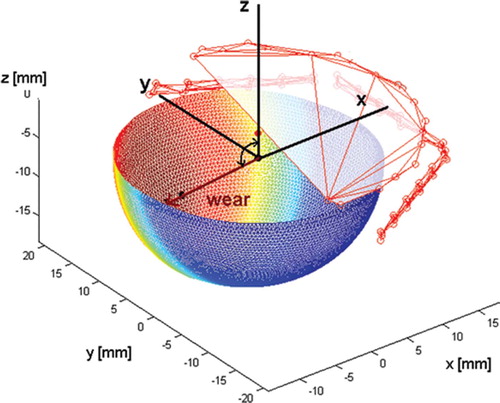
A coordinate-measuring machine (CMM) was used as a reference method. The inside of the liners were examined with a CMM using 8,000 evenly distributed digitizing points. Points on the collar of the PE liner and on the surfaces of the hexagonal locking device were used as reference planes for calculation of the wear vector angle. The deformation of the PE cup is a combination of wear and creep, whereas creep can be up to 0.14 mm over a 10-year period (Isaac et al. Citation1996). In this study we defined wear as a combination of wear and creep. The maximum depth of linear wear was calculated by fitting a theoretical sphere to the unworn region, and the maximum radial distance between the data points on the surface of this sphere and the worn region was calculated. About 200 points on 6 of the heads were used to calculate the head diameters (as 2 of the heads were missing at the time of CMM measurements). We defined the wear vector as the vector originating from the center of the unworn cup to the most worn point on the inner surface of the cup. The angle between this wear vector and the normal axis of the acetabular cup opening plane was calculated for determination of the direction of wear (). The basic linear algebra formula for an angle between two vectors (u and v) was used:
Figure 2. This figure from a CMM measurement shows the wear vector as an arrow and its angle to the normal axis of the acetabular cup opening.
CT image analysis
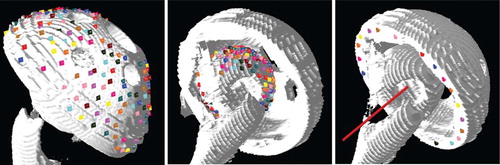
Image analysis of the CT volumes was performed using a validated 3D volume fusion tool (Maguire et al. Citation1991, Noz et al. Citation2001, Gorniak et al. Citation2003). In the CT volumes, the center of the prosthetic femoral head and the center point of the cup were determined along with the orientation of the normal axis to the surface of the cup opening. 200 evenly distributed coordinate points corresponding to the outer surface of the metal shell of the cup and the femoral head were designated respectively using a 3D point mode on 3D isosurfaces (). Secondly, 20 coordinate points on the face of the cup opening were designated using the same approach. The time used for each image analysis was restricted to 20 min. Using locally developed software and linear algebraic solutions, these point sets were used to fit spheres to the cup and the femoral head, and to compute the orientation of the normal axis to the plane of the cup opening. The algorithms used for this have been reported previously (Olivecrona et al. Citation2003a, Citationb). To filter out metal artifacts, the calculations for fitting the spheres were done in two iterations: first, a preliminary sphere was fitted to each point set, and secondly all landmark points with a distance of more than 0.5 mm (i.e. approximately 1 SD) from the surface of the sphere were eliminated, and a final sphere was fitted. We defined the wear vector as being the vector originating from the center of the cup to the center of the head. The angle between this wear vector and the normal axis was calculated using the above equation.
Figure 3. Landmarks on CT images of cup (left) and head (central), and landmarks and normal vector of horizontal reference plane (right) for determination of the wear vector angle. The normal axis is marked as a line in the right panel.
Statistics and evaluation of errors
Data were tested for normality using Bland-Altman plots, graphical evaluation with line of equality, and calculation of skewedness and kurtosis (Bland and Altman Citation1986). Confidence intervals were calculated using t-distribution. Accuracy, repeatability, and bias of the CT method were calculated at the 95% confidence level using the ISO definitions (ISO 3534: 3.11 and 3.14) (ISO Citation1998). Precision is defined as the closeness of agreement between independent test results obtained under stipulated conditions. For repeatability, as a way of expressing precision, we used ISO standards where the method under evaluation is the combined errors of acquisition of data with a CT unit and image postprocessing (ISO 3534: 3.14) (ISO Citation1998). Accuracy is defined as the closeness of agreement of a test result and the accepted reference value (according to CMM in this study). The term accuracy when applied to a set of test results refers to a combination of systematic errors (bias) and random errors (ISO 3534: 3.11) (ISO Citation1998).
Even though the spatial resolution of the CT scanner had previously been proven to be correct, we tested the method for systematic errors by computing an interval estimate of the bias (the mean error and the 95% confidence interval (CI) for the mean). Accuracy and repeatability were calculated at the 95% CI as described by Ranstam et al. (Citation2000).
Results
If the differences are normally distributed, 95% of the differences will lie within the 95% limits of agreement, i.e. the mean difference ± 1.96 times the standard deviation. Most or all of the data points were within these limits. The plots for measurement of linear wear and wear vector angle ( and ) revealed no evidence of systematic differences between CT and CMM. The plot for head diameter () shows a negative mean difference value that suggests an underestimation with CT. Accuracy and repeatability, along with an interval estimate of bias for the experiments, are given in . No significant systematic differences were found between repeated CT scans. The skewedness calculations showed little evidence of asymmetry for the linear wear, angle, and head measurements, while the kurtosis calculations showed that the distributions were less spread out than the normal distribution—especially for the head diameter measurements. The landmark points were normally distributed.
Figure 4. Difference against mean for CT and CMM measurements of linear wear (A) and of wear vector angle (B). (Notice that two of the points coincide in each case). Difference against mean for CT and CMM measurements of head diameter (C).
Table 1. Repeatability, accuracy, and interval estimate of bias at 95% confidence level for the proposed CT method
Linear wear of the 8 cups assessed with CMM varied between 0.21 and 4.58 mm, and the standard error of the mean difference between CT measurements of linear wear and CMM was 0.11 (−0.96 to 0.64) mm (). The mean difference between CT and CMM measurements of linear wear was −0.15 (95% CI: −0.39 to 0.09) mm.
Table 2. Results for linear wear from CT and CMM measurements on acetabular cups
The wear vector angles varied between 85° and 127° (). The standard error of the mean difference between CT measurements of wear vector angle and CMM measurements was 4.4° (−37.6° to 26.8°). This was within the precision limit of the CT method. The mean difference between CT and CMM measurements of wear vector angle was −0.66° (95% CI: –10.0 to 8.7).
Table 3. Wear vector angle against normal of acetabula cup opening plane measured with CMM and CT using dedicated software. Values are given in degrees
The heads had also become worn and the head diameters varied between 27.48 and 27.93 mm. Head diameter was underestimated by the CT method and the standard error of the mean difference of CT head diameter measurements relative to direct measurements with CMM was 0.06 (−0.85 to −0.24) mm. The mean difference of head diameter was −0.53 (95% CI: −0.40 to −0.65) mm.
The outer diameter of the cup could not be measured accurately by direct measurement since the surfaces were irregular from coating and bone fragments. An attempt was made to avoid the most irregular parts, but the range was over 0.5 mm; thus, the values could not serve as reference values.
Discussion
Our study has shown that it is possible to use CT for wear measurements of acetabular cups. The accuracy was 0.6 mm for wear detection. In vivo wear rate values of conventional acetabular cups range from 0.1 mm/year to 0.2 mm/year and total wear at revision is about 1–3.5 mm (Kabo et al. Citation1993). Acetabular cups with wear rates of below 0.1 mm/year can have a 90% survivorship after 25 years, while none of the cups with wear rates above 0.2 mm/year survive that long (Sochart Citation1999). This would mean that 3 years after implantation, CT can be used to detect wear in conventional acetabular cups. Using digitized AP radiographs combined with dedicated computer software, the accuracy was found to be 1.3 mm in a phantom study (Schewelov et al. Citation2004), while in a study resembling clinical routine, Clarke et al. (Citation1976) reported errors (2 SD) ranging from −1.8 to +1.2 mm for 1 mm of wear and from −4.4 to +0.8 mm for 4 mm of wear for manual assessment of wear when comparing two AP radiographs. Drawbacks of all 2D methods are the risk that the wear vector might be out of the plane of the radiograph, and the fact that the magnitude of the error depends on the degree of anteversion of the cup (Sychterz et al. Citation1997). The direction of wear in our retrieved cups was roughly perpendicular to the normal axis of the cup ( and ). Assuming that the cups were implanted in a normal position, a significant part of the wear would not be accounted for on standard AP radiographs. Some 3D methods have therefore been developed by adding a lateral view to the AP radiographs (Devane et al. Citation1997, Martell et al. Citation2003a). In vivo measurements showed improved accuracy and about 10–20% more wear was detected compared to 2D methods (Devane et al. Citation1997, Sochart Citation1999, Martell et al. Citation2003a). The precision of the 3D technique is, however, lower than for the 2D technique (Martell et al. Citation2003a). Also, the lateral view is often obstructed by the prosthesis. Today, the most accurate method is considered to be radiostereo-metric analysis (RSA) (Kärrholm et al. Citation1997). In a phantom study the accuracy of the RSA digital measurements was found to be 0.42 mm with a mean measurement error of 0.01 mm (Schewelov et al. Citation2004). However, such methods are normally not available in clinical practice.
Our wear results are comparable to previously published data for the same implants from our group where circles in 3 planes were used instead of landmarks (Olivecrona et al. Citation2005). In that study, there were 2 outliers arising from examiner interpretation of metal artifacts. This was not an obvious problem with the present study, since those areas can easily be avoided when selecting landmarks and the greatest deviations from a sphere are also removed by filtering. The idea for the future is to generate the surface automatically or semi-automatically in order to make the method more easy to use and to minimize interpretation errors.
Our study was limited because of the small number of subjects, and the data should thus be interpreted with caution. Moreover, the backside wear is not measured with CMM but with CT.
Only the angle between the normal axis of the cup and the wear vector could be compared across the methods because the hexagonal locking mechanism between shell and liner allows for 6 positions. In a clinical situation, this would not be a problem because the direction of wear would be measured either relative to the pelvis or relative to a cup coordinate system.
It is possible to underestimate the wear if the head of the femoral component is not fitted into the most worn part of the polyethylene liner during the CT examination. Also, even with modern software, metal artifacts might still complicate interpretation of the image. This method presumes that the center of the femoral head coincides with the center of the unworn acetabular cup. This might be true for many hip prosthesis designs, but not for all of them. Sychterz et al. (Citation1997) found a mean difference of 1.1 mm between the centers from radiographs taken 3 weeks postoperatively. It is also common that there is a diametrical clearance of about 0–0.5 mm between head and cup, even though it is not stated by the manufacturer (Lewis et al. Citation2003). This would imply an initial displacement of the head inside the polyethylene liner. This was not accounted for in this study. The way to address this issue is to perform a postoperative scan, to attain a reference value for subsequent scans.
In conclusion, our study on a small series of explanted acetabular cups has shown that CT has the potential for reliable measurements of linear wear of acetabular cups at a clinically relevant level of accuracy. With due development and automation, this method may aid in identification of patients with increased risk of aseptic loosening.
G. Q. Maguire Jr., M. P. Zeleznik, B. Romanus, and S. Jonsson are gratefully acknowledged for their assistance with this work.
Contributions of authors
AJ: study design. CMM: evaluation, data analysis and statistics, literature search, manuscript preparation. MEN: CT image software programming, manuscript preparation. HO: study design, CT image analysis, manuscript preparation. LO: CT scans. AS: study design, supervision, manuscript preparation.
- Bland J M, Altman D G. Statistical methods for assessing agreement between two methods of clinical measurements. The Lancet 1986; 1(8476)307–10
- Clarke I C, Black K, Rennie C, Amstutz H C. Can wear in total hip arthroplasties be assessed from radiographs?. Clin Orthop 1976, 121: 126–42
- Devane P A, Horne G, Martin K, Coldham G, Krause B. Three-dimensional polyethylene wear of a press-fit titanium prosthesis. J Arthroplasty 1997; 12(3)256–66
- Gorniak R J T, Kramer E L, Maguire G Q J, Noz M E, Schettino C J, Zeleznik M P. Evaluation of a semi-automatic 3D fusion technique applied to molecular imaging and MRI brain/frame volume data sets. J Med Syst 2003; 27(2)141–56
- Isaac G H, Dowson D, Wroblewski B M. An investigation into the origins of time-dependent variation in penetration rates with Charnley acetabular cups-wear, creep or degradation. Proc Inst Mech Eng 1996; 210: 209–16
- ISO. Accuracy (trueness and precision) of measurement. International standard ISO. Switzerland 1998; 5725–1: 1994
- Kabo J M, Gebhard J S, Loren G, Amstutz H C. In vivo wear of polyethylene acetabular components. J Bone Joint Surg (Br) 1993; 75(2)254–8
- Kärrholm J, Herberts P, Hultmark P, Malchau H, Nivbrant B, Thanner J. Radiostereometry of hip prostheses: Review of methodology and clinical results. Clin Orthop 1997, 344: 94–110
- Lewis G, Fencl R M, Caroll M, Collins T. The relative influence of five variables on the in vitro wear rate of uncross-linked UHMWPE acetabular liners. Biomaterials 2003; 24: 1925–35
- Maguire G Q J, Noz M E, Rusinek H, Jaeger J, Kramer E L, Sanger J J, Smith G. Graphics applied to image registration. IEEE Computer Graphics Appl 1991; 11: 20–9
- Martell J M, Berkson E, Berger R, Jacobs J. Comparison of two and three-dimensional computerized polyethylene wear analysis after total hip arthroplasty. J Bone Joint Surg (Am) 2003a; 85(6)1111–7
- Martell J M, Verner J J, Incavo S J. Clinical performance of a highly cross-linked polyethylene at two years in total hip arthroplasty: A randomized prospective trial. J Arthroplasty (7 Suppl 1) 2003b; 18: 55–9
- Mohanty M. Cellular basis for failure of joint prosthesis. Bio Med Mater Eng 1996; 6: 165–72
- Noz M E, Maguire G Q J, Zeleznik M P, Kramer E L, Mahmoud F, Crafoord J. A versatile functional-anatomic image fusion method for volume data aets. J Med Syst 2001; 25: 297–307
- Olivecrona L, Crafoord J, Olivecrona H, Noz M E, Maguire G Q J, Zeleznik M P, Svensson L, Weidenhielm L. Acetabular component migration in total hip arthroplasty using CT and a semi-automated program for volume merging. Acta Radiol 2002; 43: 517–27
- Olivecrona H, Olivecrona L, Weidenhielm L, Stark A, Noz M E, Maguire G Q J, Zeleznik M P, Svensson L, Jonson T. Stability of acetabular axis after total hip arthroplasty. Repeatability using CT and a semiautomated program for volume fusion. Acta Radiol 2003a; 44: 653–61
- Olivecrona H, Weidenhielm L, Olivecrona L, Noz M E, Maguire G Q J, Zeleznik M P, Svensson L, Jonson T. Spatial component position in total hip arthroplasty. Accuracy and repeatability with a new CT method. Acta Radiol 2003b; 44: 84–91
- Olivecrona L, Olivecrona H, Weidenhielm L, Noz M E, Maguire J R G Q, Zeleznik M P. Model studies on acetabular component migration in total hip arthroplasty using CT and a semi-automated program for volume merging. Acta Radiol 2003c; 44: 419–29
- Olivecrona H, Weidenhielm L, Olivecrona L, Beckman M O, Stark A, Noz M E, Maguire J R G Q, Zeleznik M P, Svensson L, Jonson T. A new CT method to measure cup orientation after Total Hip Arthroplasty. A study on 10 patients. Acta Orthop Scand 2004; 75: 253–60
- Olivecrona L, Jedenmalm A, Aspelin P, Weidenhielm L, Noz M E, Maguire J R G Q, Zeleznik M P, Olivecrona H. Assessing wear of the acetabular cup using computed tomography: an ex vivo study. Acta Radiol 2005; 46: 852–7
- Ranstam J, Ryd L, Onsten I. Accurate accuracy assessment. Review of basic principles. Acta Orthop Scand 2000; 71(1)106–8
- Revell P A, Al-Saffar N, Kobayashi A. Biological reaction to debris in relation to joint prostheses. Proceedings of the Institution of Mechanical Engineers. Part H. J Eng Med 1997; 211: 187–97
- Schewelov T, Sanzén L, Bürlin N, Markusson P, Önsten I. Accuracy of radiographic and radiostereometric wear measurement of different hip prostheses: an experimental study. Acta Orthop Scand 2004; 75(6)691–700
- Sochart D H. Relationship of acetabular wear to osteolysis and loosening in total hip arthroplasty. Clin Orthop 1999, 363: 135–50
- Sychterz C J, Engh C A, Shah N, Engh C A. Radiographic evaluation of penetration by the femoral head into the polyethylene liner over time. J Bone Joint Surg (Am) 1997; 79: 1040–6