Abstract
Background and purpose The collection of multi-ligament knee reconstruction procedure data generates long tabulated lists of featureless abbreviations, which are often difficult to interpret and present. As demonstrated with the launch of the Scandinavian anterior cruciate ligament registries, such data are under increasing scrutiny. When developing a visual tool to improve the interpretation, presentation, and ongoing collection of data within this field, much can be learnt from the historical teachings of Florence Nightingale and John Venn.
Methods Unknown to many, Florence Nightingale was a pioneer of graphic data illustration, becoming a Fellow of the Royal Statistical Society in 1858. Further advances in the visualization of complex data relations were made by John Venn, who introduced the Venn diagram in 1880. With this background in mind, the present work has been based upon the senior author's case series of 70 patients undergoing complex knee-ligament reconstruction at Warrington Hospital, from 2001 to the present time.
Results and interpretation Although obviously not negating the need for tabulated data, the graphic representation put forward here successfully supplements featureless tabulated lists of abbreviations and can be updated easily and regularly. Providing a clear, bright illustration that is free from patient identifiers, it can be used in presentations and publications, and freely accessed by a multidisciplinary team. It assists in the identification of injury patterns, can accommodate illustration of associated factors such as meniscal injury, and clearly demonstrates each hospital's multi-ligament knee reconstruction experience. This facilitates comparison and collaboration between hospitals and promotes research.
Information gathering is the cornerstone of audit and research, and frequently leads to complex data interpretation. The collection of data from multi-ligament knee reconstruction procedures generates long tabulated lists of featureless abbreviations, which are often difficult to interpret and present. As demonstrated with the launch of the Scandinavian anterior cruciate ligament (ACL) registries, such data are receiving increasing scrutiny (Eriksson Citation2006, Forssblad Citation2007).
Conversion of bewildering lists of data into graphic illustration permits the breakdown of this information into smaller, more manageable components and provides much-needed clarity. When developing a visual tool to improve the interpretation, presentation, and ongoing collection of data within this field, much can be learnt from the historical teachings of Florence Nightingale and John Venn.
Unknown to many, Florence Nightingale was a pioneer of graphic data illustration, becoming a Fellow of the Royal Statistical Society in 1858. Further advances in the visualization of complex data relations were made by John Venn, the British logician and philosopher, who introduced the Venn Diagram in 1880.
Patients and methods
A case series of 70 patients undergoing complex knee-ligament reconstruction under the care of the senior author (MJM) at Warrington Hospitals, from July 2001 to the present time, provided the basis for this work. All pertinent information was collected using the Warrington Knee Injury Database (WKID).
The WKID involves prospective data collection on all knee ligament injury patients undergoing surgical management at Warrington Hospitals. It employs Lysholm, KOOS (knee injury and osteoarthritis outcome score), and the entire IKDC 2000 document (International Knee Documentation Committee); data collection is computer based, commencing preoperatively and continuing postoperatively. WKID software is available online at www.mcnicholaskneeclinic.co.uk/wkid. htm, where a database and user guide can be downloaded free of charge. This database has recently been adopted by the British Orthopedic Sports Trauma Association (BOSTA) as its chosen knee injury data collection tool.
A well-designed comprehensive database is a valuable resource, but requires that the data is easily accessible and easy to interpret. The interpretation and presentation of complex data has always presented a challenge. Consequently, when attempting to improve data illustration in complex multi-ligament knee reconstruction surgery, we should not forget the work of those who have gone before us.
Florence Nightingale (1820–1910)
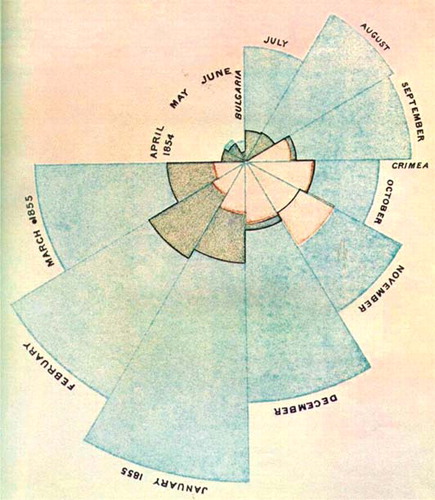
Nightingale is remembered as a pioneer of nursing and a reformer of hospital sanitation methods. However, she was also an innovator in the collection, tabulation, interpretation, and illustration of descriptive statistics. During the Crimean War, she invented the polar-area diagram to add clarity and weight to mortality data and to demonstrate its correlation with unsanitary conditions.
Named after her birthplace, and the daughter of a wealthy landowner, Florence Nightingale was born in Italy on May 12, 1820. Raised mostly in Derbyshire, England, she received a good education, studying Greek, Latin, French, German, Italian, history, philosophy, and mathematics.
At 25 years of age, and after rejecting several auspicious marriage proposals, she informed her parents that she wished to become a nurse. Unsurprisingly, this was met with disapproval as nursing was considered a menial job for the working classes, and inappropriate for a well educated woman. Nonetheless, she began her training in Alexandria, Egypt in 1850 and subsequently studied in Kaiserwerth, Germany. In 1853, she became superintendent of the Hospital for Invalid Gentlewomen in London.
In March 1853, Russia invaded the Crimea. Britain and France went to the aid of Turkey in what was to become known as the Crimean War. Soon after arrival, the British army began to suffer mortalities from diseases such as typhus, dysentery, and cholera.
Nightingale volunteered her services and was eventually given permission to take a group of 38 nurses to Turkey. Deaths in the British field hospitals reached a peak during January 1855, when 2,761 soldiers died of contagious diseases, 83 from wounds, and 324 from other causes. Calculating the mortality rate, Nightingale reported that if this rate were to continue, and troops not frequently replaced, contagious disease alone would kill the entire British army in the Crimea.
Nightingale developed and employed the polararea diagram to illustrate her findings graphically. The area of each colored wedge, measured from the center as a common point, is in proportion to the statistic it represents. The blue outer wedges represent deaths from “preventable or mitigable zymotic diseases”: that is, contagious diseases such as cholera and typhus. The central wedges, originally red, but now faded and appearing beige, show the deaths from wounds. The wedges in-between, originally black, represent deaths from all other causes (Nightingale Citation1858).
She revolutionized the idea that social phenomena could be subjected to mathematical analysis, and using statistics, she graphically illustrated the need for sanitary reform. Her work to improve conditions in military hospitals carried over to the general public, and in 1860 the Nightingale Training School and Home for Nurses opened at St. Thomas's Hospital in London.
Nightingale published 200 books, reports, and pamphlets. She became the first woman Fellow of the Royal Statistical Society in 1858, and an honorary member of the American Statistical Association in 1874. At 90 years of age, Florence Nightingale died on August 13, 1910.
John Venn (1834–1923)
Graphic illustration can help clarify complexity in all fields of audit and research; one such field of extreme complexity is that of genetics. Here, Venn diagrams are commonly employed to aid visualization of complex genetic set relations (Breitling Citation2005, Kestler Citation2005, Perez-Carreon Citation2006).
A non-mathematical definition of the Venn diagram would be a method in which mathematical sets or terms of a categorical statement are represented by overlapping circles within a boundary representing the universal set, so that all possible combinations of the relevant properties are represented by the various distinct areas in the diagram.
Venn diagrams were introduced in 1880 by John Venn, M.A., Fellow and Lecturer in Moral Science at Caius College, Cambridge University. He published his first book “Symbolic Logic” in 1881, and “The Principles of Empirical Logic” in 1889. The first use of the term “Venn diagram” is thought to have been in the book “A Survey of Symbolic Logic” by Clarence Irving Lewis, in 1918.
There are several variants of the Venn diagram, each being assigned its inventor's name. However, each shares the basic principle popularized by Venn—and his name is generally accredited with data illustration of this kind.
With this historical background in mind, we applied the principles of Nightingale and Venn to our multi-ligament knee reconstruction database. Our aim was to clarify this information through graphic illustration, and create an accessible data source that would be capable of facilitating continuous data collection, interpretation, and presentation.
Results
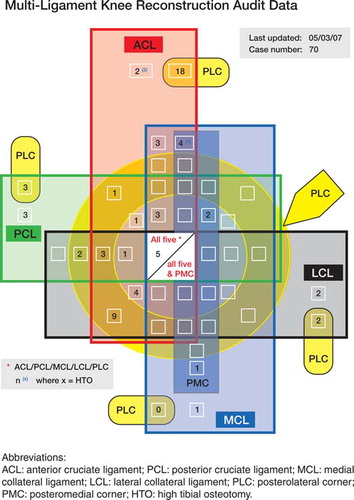
The above illustration is populated with the senior author's multi-ligament knee reconstruction experience at Warrington Hospitals from July 2001 to the present time. Although initially appearing highly complex, its simple structure soon becomes evident, resulting in user-friendly data illustration. Employing the principles of Venn, it is relatively self-explanatory, with each of the 6 possible ligament components being represented within its own individual boundary. These boundaries overlap, to enable illustration of all possible combinations. Only one predetermined assumption is made, this being that all posteromedial corner (PMC) reconstructions will be performed in conjunction with medial collateral ligament (MCL) reconstruction.
Superscript figures in blue denote high tibial osteotomies (HTO). For example, considering the illustration above, 2 independent ACL reconstructions have been included within these data, both of which were performed in conjunction with HTO. Provision for the independent inclusion of posterolateral corner (PLC) reconstruction with each individual ligament was incorporated to improve clarity.
The illustration can accommodate any associated data pertinent to each ligamentous injury combination. For example, using the prefix letters M, L, and B (signifying medial, lateral, and both menisci, respectively), associated meniscal injury data can be illustrated. However, the addition of further data to a single illustration leads to greater complexity and detracts from the principal aim of the project, to improve clarity. Consequently, we advocate using individual diagrams: the primary illustration quantifying each ligamentous injury combination, and secondary diagrams revealing further data associated with each of these combinations—such as meniscal injury. Direct comparison is then possible without loss of clarity.
The graphic illustration clearly demonstrates that, within our case series, the most common complex knee ligament injury involves the ACL and PLC. Although not presented here, further illustration of meniscal injuries reveals that, of these 18 patients, 13 were found to have meniscal injuries (4 medial, 5 lateral, and 4 other patients with both medial and lateral injuries). The second most common injury, with 9 patients, involved ACL, LCL, and PLC. One of these patients had injury to both the medial and the lateral meniscus.
Discussion
Projects such as the Scandinavian ACL registries demonstrate the increasing scrutiny that knee-ligament reconstruction surgery is receiving. Following an initiative from the Oslo Sports Trauma Research Centre, Norway, the world's first national ACL register started in June 2004. Sweden and Denmark launched comparable initiatives during 2005 and, with Italy embarking upon a similar project in 2006, the number of national ACL registries continues to grow.
Having common variables, the registries gather information such as etiology, associated injuries, and surgical technique. Their aim is to establish injury patterns, and to monitor treatment preferences, techniques, and outcomes. It is hoped that such data collection will lead to a greater understanding of, and progression toward, optimal treatment protocols and standardization.
There have been calls for the Scandinavian registries to be used as a template for a much larger internet-based resource (Eriksson Citation2006, Forssblad Citation2007). Such a resource would give every hospital the ability to compare their practice with that of the international community and, with such a pooling of data, large cohort studies would be feasible.
Large databases are only of value, however, if they can be accessed and interpreted with ease. Consequently, we return to the aim of this work, which has been to develop a visual tool capable of enhancing the interpretation, presentation, and continuous collection of multi-ligament knee reconstruction surgery data. Have we achieved our aim? Although obviously not negating the need for tabulated data, this graphic representation successfully animates featureless tabulated lists of abbreviations and can be updated easily and regularly. Providing a clear, bright illustration that is free from patient identifiers, it can be used in presentations and publications, and can be accessed freely by all members of a multidisciplinary team.
Furthermore, the diagram facilitates identification of injury patterns, can accommodate illustration of associated factors such as meniscal injury, and clearly demonstrates the multi-ligament knee reconstruction experience of each hospital. The clear depiction of each hospital's experience facilitates comparison, encouraging multicenter collaboration and promoting research.
- Breitling R, Armengaud P, Amtmann A. Vector analysis as a fast and easy method to compare gene expression responses between different experimental backgrounds. Bioinformatics, (published on-line) July 19, 2005 (7 screens). Available from http//www.biomed central. com/1471–2105/6/181
- Eriksson E. A European ACL Register. Knee Surg Sports Traumatol Arthrosc 2006; 14(4)309
- Forssblad M. About ACL Registries. Knee Surg Sports Traumatol Arthrosc, (Published on-line) Feb 6 2007 (1 Screen). Available from: http://www.springerlink.com/content/1433–7347/?k=about+acl+registries
- Kestler H A, Muller A, Gress T M, et al. Generalized Venn Diagrams: A new method of visualizing complex genetic set relations. Bioinformatics 2005; 21(8)1592–5
- Nightingale F. Notes on matters affecting the health, efficiency and hospital administration of the British army. London 1858
- Perez-Carreon J I, Lopez-Garcia C, Fattel-Fazenda S, et al. Gene expression profile related to the progression of preneoplastic nodules toward hepatocellular carcinoma in rats. Neoplasia 2006; 8(5)373–83