Abstract
Background and purpose Roentgen stereometric analysis (RSA) cannot discern whether a single prosthesis is fixed or migrating below the detection level. Samples of patients usually show migration values that appear to be continuously distributed. Is there such continuity, or is there a dichotomy between stable and migrating prostheses? The hypothesis of a dichotomy has, to our knowledge, not been tested. We present an exploratory evaluation of such a dichotomy using a mixture distribution algorithm.
Methods We analyzed the migration (as determined by RSA) of 147 cemented acetabular cups of 7 different designs by using a new set of algorithms for frequency distribution analysis called Rmix.
Results We first analyzed a migration vector, regardless of direction. After 2 years there was a significant dichotomy between 2 lognormal subgroups within the sample. Although some types of cups were over‐represented in one of the subgroups, neither cup design, sex, nor operating department could explain the dichotomy into two groups, which appears to reflect the existence of two basically different types of behavior of the cups. We next analyzed the migration along the 3 axes in space, and found a similar dichotomy. During the second year, around 80% of the patients belonged to a distinct, normally distributed subgroup with a mean not different from 0 mm and a small variation. The remainder differed significantly from this subgroup and showed migration.
Interpretation There is a dichotomy in migration pattern. During the second postoperative year, most cups belonged to a subpopulation that appeared stable. The remainder is probably at risk of loosening. For a single type of prosthesis, the relative size of the stable subgroup may be a good index of the expected performance. The possibility of detecting subgroups within a seemingly continuous sample might be useful in many fields of medicine.
Roentgen stereometric analysis (RSA) can describe the migration of a prosthesis relative to the bone (Selvik Citation1978). It has been shown that large postoperative migration predicts clinical loosening and need for revision (Kärrholm et al. Citation1994, Ryd et al. Citation1995). However, these studies analyzed mixed patient populations operated on in the 1980s with a large proportion of the patients needing revision rather soon. Due to the quality of the surgery at the time, migration was large in many cases. With the low revision rate seen in patients operated more recently, a new study to show whether RSA could still predict the risk of loosening would require more patients—for reasons of statistical power—than is practically possible. Alternatively, one would have to study a case mix known to have an extreme risk of loosening, but then the results might not be relevant to the average patient.
Although modern prostheses migrate less than before, there are still differences in mean values between groups. One could, however, question whether small but statistically significant differences in mean migration by RSA are clinically meaningful. In an attempt to address this problem, we have looked at the frequency distribution of migration values. If it is impossible to show a significant link between mean migration and revision rate for modern prostheses, it may still be possible to demonstrate that there are distinctly different postoperative courses. Such distinctions would imply the existence of categories of patients with different biology at the implant‐bone interface, and most probably with differences in risk of late loosening.
We have looked at cemented prostheses. Uncemented prostheses have been shown, by morphological studies, to sometimes be osseointegrated and sometimes not (Sychterz et al. Citation2002). The existence of different categories therefore appears likely. For cemented prostheses, however, it is unclear whether they can be regarded as either osseointegrated or not. If such a dichotomy exists, it should show up as discrete subpopulations in the frequency distribution of migration distances.
We analyzed acetabular cups, because their migration is likely to reflect the status of the cement‐to‐bone interface, whereas the behavior of stems is complicated by motion between the stem and the cement. Thus, we first hypothesized that the migration pattern of cemented acetabular cups comprises distinct subcategories, and secondly that one category does not migrate at all.
Patients and methods
Patients
The patients were operated on at the university hospitals in Linköping and Umeå between 1992 and 2002. They were all included in randomized comparisons between different designs of prosthesis or brands of cement (). The male to female ratio was 1:1. The mean age at operation was 69 (49–81) years. All patients were operated for primary osteoarthritis. The technique for fixing the cups included reaming of the acetabulum to bleeding bone, drilling multiple 5‐mm holes around the cavity, cleaning with high‐pressure lavage, and pre‐pressurization of the cement before the cup was inserted. All stems were cemented.
Table 1. Breakdown of patients analyzed
Data from some time points were missing, making the number of patients somewhat different in the 3 time periods studied: postoperatively to 1 year, postoperatively to 2 years, and 1 year to 2 years ().
RSA was done with a uniplanar technique with the patient lying supine and a film‐to‐focus distance of approximately 1.4 m. The postoperative examination was done after 3–5 days. The analysis was done with the UmRSA software from RSA Biomedical (Umeå, Sweden).
Choice of variables
We used the length of a vector (translation in any direction of the center of the cup's rigid body) as primary variable because it summarizes migration in 3 dimensions. Migration along a single axis would include variation due to different directions of migration, which could reduce the power of calculations without being relevant in our search for a dichotomy between stability and migration. Rotation around the axes is not included in our vector. This is a drawback, and the price one pays for getting a single variable to analyze. Moreover, there is no certainty that the center of the migrating rigid bodies is also the center of the cup. Thus, rotation around the center of the cup might dislocate the center of the rigid body and be falsely registered as migration. Despite of this problem, we considered vector length the best variable to express the extent to which the prosthesis is making its way through the bone.
By the use of vector length, we tested if patients could be divided in 2 categories. Vector length cannot be used to test whether one of these categories did not migrate at all. For this we used cup translation. A non‐migrating subgroup is expected to show a mean value for translation close to null and a variation similar to the measuring error. If there is a non‐migration subgroup, it would be expected to show up in all 3 dimensions. Thus, translation along all 3 axes (x, y, and z) was analyzed.
Statistics
The hypothesis of there being 2 or more distinct patterns of migration in prostheses implies that migration data should be a compound of statistical distributions. In order to determine what components make up this particular type of distribution, or mixed distribution, we used algorithms developed in the statistical computing language R (R Foundation for Statistical Computing, Vienna, Austria). The package of algorithms is called Rmix (http:// www.math.mcmaster.ca/peter/mix/mix.html). It permits estimation of the mean, standard deviation, and mixing proportions of a pre‐specified combination of distributions. Different combinations of distributions are then compared according to the Akaike's An Information Criterion (AIC) in order to determine which combination best fits the data.
Intuitively, one can think of this process as locating the model most likely to have generated the data, while correcting for the number of parameters in the model. The correction is needed since an increase in model parameters tends to enhance the model fit without reflecting any valuable information. The number generated by the AIC can therefore be thought of as corresponding to the probability that the given model generated the data, penalized with respect to its number of parameters.
The lengths of migration vectors were assumed to be a compound of log‐normal distributions. Components of the distribution of migrated distances along each axis were considered to be normal. The component corresponding to the stable group was expected to exhibit a zero mean value and a low standard deviation for each axis analyzed.
In order to examine whether the dichotomy in migrated distances could be explained by the sex of the patient, the type of prosthesis, or operating department we examined whether a certain patient group constituted, and was only present in, the migrating population. To do this, a cut‐off point was established. Its purpose was to supply a criterion for differentiation between cups in the migrating and stable populations. It was chosen as the intersection between the distributions of the stable and migrating cups (). If there was to be no overlap between the distribution of migrating and stable cups, we would expect all of the migrating cups to be located above the cut‐off point, and none to be located below. However, due to overlap (), the expected proportion of migrating cups was found to be 65% of the cups above the cut‐off point, and 1.2% of the cups below.
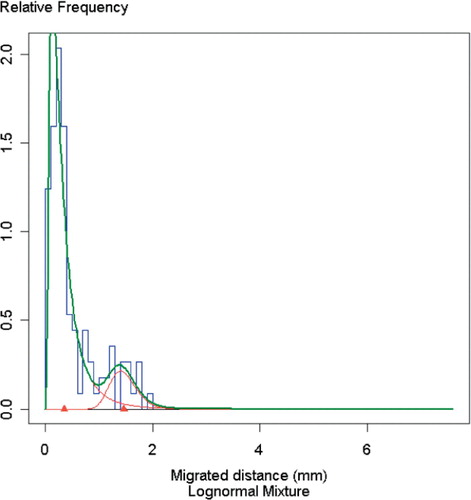
Figure 1. Frequency distribution of the length of the migration vector, postoperatively to 2 years. Blue lines indicate observations. Green and red lines indicate the estimated distributions under the assumption that the material consists of one or more groups with log‐normal distribution. Red triangles represent the means of the 2 subgroups.
Estimated proportions of sexes, prosthesis types, and locations—both above and below the cut‐off point—were then calculated (). An estimated proportion of close to 65%, followed by a corresponding proportion of close to 1.2% in the stable population, was interpreted as being an important factor for the existence of the dichotomy.
2 cases were defined as outliers based on the generally accepted criteria of Tukey (Citation1977), and they were removed from the analysis.
Table 2. Conditional probabilities of a cup being of a certain type, belonging to a man, a woman, or a certain operating department, given that its migration (vector 0–2 year) is below or above the cut‐off point
Results
After 1 year, the length of a migration vector for the center of the cup's rigid body showed a single log‐normal distribution, but after 2 years there was a dichotomy (p = 0.006) between 2 log‐normal subgroups within the sample: one comprising 89% of the patients with a mean migration of 0.44 (SD 0.06) mm, and the other with a mean migration of 1.49 (0.10) mm (). Although some types of cups were over‐represented in one of the subgroups, neither cup design, sex, nor operating department could explain the dichotomy of two groups, which appears to reflect the existence of two basically different types of behavior of the cups (). During the second postoperative year, there was also a dichotomy: 89% of the patients belonged to a subgroup with little or no migration (). (With the vector, measuring errors always produce positive values, so that small or no migration cannot be discerned).
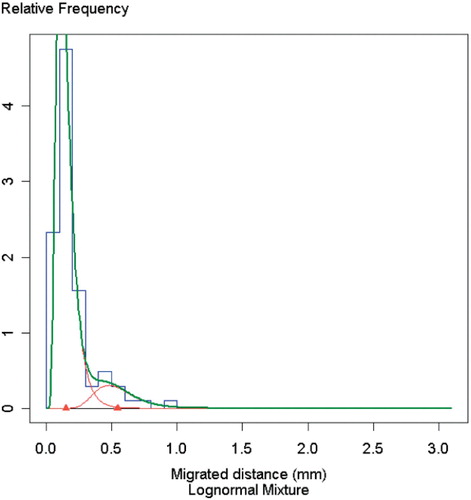
Figure 2. Frequency distribution of the length of the migration vector from 1 to 2 years. Blue lines indicate observations. Green and red lines indicate the estimated distributions under the assumption that the material consists of one or more groups with log‐normal distribution. Red triangles represent the means of the 2 subgroups.
We next analyzed the migration along the vertical axis, to test the hypothesis that one of the subgroups did not migrate at all. A dichotomy was found both at 1 and 2 years, but all subgroups showed migration from the postoperative position. During the second year, however, a subgroup with small variation was found, centered on zero migration. The existence of a stable subgroup was then confirmed by similar findings for translation along the other axes. The stable subgroup comprised 96, 79, and 67% of the patients for the x‐, y‐, and z‐axes (–). The variation in the size of the stable subgroup between axes was not statistically significant.
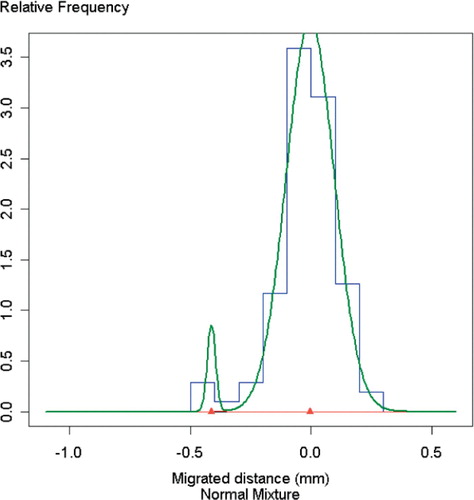
Figure 3. Frequency distribution along the x‐axis from 1 to 2 years. Blue lines indicate observations. Green and red lines indicate the estimated distributions under the assumption that the material consists of one or more groups with log‐normal distribution. Red triangles represent the means of the 2 subgroups.
The SD of the stable subgroup () corresponds to the error of the method. It was less than 0.1 mm for all 3 axes, which is similar to the result from 100 double examinations on the material from Linköping (Palm et al. Citation2007).
Figure 4. Frequency distribution along the y‐axis from 1 to 2 years. Blue lines indicate observations. Green and red lines indicate the estimated distributions under the assumption that the material consists of one or more groups with log‐normal distribution. Red triangles represent the means of the subgroups.
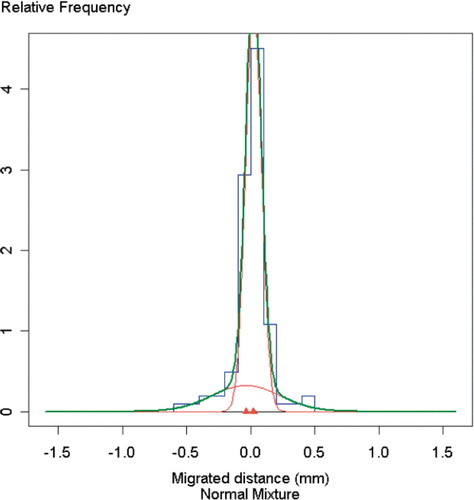
Figure 5. Frequency distribution along the z‐axis from 1 to 2 years. Blue lines indicate observations. Green and red lines indicate the estimated distributions under the assumption that the material consists of one or more groups with log‐normal distribution. Red triangles represent the means of the 2 subgroups.
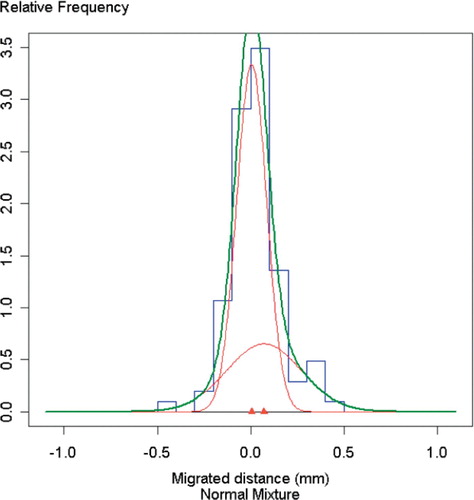
Table 3. Parameter estimates for mixture distributions. Component 1 corresponds to the distribution of the stable or less migrating population and component 2 to the distribution of the migrating population. The standard deviation for the estimate is given within parentheses
The models containing two components yielded the lowest AIC values (), and were therefore most likely to have generated the migration data (Akaike Citation1974). A corresponding p‐value of < 0.006, for the existence a dichotomy with respect to the migration vector, was also computed using the standard deviation of the mixing proportions.
Table 4. AIC values considered in the modeling process
Discussion
The results show that patients with cemented acetabular cups enter one of two main postoperative courses and that a large proportion of the cups become fixed. The two courses may reflect random events during surgery, but may also represent biological or genetic differences.
Most, if not all, prostheses migrated during the first year. This early migration may have been for reasons other than the migration seen later on. The mechanical situation in the periprosthetic bone after implant surgery may lead to bone compaction by microfractures and also fatigue or plastic deformation of the cancellous bone. Surgical trauma, areas of devascularization, and possibly cement toxicity and heat, will lead to bone necrosis. This will lead to resorption, which might undermine the prosthesis weeks or months after insertion. The involvement of resorption in postoperative migration has been demonstrated by the positive effect of bisphosphonates on the stability of knee prostheses (Hilding and Aspenberg Citation2006, Citation2007). These various early processes are likely to have ceased after a year, leaving either a stable, osseointegrated prosthesis or a prosthesis resting on a fibrous membrane, with slow but continuous migration. A fibrous membrane then allows the different secondary processes that put the prosthesis at risk of clinical loosening, driven by hydrostatic pressure or wear particles (Mjoberg Citation1997, Aspenberg and VanderVis Citation1998).
The existence of a stable category in our material suggests that the prostheses, i.e. the cement, can become osseointegrated. This is interesting when one considers that the argument for using uncemented prostheses is that these may become osseointegrated, which cemented ones are assumed never to be. The stable category suggests that they often are. Thus, in the competition between the principles of cement and no cement, the most interesting comparison now would be to see which one has the largest proportion of stable cases. It might be possible to do this by compiling large numbers of already existing RSA data.
It appears that with our mix of cups, about 10— 15% were migrating. This is a higher figure than the expected 10‐year revision rate of approximately 4–7% (Kärrholm Citation2007), suggesting that only a proportion of migrating cups eventually go to revision. This suggests that migration is indeed a reasonable surrogate variable for loosening, because it also identifies patients at risk who never experience loosening.
In our material, the values for the size of the stable proportion during the second postoperative year differed between the different axes and the vector. A stable prosthesis is of course stable in all directions, but a prosthesis migrating along one axis might fall in the stable category for another axis. The differences between the axes in our data can be explained by random errors, but they put a questionmark over whether frequency analysis of a reasonable number of patients can be used to produce a reliable figure for the size of the stable proportion. Another way would be to use the vector—which is superior, as it incorporates all axes. The supposedly stable proportion in our material was 89% with an estimate SD of 4%. This is good precision. The drawback is that there is no proof that a subcategory with small values for the vector would really be stable. However, this might be taken for granted if a stable subpopulation of reasonably similar size is demonstrated by use of the axes. We therefore suggest that a certain type of prosthesis can be described by the size of a distinct stable proportion during the second postoperative year. This can be based on the vector after confirmation that there is a non‐migration subgroup on the most migrating axes.
When comparing groups of patients using RS A, some authors compare mean values and others compare the proportion of patients above a certain cut‐off value. The latter is justified by our results, which confirm the assumption that categories exist—at least for cemented cups. In some studies, the cut off value has been chosen based on the measuring error. If the migration value for one patient has a probability of more than 95% or 99% of being different from zero, the patient has been categorized as showing migration. The remaining patients have been thought of as stable, even though many of them may have been showing migration too. If this principle for determination of cut‐off level (at 95% probability) were to be applied to our material (on the y‐axis), it would be 0.2 mm higher than the most discriminative level found by frequency analysis (1.2 mm).
Frequency distribution analysis might allow calculation of the size of the fixed subgroup for different designs of prosthesis. This requires a sample size that is larger than in most RS A studies, but still possible to achieve. The method might enable us to come up with distinct numbers signifying the quality of a certain prosthesis or procedure.
Acknowledgement
We thank Lars Palm for supplying the raw data from the Linköping patients.
No competing interests declared.
Contributions of authors
PA suggested the study, interpreted the statistical data, and wrote the manuscript. PW performed the statistical analysis and assisted in writing. KGN supplied most of the raw data and assisted in interpretation and writing. JR outlined the statistical analysis and supervised it.
- Akaike H. A new look at the statistical model identificaion. IEEE Trans Automatic Control 1974 19, 6: 716–23
- Aspenberg P, Van der Vis H. Migration, particles, and fluid pressure. A discussion of causes of prosthetic loosening. Clin Orthop 1998, 352: 75–80
- Hilding M, Aspenberg P. Postoperative clodronate decreases prosthetic migration: 4-year follow‐up of a randomized radiostereometric study of 50 total knee patients. Acta Orthop 2006; 77(6)912–6
- Hilding M, Aspenberg P. Local peroperative treatment with a bisphosphonate improves the fixation of total knee prostheses. A randomized, double‐blinded, radiostereometric study of 50 patients. Acta Orthop 2007; 78(6)795–9
- Kärrholm J. The Swedish hip arthroplasty register. Annual report 2005. 2007
- Kärrholm J, Borssen B, Lowenhielm G, Snorrason F. Does early micromotion of femoral stem prostheses matter? 4–7‐year stereoradiographic follow‐up of 84 cemented prostheses. J Bone Joint Surg (Br) 1994; 76(6)912–7
- Mjoberg B. The theory of early loosening of hip prostheses. Orthopedics 1997; 20(12)1169–75
- Palm L, Olofsson J, Astrom S E, Ivarsson I. No difference in migration or wear between cemented low‐profile cups and standard cups: A randomized radiostereographic study of 53 patients over 3 years. Acta Orthop 2007; 78(4)479–84
- Ryd L, Albrektsson B E, Carlsson L, Dansgard F, Herberts P, Lindstrand A, Regner L, Toksvig‐Larsen S. Roentgen stereophotogrammetric analysis as a predictor of mechanical loosening of knee prostheses. J Bone Joint Surg (Br) 1995; 77(3)377–83
- Selvik G. A stereophotogrammetric system for the study of human movements. Scand J Rehabil Med Suppl 1978; 6: 16–20
- Sychterz C J, Claus A M, Engh C A. What we have learned about long‐term cementless fixation from autopsy retrievals. Clin Orthop 2002, 405: 79–91
- Tukey J. Exploratory data analysis. Addison‐Wesley, Reading, MA 1977