
Abstract
Background and purpose — The number of shoulder registries increases. We assessed international trends in use of shoulder arthroplasty, and described the current state of procedure selection and outcome presentation as documented in national and regional joint registries.
Methods — Published reports from 9 population-based shoulder arthroplasty registries (country/region: Norway, Sweden, New Zealand, Denmark, California, Australia, Emilia-Romagna, Germany, and United Kingdom) were analyzed. Data were extracted on age, sex, disease indication, type of surgical procedure, surgical volume, and outcomes.
Results — Shoulder arthroplasty incidence rate in 2012 was 20 procedures/105 population with a 6-fold variation between the highest (Germany) and lowest (United Kingdom) country. The annual incidence rate increased 2.8-fold in the past decade. Within the indications osteoarthritis, fracture, and cuff-tear arthropathy variations in procedure choice between registries were large. Outcomes evaluation focused on revision in all registries, but different measures and strata were used. Only Australia provided revision rates for prosthesis brands stratified by both indication and procedure. Finally, in 2 registries with available data surgeons performed on average 10–11 procedures yearly.
Interpretation — Annual incidence rates of shoulder arthroplasty have almost tripled over the past decade. There is wide variation in procedure selection for the major indications, a low average surgeon volume, a substantial number of brands with small annual volume, and large variation in outcome presentation. The internationally increasing registry activity is an excellent basis for improving the so far weak evidence in shoulder arthroplasty.
Shoulder arthroplasty has become the established treatment for severe gleno-humeral disease from rheumatoid arthritis (RA) and osteoarthritis (OA), severe fracture, avascular necrosis (AVN), and cuff-tear arthropathy. Various implant designs have been developed over the past 20 years resulting in a large number of available implants. Clinical implant performance monitoring differs between countries. Registries are the best tools for long-term implant surveillance (Glicklich and Dreyer Citation2014). The first shoulder arthroplasty registry was created in Norway in 1994. Currently national shoulder arthroplasty registries exist in Norway, Sweden, Denmark, Australia, New Zealand, the United Kingdom (UK) (Rasmussen et al. Citation2012),and since 2014 in the Netherlands (Dutch Arthroplasty Register 2015). Recent reviews (Gonzalez et al. Citation2011, Sanchez-Sotelo Citation2011, Singh et al. Citation2011, Zumstein et al. Citation2011, Carter et al. Citation2012, Smith et al. Citation2012, Rasmussen Citation2014, Pinkas et al. Citation2015, Longo et al. Citation2016) and one health technology assessment report (Kärrholm et al. Citation2012) have highlighted the need for improved evidence in shoulder arthroplasty. Moreover, only a few national and international guidelines exist on the selection of the most appropriate procedure for the different indications (AAOS Citation2011, NICE Citation2010).
Despite the recent growth in data collection (Rasmussen et al. Citation2012) there remains a dearth of epidemiological data on shoulder arthroplasty in different countries. Moreover, we are unaware of any publication presenting the annual incidence of shoulder arthroplasty in different countries. For this reason our aim was to examine the level of variation in indications, use of these procedures, and outcome reporting. Specific objectives were to (1) describe national incidence rates and trends; (2) examine trends in choice of type of procedure; (3) identify variation between different procedures and disease indications; (4) examine, where possible, variation in surgical volume; and (5) describe methods of outcomes assessment.
Materials and methods
All countries and regions having attempted to capture all shoulder arthroplasties were identified. Entry criteria for inclusion were: more than 2 years of publicly available data including recent years (> 2010). We included publications from the following countries and/or national or regional registries: Australia, California (Kaiser Permanente Shoulder Arthroplasty Registry (Dillon et al. Citation2015)), Denmark, Emilia-Romagna (North Italy), Germany, New Zealand, Norway, Sweden, and the UK. In all cases data were reported from registries except for Germany where data were based on publicly available hospitalization data from the Federal Bureau of Statistics in Wiesbaden, Germany (Oppermann et al. Citation2016). For simplicity the term registry will be used in the following for all countries/regions.
Analysis was focused on primary procedures, which are most frequent and more consistently documented. Data were extracted on the key variables “disease indication”, “type of procedure”, and “outcomes”. The following disease indications were used: OA, cuff-tear arthropathy (as primary diagnosis), inflammatory arthritis, trauma (both acute trauma and trauma sequelae), and AVN. Procedures were categorized into the following implant sub-groups: total conventional arthroplasty, total reverse arthroplasty, hemi-arthroplasty, total resurfacing, and resurfacing hemi-arthroplasty. The reports from Germany and Norway included hemi-arthroplasty, total conventional and reverse arthroplasties without mention of resurfacing arthroplasty. For the key outcome, revision, information was extracted on how revision was defined and how the data were presented. In addition we recorded whether and how revision rates were recorded for different sub-groups. Finally, we examined the distribution of the number of procedures by surgeon, where these data were available.
Statistics
Using population data from the Organisation for Economic Co-operation and Development (OECD) closest to the years in question, we calculated annual incidences of shoulder arthroplasty procedures per 100,000 inhabitants in the 7 countries included. The annual incidence trends were displayed graphically. Moreover, the highest and lowest incidence rate in 2012 were compared with use of an incidence rate ratio and its 95% confidence interval (CI), and the increase in annual incidence rate between 2002 and 2012 combining the 3 countries with available data (Norway, Sweden and New Zealand) was assessed with use of incidence rate difference and CI. Data were also extracted on mean ages at time of surgery, proportions of men and women, and distributions of indications for all years combined from the 9 registries. We calculated differences in proportions and their CIs for the comparison of the proportions of OA, cuff-tear arthropathy, and fracture in Sweden and New Zealand, the 2 registries with a similar time frame of data collection. Furthermore, variation in the proportion of different implant types used in the different countries/regions overall and in 3 different years (2000, 2006, and 2014 or closest years) was explored (data not readily available for California and Emilia-Romagna).
The distributions of type of procedure across disease indications were then calculated for each registry for the period including 2008 to the latest available year (exception California 2005–2013 and Denmark 2004–2012). The data by indication and type of procedure were cross-tabulated where available (not readily available for New Zealand). The level of difference between the registries for the 3 main disease–implant combinations was examined using meta-analysis methods. First, the proportion of total conventional arthroplasty in patients with OA was combined over registries using a model with random effects. A double arc-sine transformation (Miller Citation1978) was applied to proportions before combination and pooled estimates were obtained with the restricted maximum likelihood approach (Viechtbauer Citation2005). The between-registries variability was assessed by the I2 statistic: the I2 statistic ranges from 0% to 100% and values greater than 75% indicate a considerable heterogeneity between registries (Higgins et al. Citation2003, Higgins and Green Citation2011). To capture the magnitude of this variability, the 95% prediction interval was also assessed. This interval shows the possible values of proportion of total conventional arthroplasty in patients with OA for a new registry (Higgins et al. Citation2009). Similar meta-analyses were conducted to combine the proportions of total reverse arthroplasty in patients with cuff-tear arthropathy and the proportions of hemi-arthroplasty in patients with fracture. Meta-analyses were conducted with package meta for R, Version 2.15.2 (R Foundation for statistical computing, Vienna, Austria).
Ethics, funding, and potential conflicts of interest
IRB approval not required. The study received no funding. Competing interests not declared.
Results
The numbers of shoulder arthroplasties in the 9 registries are shown in . There was a female to male excess of between 1.5:1 and 2.5:1. On average, women were 5 to 7 years older than men at time of surgery. Registry data reporting started first in Norway in 1994. The annual incidence rates for the 7 countries with national data are shown in and . Their combined mean incidence rate in 2012 was 20 procedures/105 population. In 2012, the variation between the incidence rate in the country with the highest (Germany: 34 procedures/105 population) and the lowest incidence rate (UK: 5.6 procedures/105 population) was 6-fold (CI 5.9–6.3). Between 2002 and 2012 annual incidence rates increased from 5 procedures/105 population to 13 procedures/105 population (rate difference 8, CI 7.6–8.8) in the 3 countries with available data (Norway, Sweden and New Zealand) (see ). An almost linear increase in procedure rates was seen in all registries with no evidence of levelling off.
Figure 1. Annual incidence of shoulder arthroplasty procedures per 105 inhabitants from 7 countries with a national registry.
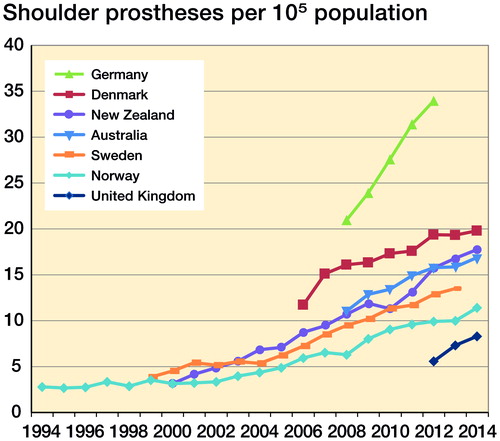
Table 1. Registries included
Table 2. Incidence rates of shoulder prostheses in 2012 in the 7 countries with available national data
Between-registry differences in disease indication taking into account the entire time frame covered by the analysis were very large (). OA was the most frequent indication in the English-speaking countries, in Germany and Emilia-Romagna, whereas the commonest cause in the Scandinavian countries was fracture. The proportion of arthroplasties performed for fracture varied substantially from 8% in the UK to more than 40% in Scandinavia. The proportion performed for inflammatory arthritis was highest in Norway, Sweden, and New Zealand, the 3 oldest registries. There was also a large variation in use of shoulder arthroplasty for cuff-tear arthropathy, which ranged from 2% in Norway to 20% in the UK. Taking into account only the two registries with a similar time frame covered by the analysis, Sweden and New Zealand, the differences remained (for OA 34% vs. 52% (difference 18%, CI 16–19); for cuff-tear arthropathy 7% vs. 19% (difference 11.8%, CI 11–13); for fracture 41% vs. 10% (difference 31%, CI 30–32)).
Table 3. Distribution of indications by country/region. Values are number (%)
Considering the whole registration period, proportions of different procedures () differed by country/region. Total reverse arthroplasty was most common in Emilia-Romagna, Australia, and the UK, hemi-arthroplasty in Scandinavia, and total conventional arthroplasty in New Zealand, California, and Germany. Because of differences in length of data collection and secular changes in procedure use we further assessed the proportions of total conventional and reverse arthroplasty as well as hemi-arthroplasty procedures at different points in time within a given registry and between the registries (). Total conventional arthroplasty use, infrequent in 2000 and 2006, substantially increased in 2014 (or closest available year) in the Scandinavian countries. Between-registry differences ranged from 24% (2014) in Norway to 52% in Sweden (2013). The use of total reverse arthroplasty over the last 15 years in Norway and New Zealand increased from 12% to 52% and from 2% to 56%, respectively, whereas in Sweden its use remained stable (6–10%) over the examined period. Regarding hemi-arthroplasty use, in Australia “partial” replacement (defined in their annual report as a combination of partial resurfacing and hemi procedures) fell from 30% to 10% between 2008 and 2014. In Norway there was also a shift away from hemi-arthroplasty. For example (data not shown) from 2006 to 2012 there were on average 220 hemi-arthroplasties per year, whereas in 2013/14 this figure had dropped to 150/year. Within the most recent year the difference in use of hemi-arthroplasty was still substantial, with less than 10% in Australia and New Zealand, 22–25% in Germany, the UK, and Norway, and 37–41% in Denmark and Sweden.
Figure 2. Distribution of the 3 main shoulder arthroplasty procedures performed by country for the years 2000, 2006, and 2014. 2000: Denmark data from 2004; Norway data for 1994–2005. 2006: Australia and Germany data from 2008. 2014: Germany data from 2012; Sweden data from 2013.
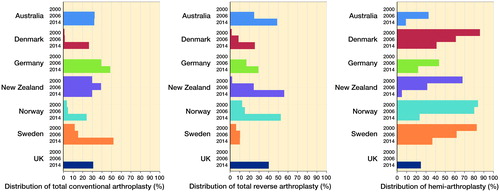
Table 4. Distribution of types of procedures by country/region. Values are number (%)
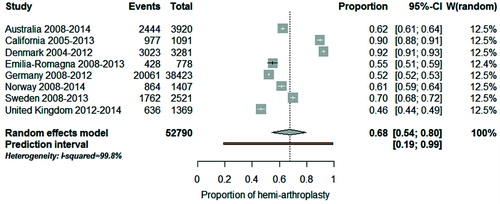
The distribution of procedure by disease indication in most recent years (from 2008 on with the exception of California and Denmark) is shown in for the registries with available data. To quantify how much the procedure sub-groups varied across registries we used meta-analysis techniques and evaluated the 3 most common disease–implant combinations. The combined proportion of total conventional arthroplasty in patients with OA was 45% (CI 35–55): for a typical registry, half of patients with OA had a total conventional arthroplasty (). However, this proportion varied considerably across registries (I2 = 99.8%) and the observed variation cannot be explained by chance alone. If this proportion were calculated in a new registry, it would be expected to fall between 13% and 81% (prediction interval). When “Emilia-Romagna” and “Denmark” were removed from the meta-analysis, the combined proportion was 57% (CI 51–63), the heterogeneity between registries remained (I2 = 99.5%) and the prediction interval was still wide (34–78%). For total reverse arthroplasty in patients with cuff-tear arthropathy, the combined proportion was 77% (CI 60–91). Between-registry variability was considerable (I2 = 99.7%) and the prediction interval was from 13% to 100% (). For hemi-arthroplasty in patients with fracture, the combined proportion was 68% (CI 54–80). Between-registry variability was considerable (I2 = 99.8%) and the prediction interval was from 19% to 89% ().
Figure 3. Distributions of implant choice across 5 disease indications by country/region.
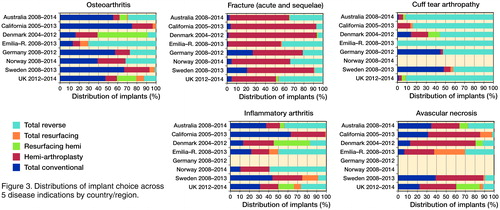
Figure 4. Forest plot illustrating between-registry variation in proportion of total conventional arthroplasty in patients with osteoarthritis.
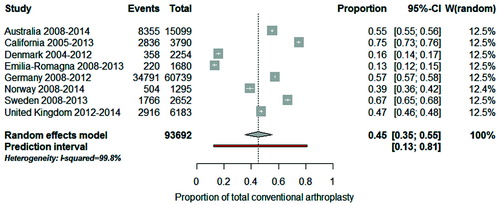
Figure 5. Forest plot illustrating between-registry variation in proportion of total reverse arthroplasty in patients with cuff tear arthropathy.
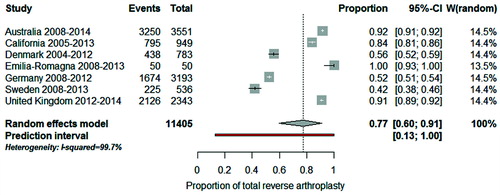
Figure 6. Forest plot illustrating between-registry variation in proportion of hemi-arthroplasty in patients with fracture.
All registries evaluated “revision” as their key outcome. The definitions of revision are presented in Table 5 (see Supplementary data). Most definitions included exchange or removal of a part or the whole and addition of a glenoid component. The degree of further details varied (e.g. how to account for a 2-stage revision). Regarding the ways of measuring and stratifying the results the registries used very different approaches (Table 6, see Supplementary data). The Australian registry provides the most detailed analysis allowing the comparison of annual cumulative revision probabilities (with their 95% confidence intervals) for individual prosthesis brands, stratified by procedure type and disease indication among other factors.
Surgeon volume was indicated by 2 registries. The UK registry reported that a total of 553 consultant surgeons had carried out the primary replacements and the median number carried out in 2014 by each was 11 (IQR 2–31). In New Zealand 79 surgeons performed 801 shoulder procedures, an average of 10 procedures per surgeon in 2014.
Discussion
The widespread use of shoulder arthroplasty is more recent than that of hip and knee arthroplasty. Compared with the latter interventions, its incidence rate is about 10 and 7.5 times lower (Pabinger and Geissler Citation2014, Pabinger et al. Citation2015), and the range of disease indications is wider (primary shoulder OA is uncommon). There is a weak evidence base as to which indication is the most appropriate for which procedure (Singh et al. Citation2011, Kärrholm et al. Citation2012, Villacis et al. Citation2016). A key source of such evidence in “real world” patients comes from population registries, and increasingly national and regional registries are collecting data on the indications for and the use and outcomes from the different approaches to shoulder arthroplasty (Rasmussen et al. Citation2012). There are also recent efforts to combine and compare data from different registries (Page et al. Citation2014, Rasmussen et al. Citation2016). The existence of registry data from a number of countries around the world made it possible to provide for the first time the current status of shoulder arthroplasty. Our findings highlight unexplained/unmeasured variation in procedure choice that should prompt further research to aid evidenced-based decision-making in the use of these procedures. Moreover, it has also highlighted the need for harmonization of data analysis and outcomes presentation. Although all registries focus on revision as their key outcome, the way revision data are presented and the sub-groups into which the results are stratified differs largely. This variation thus limits international comparison of published results, which is important given the relatively low numbers with shoulder arthroplasty in an individual country, compared with hip and knee surgery.
The 9 registries whose data we analyzed varied in their length of data collection from over 20 years (Norway) to the UK’s more recent 3 years. In all countries there was a strong upward trajectory in incidence at an almost parallel gradient, as also reported in the United States (Day et al. Citation2010, Kim et al. Citation2011, Schairer et al. Citation2015). It might suggest that for reasons including growing demand, increasing health care capacity, and/or expanding indications (Birkmeyer et al. Citation2013, Villacis et al. Citation2016) countries could expect to see this continuation in growth.
We found large variation in main disease indications independent of length of data collection. This is likely partly due to the use of competing/alternative treatment methods (e.g. acute fracture treatment with osteosynthesis or non-operatively instead of joint replacement). There was also large variation in the use of the different procedures within the 3 main disease indications. This might be related to the lack of long-term data and guidelines for best practice. Moreover, issues related to training, level of capacity for this type of surgery, reimbursement habits, local availability of implants (approved in the country), and differences in marketing strategies towards surgeons/private hospitals/patients may also explain part of the variation (Birkmeyer et al. Citation2013). However, the latter factors as well as others (e.g. ease of surgery and patient recovery period) potentially influencing the surgeon’s choice of procedure and implant brand are not documented in registries. Better knowledge of these issues will help optimize decision-making and improve patient outcomes.
The numbers of different manufacturers and models of implants was large (similar to hip and knee arthroplasty) and outside the scope of detailed analysis in this report. For example the UK registry quoted the use of 39 different brands of stems alone, excluding other brands for resurfacing. Individual registries frequently reported the use in single figures of a large number of available products. Given the smaller number of operations overall as compared with hip and knee arthroplasty and the wide variation in indications, it will be difficult or impossible to obtain sufficiently large samples for valid long-term effects’ comparison. Limiting the available choice would help address this.
While it is unclear what is a reasonable annual number of such procedures for a surgeon to perform, data from the UK and New Zealand suggests that many surgeons are doing a low number annually. Increased postoperative complications and mortality as well as longer lengths of stay have been reported in the United States when shoulder arthroplasty was performed by low-volume surgeons and/or hospitals (Jain et al. Citation2004, Singh et al. Citation2014). Finally, only a little information on patient characteristics prior to surgery was available in most registries. This lack of information on potentially confounding factors constitutes a major obstacle for the conduct of comparative effectiveness and safety studies.
Limitations
Analysis was restricted to the data published by the registries themselves. In none of the registries analyzed was it possible to calculate the age- or sex-specific population incidence for operation rates from the publicly available data. The reports varied in the consistency of the data used to calculate different subgroups, and the reasons for these inconsistencies were not always clear. In , the number of primary procedures indicated represents the choice for which most subsequent information was available.
The diagnostic assignment may be subject to variation between and within countries. OA secondary to RA may be assigned to either disease. Similarly, the variation in the use of shoulder arthroplasty for cuff-tear arthropathy may be related to variation in the use of the classification (some registries coding cuff-tear arthropathy as OA, others, such as Norway, classifying it under “Other” with the possibility for special mention of cuff-tear arthropathy), changes in the use of diagnostic tests (e.g. MRI), as well as real surgical variation in this procedure.
There were also differences in how different procedures were described: for example the Australian registry stratified their interventions in different categories, separating all partial from all total arthroplasties. Furthermore, information on procedure choice by disease indication, when available, was not systematically reported for each individual year, thus limiting our ability to perform the between-registry comparison (see ) for the most recent year. However, to reduce the influence of the difference in length of data collection and of secular trends in procedure choice we restricted the analysis to the years 2008 onwards where possible.
Finally, coverage was high albeit not 100% in all registries. This is in accordance with a previous evaluation of the reported coverage of shoulder arthroplasty registries internationally (Rasmussen et al. Citation2012). There may be differences in reporting between elective and trauma care hospitals, which we are unable to verify because coverage according to categories of hospitals was not widely available. However, because of the high coverage in all the registries these differences, if present, are unlikely to substantially influence the study findings.
In summary, our findings highlight that despite the individual success for specific patients there is wide variation in use of shoulder arthroplasty at several levels with a lack of high-level evidence to alter this situation. The wide variety of available devices, often used in small numbers, is a cause for concern. There is also a need for harmonization of diagnoses, procedures, and outcomes. It is crucial to keep in mind that the conclusions reached in this review and meta-analysis are based on publicly available non-harmonized data with sometimes diverging definitions and classification systems. Nevertheless, the expanding creation of registries in this field of rapidly changing technology is encouraging. More needs to be done in improving our knowledge of benefits and harms of shoulder arthroplasty.
Supplementary data
Tables 5 and 6 are available in the online version of this article, http://dx.doi.org/10.1080/17453674.2017.1368884
All the authors contributed to the concept, discussions and presentation of the material. The statistical analyses were performed by C C, C B and A L. The manuscript was drafted by A L and A J S and all authors contributed to the final version of the manuscript.
Acta thanks Caryn Etkin and Jeppe Rasmussen for help with peer review of this study.
IORT_A_1368884_SUPP.PDF
Download PDF (35.5 KB)- American Academy of Orthopaedic Surgeons. Clinical practice guideline on the treatment of glenohumeral joint osteoarthritis. Rosement, IL: American Academy of Orthopaedic Surgeons (AAOS), 2011, 203–5.
- Birkmeyer J D, Reames B N, McCulloch P, Carr A J, Campbell W B, Wennberg J E. Understanding of regional variation in the use of surgery. Lancet 2013; 382 (9898): 1121–9.
- Carter M J, Mikuls T R, Nayak S, Fehringer E V, Michaud K. Impact of total shoulder arthroplasty on generic and shoulder-specific health-related quality-of-life measures: a systematic literature review and meta-analysis. J Bone Joint Surg Am 2012; 94 (17): e127.
- Day J S, Lau E, Ong K L, Williams G R, Ramsey M L, Kurtz S M. Prevalence and projections of total shoulder and elbow arthroplasty in the United States to 2015. J Shoulder Elbow Surg 2010; 19 (8): 1115–20.
- Dillon M T, Ake C F, Burke M F, Singh A, Yian E H, Paxton E W, Navarro R A. The Kaiser Permanente shoulder arthroplasty registry: Results from 6,336 primary shoulder arthroplasties. Acta Orthop 2015; 86 (3): 286–92.
- Dutch Arthroplasty Register. LROI Annual Report 2014. Accessed at http://www.lroi.nl/en/annual–reports on 10 Oct 2015.
- Glicklich R, Dreyer N A. Registries for evaluating patient outcomes: A user’s guide. Rockville, MD: AHRQ, 2014.
- Gonzalez J F, Alami G B, Baque F, Walch G, Boileau P. Complications of unconstrained shoulder prostheses. J Shoulder Elbow Surg 2011; 20 (4): 666–82.
- Higgins J P T, Green S, eds. Cochrane handbook for systematic reviews of interventions version 5.1.0 [updated March 2011]. The Cochrane Collaboration, 2011. Available from http://handbook.cochrane.org.
- Higgins J P, Thompson S G, Deeks J J, Altman D G. Measuring inconsistency in meta-analyses. BMJ 2003; 327 (7414): 557–60.
- Higgins J P, Thompson S G, Spiegelhalter D J. A re-evaluation of random-effects meta-analysis. J R Stat Soc Ser A Stat Soc 2009; 172 (1): 137–59.
- Jain N, Pietrobon R, Hocker S, Guller U, Shankar A, Higgins L D. The relationship between surgeon and hospital volume and outcomes for shoulder arthroplasty. J Bone Joint Surg Am 2004; 86-A (3): 496–505.
- Kärrholm J S K, Hultenheim Klintberg I, Ekholm C, Svanberg T, Samuelsson O. Prosthetic arthroplasty in primary shoulder osteoarthritis. Göteborg: Västra Götalandsregionen, Sahlgrenska Universitetssjukhuset, HTA-centrum, 2012.
- Kim S H, Wise B L, Zhang Y, Szabo R M. Increasing incidence of shoulder arthroplasty in the United States. J Bone Joint Surg Am 2011; 93 (24): 2249–54.
- Longo U G, Petrillo S, Berton A, Denaro V. Reverse total shoulder arthroplasty for the management of fractures of the proximal humerus: A systematic review. Musculoskelet Surg 2016; 100(2): 83–91.
- Miller J. The inverse of the Freeman-Tukey double arcsine transformation. American Statistician 1978; 32 (4): 138.
- National Institute for Health and Care Excellence (NICE). Shoulder resurfacing arthroplasty. 2010. Retrieved February 5, 2016 from www.nice.org.uk/guidance/ipg354
- OECD. Retrieved February 1, 2016 from https://data.oecd.org/pop/population.htm.
- Oppermann J, Celik E, Bredow J, Beyer F, Hackl M, Spies C K, Muller L P, Burkhart K J. Shoulder arthroplasty in Germany: 2005–2012. Arch Orthop Trauma Surg 2016; 136(5): 723–9.
- Pabinger C, Geissler A. Utilization rates of hip arthroplasty in OECD countries. Osteoarthritis Cartilage 2014; 22 (6): 734–41.
- Pabinger C, Lothaller H, Geissler A. Utilization rates of knee-arthroplasty in OECD countries. Osteoarthritis Cartilage 2015; 23 (10): 1664–73.
- Page R S, Navarro R A, Salomonsson B. Establishing an international shoulder arthroplasty consortium. J Shoulder Elbow Surg 2014; 23 (8): 1081–2.
- Paxton E W, Inacio M C, Kiley M L. The Kaiser Permanente implant registries: effect on patient safety, quality improvement, cost effectiveness, and research opportunities. Perm J 2012;16(2): 36–44.
- Pinkas D, Wiater J M, Spencer E E, Jr, Edwards T B, Uribe J W, Declercq G, Murthi A M, Hertel R. Shoulder prosthetic arthroplasty options in 2014: What to do and when to do it. Instr Course Lect 2015; 64: 193–202.
- Rasmussen J V. Outcome and risk of revision following shoulder replacement in patients with glenohumeral osteoarthritis. Acta Orthop 2014; 85 (Suppl 355): 1–23.
- Rasmussen J V, Olsen B S, Fevang B T, Furnes O, Skytta E T, Rahme H, Salomonsson B, Mohammed K D, Page R S, Carr A J. A review of national shoulder and elbow joint replacement registries. J Shoulder Elbow Surg 2012; 21 (10): 1328–35.
- Rasmussen J V, Brorson S, Hallan G, Dale H, Aarimaa V, Mokka J, Jensen S L, Fenstad A M, Salomonsson B. Is it feasible to merge data from national shoulder registries? A new collaboration within the Nordic Arthroplasty Register Association. J Shoulder Elbow Surg 2016; 25(12): e369–e377.
- Sanchez-Sotelo J. Total shoulder arthroplasty. Open Orthop J 2011; 5: 106–14.
- Schairer W W, Nwachukwu B U, Lyman S, Craig E V, Gulotta L V. National utilization of reverse total shoulder arthroplasty in the United States. J Shoulder Elbow Surg 2015; 24 (1): 91–7.
- Singh J A, Sperling J, Buchbinder R, McMaken K. Surgery for shoulder osteoarthritis: A Cochrane systematic review. J Rheumatol 2011; 38 (4): 598–605.
- Singh A, Yian E H, Dillon M T, Takayanagi M, Burke M F, Navarro R A. The effect of surgeon and hospital volume on shoulder arthroplasty perioperative quality metrics. J Shoulder Elbow Surg 2014; 23 (8): 1187–94.
- Smith C D, Guyver P, Bunker T D. Indications for reverse shoulder replacement: A systematic review. J Bone Joint Surg Br 2012; 94 (5): 577–83.
- Viechtbauer W. Bias and efficiency of meta-analytic variance estimators in the random-effects model. Journal of Educational and Behavioral Statistics 2005; 30 (3): 261–93.
- Villacis D, Sivasundaram L, Pannell W C, Heckmann N, Omid R, Hatch G F, 3rd. Complication rate and implant survival for reverse shoulder arthroplasty versus total shoulder arthroplasty: Results during the initial 2 years. J Shoulder Elbow Surg 2016; 25(6): 927–35.
- Zumstein M A, Pinedo M, Old J, Boileau P. Problems, complications, reoperations, and revisions in reverse total shoulder arthroplasty: A systematic review. J Shoulder Elbow Surg. 2011; 20 (1): 146–57.