
 ?Mathematical formulae have been encoded as MathML and are displayed in this HTML version using MathJax in order to improve their display. Uncheck the box to turn MathJax off. This feature requires Javascript. Click on a formula to zoom.
Abstract
Purpose
This study was designed to investigate the effect of wheel and tire selections on the propulsion characteristics of a high-strength lightweight manual wheelchair using robotic wheelchair propulsion.
Materials and methods
Four configurations were compared with differing combinations of drive wheel tires and casters, with the baseline reflecting the manufacturer configuration of a solid mag drive wheel and 8"×1" caster. The robotic wheelchair tester propelled the chair using pre-generated straight and curvilinear manoeuvres using repeatable and reliable cyclic torque profiles. Additionally, energy loss of the components was measured using coast-down deceleration tests to approximate the system-level rolling resistance of each configuration.
Results
Results indicate a significant decrease in propulsion cost, increased distance travelled and increased manoeuvrability across all configurations, with upgraded casters and tires.
Conclusions
These results indicated that with better casters and drive wheel tires, the performance of high strength lightweight wheelchairs can be improved and better meet the mobility needs of users.
Wheel and tire selection can have a demonstrable impact on the propulsion efficiency of manual wheelchairs
Coast-down test protocols can be used as a simple and cost-effective means of assessing representative energy losses across various surfaces
Wheelchair configurations can be optimized with proper knowledge of the main energetic loss contributions and the environments and contexts of use
Implications for rehabilitation
Introduction
Manual wheelchairs are an energetically-inefficient means of travel [Citation1,Citation2], but still remain the best option of mobility for millions of individuals with injuries and disabilities. Hand-rim propulsion, due to the large and repetitive forces involved, is often associated with injuries in the upper extremities [Citation3–5]. To properly address this issue, wheelchairs must be optimized to minimize the required propulsive forces and improve the energetic efficiency.
Energetic losses incurred during manual wheelchair propulsion are ultimately determined by aspects of the wheelchair design [Citation6–9] and configuration. Energy is supplied by the user to the wheelchair via the hand-rims, and is predominately lost at the interface between the tires and the ground. This energy loss is determined by a variety of factors such as the load distribution on the drive wheels [Citation9–11], inflation [Citation12,Citation13] and material properties of the tire [Citation9], and the trajectory of motion behaviour of the tire under different types of motion [Citation10,Citation14]: straight, forward-facing motion is tied to a simple rolling behaviour of the wheels, whereas a turning manoeuvre places the wheels under torqueing scrub-type motion or induces swivel on the front casters. At the wheelchair-level, performance is influenced by the fore-aft weight distribution of the occupied chair [Citation15–17], which is commonly defined by the weight over the rear sets of wheels. Weight distribution can be adjusted by shifting the rear axle location, which is a feature only common to ultralightweight wheelchairs.
A few studies have compared propulsion efficiency of different wheelchair frames and configurations using human subjects. Studies have shown that lightweight chairs could be propelled faster and farther than standard chairs without changing cardiorespiratory levels [Citation18]. When compared to ultra-lightweight chairs, users tended to propel lightweight chairs slower and for shorter distances [Citation19,Citation20] and at higher energetic costs [Citation21]. These studies compared wheelchair systems so differences in energetic costs could have resulted from different weight distribution over the drive wheels, different casters, and/or different drive wheel tires.
Energy loss has been shown to be the greatest influence of propulsion effort, according to predictive models of wheelchair mechanics [Citation15,Citation22,Citation23]. System energy losses measured in straight and turning coast down tests are influenced by weight distribution [Citation16,Citation24] and casters and drive wheels [Citation6,Citation11]. Relatedly, vast differences exist in caster and drive wheel energy losses when measured using component testing [Citation10]. This prior work served as motivation to hypothesize that the performance of an out-of-the-box wheelchair could be significantly improved with a simple change of drive wheels and casters.
In the United States, wheelchairs are categorized using the Healthcare Common Procedural Coding System (HCPCS). This system classifies manual wheelchairs according to factors such as wheelchair mass, occupant weight capacity, adjustability, and frame warranty, to name a few. A high-strength lightweight wheelchair, coded K0004, must have a weight less than 34 pounds and offer a lifetime frame warranty. They are prescribed to users that require this type chair to self-propel to perform certain activities of daily living, and/or require sizing that cannot be accommodated in standard or lightweight wheelchairs. By policy, wheelchair users are expected to use the chair for more than 2 h per day and are expected to need wheeled mobility for longer than 3 months [Citation25].
The objective of this study was to assess the differences in propulsion cost of a K0004 wheelchair when configured with upgraded casters and drive wheel tires. The specific aims included: (1) identify commercial casters and drive wheel tires that would fit a generic K0004 frame and that have been shown to have improved energy loss performance based upon prior component-level tests; and (2) empirically assess system-level parameters with the default and up-graded components to quantify differences in performance across tile and carpet surfaces using straight and curvilinear manoeuvres.
Hardware and configurations
This study did not require external hardware on the wheelchair frame except the custom ring gear push-rims and the hub-mounted drive wheel encoders used by the robotic wheelchair testing system.
Anatomical model propulsion system
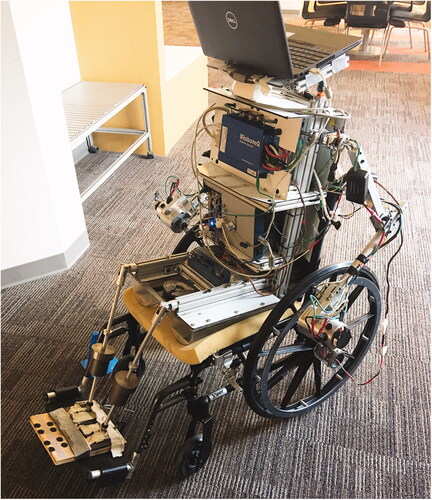
The Anatomical Model Propulsion System (AMPS, seen in below) is a robotic wheelchair tester designed to measure motion of a wheelchair under a controlled and repeatable propulsion trajectory. Its construction consists of an aluminium frame that emulates the general anthropometric measurements of an average adult male and meets the weight distribution criteria of ISO 7176:11’s wheelchair dummy, scaled to a total mass of 80 kg. Propulsion of the wheelchair is controlled by the motors attached to the wheels via custom toothed push-rims. A high-powered, dual-channel motor controller (HDC2460, RoboteQ) is used to control the voltage and current flowing through each motor. Wheel rotations are recorded by optical encoders (EM1-2500-I, US Digital Inc.) mounted to each drive wheel axle. Current sensors (ACS758, DFRobot) monitor the armature amperage of each motor. Signals are sampled at 40 Hz with a data acquisition board (USB6341, National Instruments). More detailed descriptions of the system can be found in the original design article [Citation26] as well as several studies [Citation16,Citation17] that have also used the AMPS.
Figure 1. The robotic anatomical model propulsion system wheelchair testbed.
Frame selection
One high-strength lightweight wheelchair frame was used for all configurations in this study (Viper Plus GT, Drive Medical). The caster forks could accommodate the most common 6"- and 8"-diameter casters available for K0004 wheelchairs. Before testing with the AMPS, the arm rests, heel straps, and anti-tip bars were removed from the frame. The mass of the wheelchair in its original unloaded configuration was 13.5 kg, including the front riggings. The detachable footrests weighed 1.3 kg and the other removed hardware (arm rests, anti-tip bars) weighed an additional 2.6 kg.
Component selection
The Viper Plus GT frame came equipped with the standard component offerings from Drive Medical: solid 24"×1" polyurethane tires with a trapezoidal cross-sectional profile on plastic “Mag” wheel rims, and a set of unlabelled 8"×1" casters. According to the official Drive Medical order form, these components are the only ones available for this particular chair.
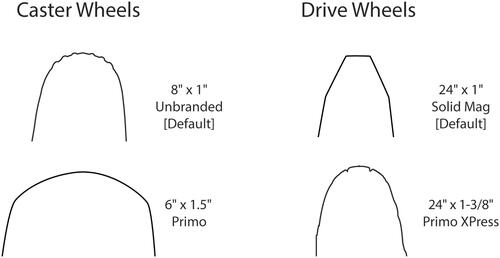
The choice of upgraded tires and casters were selected based upon a few criteria. They had to be fairly common no-cost options offered on ultralightweight wheelchairs and could be easily attached to a K0004 frame. Published data on energy loss parameters (rolling resistance, resistive scrub torque) of casters and tires [Citation10] were then used to identify the components that provided good energy loss performance. A decision was made to use non-pneumatic drive wheel tires based upon the fact that K0004 chairs are configured with non-pneumatic or solid tires. Primo XPress 24"×1-3/8" non-pneumatic tires were selected based upon the criteria and the finding that they showed much lower energy loss compared to the solid tires typically offered on K0004 chairs. Primo 6"×1.5" casters were chosen because 6"-diameter casters can be fit directly on the caster forks used to mount the 8" casters typically offered on K0004 wheelchairs. Additionally, the chosen Primo casters had lower scrub torque and similar rolling resistance on tile and carpet compared to other non-pneumatic 6"-diameter casters [Citation10]. General measurements of the wheels can be seen in .
Table 1. Wheel properties.
Cross-sectional profiles of each tire are shown in . These were captured by tracing the outer edge of the tire from a top-down view.
Figure 2. Cross-sectional tire profiles.
Chair configurations
Four configurations were established to investigate the performance changes at the system level (). The default configuration (“A”) had the solid tires and 8"×1" casters delivered with the Viper Plus GT wheelchair. Configuration “B” replaced the casters with the Primo 6"×1.5" casters. Configuration “C” combined the 8"×1" casters with the Primo XPress drive wheels. Configuration “D” used both upgraded components, the 6"×1.5" casters and Primo XPress tires.
Table 2. Configurations used to assess performance.
Experimental design
This study was designed to investigate propulsion cost and over-ground kinematics of the high-strength lightweight wheelchair with four discrete configurations over two common surfaces: linoleum tile and low-pile carpet. Two manoeuvres were selected: a 7-push straight trajectory and a 5-push slalom trajectory.
Manoeuvre selection
The AMPS control system was configured to propel the chair in straight and curvilinear trajectories. The AMPS can apply a highly precise and repeatable torque profile at the push-rims to impart motion. Intermittent torque applications were defined to mimic the cyclical propulsion of human operators. Torque profiles were defined to impart movement from a stationary position and to maintain motion between push strokes.
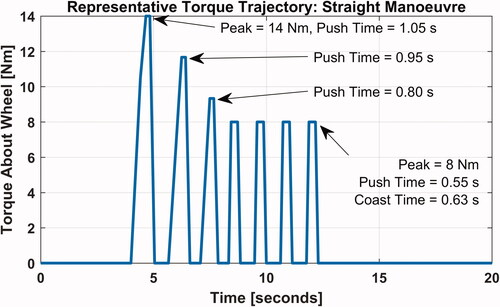
The straight manoeuvre consisted of 7 propulsion strokes, with the applied torques of the initial three being greater before settling onto a steady profile. This mimics that of human propulsion in which greater torque is required to initiate motion compared to maintaining speed once in motion. depicts the torque profiles on tile. The torque profile on carpet was analogous, except with 4 N-m greater torque applied to the wheels to overcome the higher energy losses on that surface.
Figure 3. Torque profile for the Straight manoeuvre on tile.
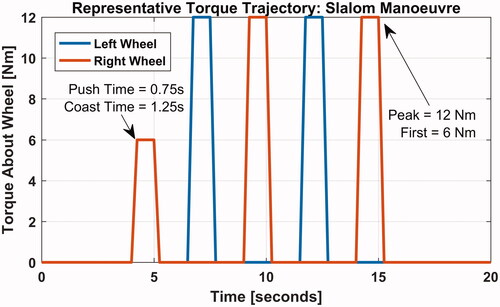
A Slalom manoeuvre was defined to induce caster swivel and drive wheel scrub during a curvilinear trajectory. Its torque profile featured alternating applications of torque on the right and left drive wheels. The manoeuvre commenced with a small bi-lateral push to give the AMPS an initial momentum and align the casters to a path facing straight ahead. Next, a series of uni-lateral pushes were applied to induce small alternating turns that involved caster swivel and drive wheel scrub. The torque profile for tile is illustrated in . As with the straight manoeuvre, torques were 4 Nm greater on the carpet compared to tile.
Figure 4. Torque profile for the Slalom manoeuvre on tile.
Methods
Data collection
Coast-down system-energy loss
A simple coast-down deceleration method was used to characterize the typical energy loss of each configuration [Citation24]. The motors were disconnected from the ring gear push-rims to decouple the propulsion system. From rest, the wheelchair was manually pushed via the rear handles to accelerate the chair to approximately 1.0 m/s. Upon reaching the target speed, the wheelchair was released and permitted to roll down the hallway until it naturally decelerated to a stop. Wheel velocities were recorded by the wheel encoders. 10 trials were taken in the forward and backward hallway directions to account for any slopes or surface irregularities for each configuration. In total, 20 trials were taken for each configuration over each surface for a total of 160 coast-down trials.
Propulsion cost measurement
The experimental protocol consisted of 30 over-ground propulsion trials for each of the four configurations. The wheels were lightly wiped with a microfiber cloth prior to testing to remove dust and debris. The torque trajectory was loaded into the LabVIEW interface and the AMPS was set up along a 30 m length of clean, flat linoleum tile hallway. To normalize for surface inconsistencies such as slope or intermittent bumps, 5 forward-heading trials were run in each of the forward and backward hallway directions along the same length of tile for the Straight manoeuvre. Similarly, the Slalom manoeuvre was tested with 5 trials in each of the left and right slalom manoeuvres in both the forward and backward hallway directions, resulting in a total of 20 slalom trials. This protocol was replicated for the carpeted surface. In total, 240 over-ground AMPS trials were collected. The trials for each configuration were averaged together by manoeuvre (N = 10 for Straight, N = 20 for Slalom) and the repeatability for the set of trials was assessed. The inclusion criteria for each set of trials was that the coefficient of variation (CoV) of distance travelled remained ≤10%.
Dependent variables
The three outcome variables of this experiment were propulsion cost, distance travelled, and yaw distance travelled as the wheelchair changed heading direction. Propulsion cost reports work as a function of distance travelled. As such, it is analogous to the construct of miles per gallon. Distance travelled can be used to compare configurations because the torque input by AMPS is the same for each trial and each configuration. So, distance is reflective of how far the wheelchair travels given the same series of propulsion cycles. Yaw displacement as the wheelchair changes direction in the slalom manoeuvre can be considered a measurement of manoeuvrability. A chair that changes direction more readily can be considered more manoeuvrable.
Propulsion cost is calculated as the ratio of the work supplied by the AMPS to the wheelchair over the distance travelled by the centre of mass. Total work supplied to the wheelchair is calculated by integrating rotational power over the duration of the manoeuvre:
(1)
(1)
In this equation, rotational power (W) is found by the product of τ, the wheel torque (N-m), and ω, rotational speed of the wheel (rads per sec). Total power is determined by summing the individual power inputs of the left and right wheels. Power is integrated over the duration of the manoeuvre ( to
secs). Similarly, the distance travelled by the centre of mass (path length) is calculated by integrating the wheel speeds over the duration of the manoeuvre, with additional equations derived from a rigid-body analysis [Citation27] of the wheelchair frame to accommodate for curvilinear motion. Propulsion cost is then found with a simple ratio between the supplied work (J) and the path length,
(m).
(2)
(2)
The yaw, or turning, displacement is measured in radians of angular heading direction change and was calculated using the relative velocities of the drive wheels and the geometric parameters of the wheelchair.
Data analysis
Data from the current-based motor torque sensors, motor encoders, and wheel-mounted encoders were collected at 40 Hz during the over-ground trials. These data were processed in MATLAB. Butterworth filters were used to smooth each sensor signal before calculating the input power to the system from each motor.
Coast-down data were assessed as a regression fit of the MWC velocity. The window of analysis was 0.95–0.35 m/s and resulted in a strong linear velocity response with R2 ≥0.98. Decelerations were derived from linear regressions of each coast-down velocity.
Analysis included assessment of differences in outcome variables across configurations and calculating the magnitude of differences. In a strict sense, configuring the same wheelchair with multiple components may not fully meet the assumption of independence required of ANOVA, but it does control for variance that might exist across frames as a confounder, and isolates the main factors. However, in deference to convention, ANOVA was run to assess the four configurations for each manoeuvre. An a priori decision was made to report all p-values and discuss results at the p ≤ 0.1 levels. Normality of the dependent measures were assessed using Kolmogorov-Smirnov analysis. Cost values were found to violate the assumption of normality during three of the manoeuvres: straight tile, slalom tile and slalom carpet. ANOVA was run using a Box-Cox transformation of this data.
The magnitude of differences across the four configurations are represented using effect size, as calculated using Cohen’s d [Citation28]. Effect size provides the most direct evaluation of differences with the ability to judge meaningfulness. Cohen suggested general guidelines that d = 0.2 be considered a “small” effect size, 0.5 represents a “medium” effect size and 0.8 a 'large' effect size. The reference for calculation was the wheelchair configured with its standard components of solid tires and 8"×1" casters.
Equivalence testing is a technique to assess instances when responses (in this case, performance) fall between a lower and an upper equivalence margin of clinically acceptable differences [Citation29]. Operationally, equivalence tests are a two-sided evaluation of differences using confidence intervals around an equivalence interval which represents the meaningful difference. A related one-way analysis, superiority testing, was deployed to assess whether performance of a test configuration exceed that of the reference by a meaningful amount-defined by the equivalence interval.
To define relevant or meaningful differences, published studies of human propulsion effort were reviewed to identify differences that were deemed non-significant in the respective analyses. A focus on non-significant differences was used to identify a judicious equivalence interval that reflected differences in propulsion effort obtained across manual wheelchair comparisons that did not result in a conclusion of a significant difference. Therefore, the defined equivalence interval would be realistic but also minimized within this study. A review of six studies using human subjects [Citation12,Citation30–34] found an average difference of 9.4% without statistical significance, so we defined the equivalence interval as = 5%, based upon an assumption that mechanical testing is more precise than human subject investigation.
Results
Coast-down
The deceleration values are shown in . On tile, the deceleration was reduced by 30% by replacing the casters, 20% by replacing the drive wheels, and nearly 50% by replacing both. On carpet, the difference was less drastic. The deceleration was reduced by about 6% with upgraded casters, 15% with upgraded drive wheels, and almost 20% with both replaced. Effect sizes are all very large and the p-values suggest significant differences for each configuration compared to the default “A” configuration.
Table 3. Coast-down deceleration values over tile and carpet.
Straight (tile)
Propulsion cost, distance, and kinetic energy values are shown in . As expected from the coast-down testing, the upgraded casters and drive wheels improved the over-ground travel behaviour – propulsion costs were reduced and distances were increased. Using both upgraded components had the greatest change over all outcome variables, by a large margin.
Table 4. Cost and distance during straight manoeuvre on tile.
From the ANOVA analysis (original output: F(3,36) = 99.81, p = 0.000; output with transformed data: F(3,36) = 103.82, p = 0.000), the propulsion costs between groups had statistically significant differences. Post-hoc analysis with Tukey’s test reported that the only non-significant difference was between the “B” and “C” configurations. Every other comparison was significant.
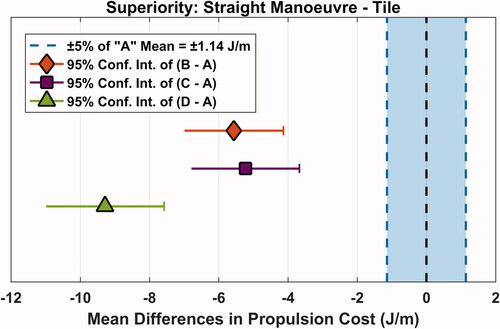
Superiority test results () show that all propulsion cost differences were below the 5% threshold of the “A” configuration mean propulsion cost. This indicates that, statistically, all upgraded configurations had lower propulsion costs.
Figure 5. Superiority test results for the Straight manoeuvre over tile.
Slalom (tile)
Outcome variables for the Slalom manoeuvre over tile, shown in , highlighted considerable improvements in the turning manoeuvrability of the chair with the upgraded components. Yaw displacement, measured in radians of angular heading direction change, was increased by nearly 500% between configurations “A” and “D” without any performance trade-offs. In general, configuration “D” had the lowest cost and travelled the farthest linear distance of all four configurations.
Table 5. Cost distance, and yaw displacement during the Slalom manoeuvre on tile.
From the ANOVA analysis (original output: F(3,76) = 386.32, p = 0.000; output with transformed data: F(3,76) = 836.27, p = 0.000), the propulsion costs between groups had statistically significant differences. As in the Straight (Tile) analysis, the Tukey’s test reported that the only non-significant difference was between the “B” and “C” configurations. Every other comparison was significant.
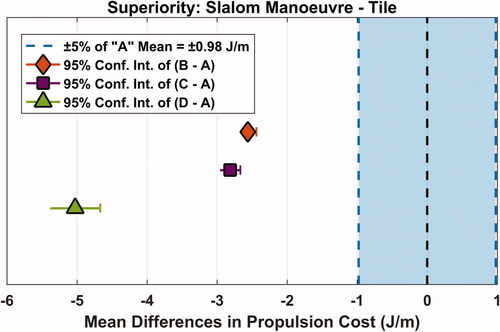
Superiority test results for the Slalom manoeuvre over tile () had the same general trends as the Straight results on tile, with tighter groupings. The “B”, “C”, and “D” configurations all statistically showed costs that were lower than the “A” configuration costs by more than 5%.
Figure 6. Superiority test results for the Slalom manoeuvre over tile.
Straight (carpet)
The results from the Straight manoeuvre over carpet are shown in . Carpeted flooring increased the propulsion cost for every configuration, as expected. Variability within each configuration data set increased as well. Effect sizes remained large to very large.
Table 6. Cost and distance during the Straight manoeuvre on carpet.
ANOVA analysis (original output: F(3,36) = 38.75, p = 0.000) indicated that the propulsion costs between groups had statistically significant differences. Post-hoc Tukey’s test reported that “A” and “B” configurations did not have significant differences. Every other comparison was significant.
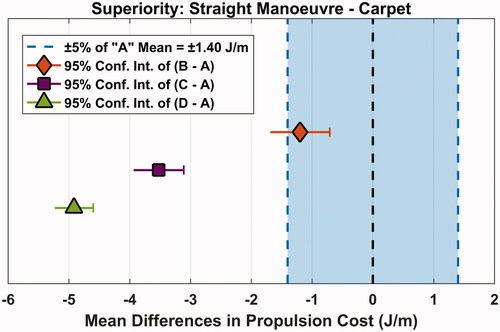
Superiority test results for the Straight manoeuvre over carpet () indicated that the propulsion cost of the “B” configuration was not statistically less than the cost of the “A” configuration by more than 5%, whereas the “C” and “D” configurations exhibited lower cost. Using upgraded casters did not reduce the propulsion cost enough to prove superiority on carpet, although a difference of over 1 J/m existed between the “A” and “B” configuration costs.
Figure 7. Superiority test results for the Straight manoeuvre over carpet.
Slalom (carpet)
Trials over carpet decelerated quickly and had difficulty turning with the alternating unilateral pushes. Therefore, the propulsion costs were high and the distances were fairly short, as seen in . High variability within groups caused reductions in the effect sizes compared to other tested manoeuvres.
Table 7. Cost, distance, and yaw displacement during the Slalom manoeuvre on carpet.
From the ANOVA analysis (original output: F(3,76) = 4.42, p = 0.006; output with transformed data had same values), the propulsion costs between groups had statistically significant differences. Interestingly, Tukey’s test results reported significant differences between the “B” configuration and both the “C” and “D” configurations. The up-charged casters improved the distance, yaw, and kinetic energy of the system, but only did so at the expense of increased propulsion cost. Adding the upgraded drive wheels reduced the propulsion cost and further increased the distance travelled.
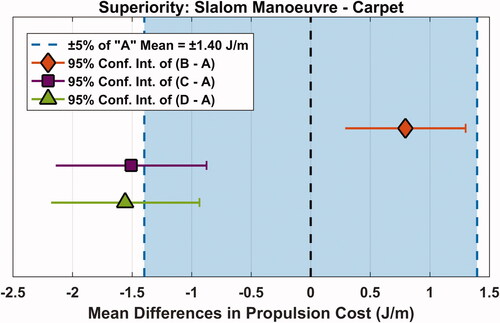
Superiority test results for the Slalom manoeuvre over carpet () showed that all of the configurations had tails of their 95% confidence intervals fall within the equivalence threshold (set at 5% of the mean propulsion cost of the “A” configuration). Therefore, they all had functionally-equivalent propulsion costs.
Figure 8. Superiority test results for the Slalom manoeuvre over carpet.
Discussion
Few studies have investigated the over-ground performance of lightweight wheelchairs, but only one study specifically investigated the high strength wheelchair category: Oliveira et al. compared high-strength lightweight (K0004) and ultra-lightweight (K0005) wheelchair performances by measuring the biomechanics of adolescent wheelchair users [Citation21]. In all reported metrics (push-rim forces, upper body kinematics, and a biomechanically-measured equivalent of propulsion cost), results showed that K0004 chairs need larger forces and travel at a slower natural pace than K0005 chairs, and they demand a higher propulsion cost over two of the three surfaces. Their study compared systems with different casters and weight distributions. As such, no clear inferences can be drawn about the influences of wheelchair configuration, but the authors highlighted axle position, which impacts both the weight distribution and the biomechanical relationship to the push rims.
The aim of this study was to evaluate the performance of a K0004 configured with different casters and drive wheels. Though K0004 chairs are expected to be used over extended periods of time, they are commonly only equipped with low-cost components from the manufacturers. Comparing the performance of standard casters and drive wheels to upgraded components offers insight into the influence of casters and tires on propulsion effort. Upgraded components were selected among commonly available options and informed by knowledge of the energy losses exhibited by each [Citation10].
Propulsion cost provides system-level performance that can be compared between configurations. It is uniquely structured as a metric of energy input versus the functional output (travel distance) of the MWC. The upgraded configurations clearly outperformed the default configuration in almost all manoeuvres. Propulsion costs were reduced by up to 41% by swapping both components. This difference was most noticeable in rectilinear motion over the linoleum tile surface, where all of the configurations had their best performances – tiled surfaces feature lower drag and scrub resistance than the carpet, and straight motion has the fewest sources of energy loss because there are no resistive scrub components in the system loss equations [15]. On tile, exchanging casters had more of an effect on cost than the drive wheel tires, but the opposite trend was reported on carpet. The smaller upgraded casters even raised the propulsion cost in the Slalom manoeuvre on carpet.
The other outcome variables (deceleration, distance, yaw) demonstrate similar observable changes in the system output. Deceleration values represent a “quick and simple” test method that reflects energy loss of a system, and in this study, its results aligned nicely with the Straight trajectory results – upgraded casters had a higher advantage than drive wheels over tile, whereas drive wheel tires were more advantageous over carpet. Upgraded casters reduced rolling resistance by nearly 30%, upgraded tires by 21%, and upgrading both casters and tires decreased rolling resistance by 49% over the tile surface. The carpet surface markedly increased deceleration for all configurations, but the drive wheels provided the most benefit (15% improvement) compared to casters (6% improvement).
The same trends are noticeable in the distance and yaw outcome variables, as well. Distance may be a more intuitive outcome because it reflects how much a person would travel in each configuration, given the exact same propulsion effort to each chair. Using the same 7 propulsive strokes, replacing either the casters or the drive wheel tires allowed the wheelchair to travel 2 m further. When replacing both, the chair travelled an additional 5 m. On carpet, the wheelchair with upgraded drive wheel tires also travelled 2.0 m further while the upgraded casters and tires travelled 2.6 m more. Manoeuvrability or the ease in changing directions as reflected by the while yaw displacement was also evident in all configurations on both surfaces. When propelling using 4 alternating left and right strokes over tile, replacing either the casters or drive wheel tires increased yaw by about 1.7 rad or 97° and replacing both increased yaw by 4.75 rads or 270°. The slalom manoeuvre on carpet demonstrated similar increases in manoeuvrability. Replacing the casters or tires nearly doubled yaw displacement and upgrading both components resulted in a 3× increase in yaw.
Differences in outcome variables between configurations are relatively large, despite little to no changes in the mass and weight distribution of the system. Rather, in this study, the tires themselves appear to be the primary cause for system-level performance differences. Manual wheelchair propulsion cost is highly correlated to the energy losses that are ever-present in the drive wheels and casters [Citation15,Citation17]. In brief summary, the main source of energy loss comes from the inelastic deformation of a tire under load as the tire rolls and scrubs against a surface. Generally, these energy losses are related to various factors such as tire type (solid versus pneumatic) [Citation11], tire hardness [Citation9,Citation11], radius [Citation9–11], cross-sectional profile [Citation9], and the load applied to the wheel [Citation9–11]. Wheel spoke design [Citation35] and bearing selection [Citation9] of the wheels are not as impactful. Within the current study, only the wheel load and tire type (non-pneumatic) were controlled. Thus, we can only speculate which other aspects of tire design were most impactful to the system-level performance. The drive wheels had the same diameter but differed in width, material properties (), and cross-sectional profiles (), with minimal low-profile tread patterns. Based upon the results, we can speculate that the Primo XPress tires are made from a better material with an advantageous profile to provide a better contact patch. For caster wheels, larger diameters generally have increased obstacle-climbing capabilities and tend to have lower rolling resistance, yet within this study, the smaller-diameter Primo casters provided superior performance. Similar to the drive wheels, we can speculate that the Primo material and cross-sectional profile combined to provide lower energy loss and, consequently, better system-level performance during the manoeuvres. For the purposes of this study, the alternative components were selected specifically due to their notable performances on tile and carpet surfaces as measured by bench-top test methods [Citation10]. Future work could further examine the impacts of tire design on energy losses using these bench-top procedures.
The provision of K0004 chairs have changed drastically over the past 15 years. Since 2006, payments by CMS for K0004 wheelchairs have decreased 96% [Citation36]. This decrease reflects both the impact of payments due to competitive bidding and a decrease in the number of chairs being provided.
This explanation is supported by the Fee Schedules for K0004 rentals in 2008 and 2018. Allowable monthly rental costs of K0004 wheelchairs in 2008 was about $134. Ten years later, monthly costs dropped to approximately $45. Capped rental items span up to 13 months, so using these monthly values and ignoring all the complexity of payments, a supplier stood to receive $1,740 for a K0004 in 2008, whereas in 2018, they would receive about $585. Indeed, cost reduction saves a beneficiary money, but a fuller evaluation of impact should consider “value”. In this context, “value” can be defined by performance divided by cost. History suggests that the configuration of K0004 chairs has changed and now few choices, if any, are offered in drive wheels and casters. Based upon the results of this study, performance of K0004 chairs with solid tires on mag wheels and 8"×1" casters adversely impacted performance, which adversely impacts the user.
This study permits assessment of value relative to alternative configurations of a K0004 wheelchair, specifically using better casters and drive wheel tires. To define value, we can use the cost differential between the standard components (8"×1" casters and solid pyramidal tires) and the upgraded components (6" Primo casters and Primo XPress tires). While costs to manufacturers cannot be readily determined, cost differential using retail prices can be used. We accessed 5 different on-line sellers of wheelchair components. While all sold the casters and solid tires, only one, enableyourlife.com, also sold the Primo XPress. Retail prices for the casters and tires evaluated in this study are shown in . Wholesale cost differentials may, in fact, be less.
Table 8. Component cost comparisons from online retailers.
If one considers the propulsion cost during a straight trajectory on tile, value of upgrading casters and drive wheels can be defined as
$19 for a 24% reduction in propulsion cost by getting better casters,
$14 for a 23% reduction in propulsion cost by getting better drive wheel tires, and
$33 for a 41% reduction in propulsion cost by getting better casters and tires.
If one considers both manoeuvres on both surfaces, upgrading both casters and drive wheels improve performance. If one must choose, replacing the drive wheel tires offers the most benefit, due to their increased performance over a carpeted surface.
If users were provided with this information, they would be empowered to evaluate cost versus benefit in terms of propulsion efficiency. The caveat, of course, is that a manufacture or supplier would offer these options. The alternative would be that a user would incur total cost () by purchasing upgraded components after already contributing to the purchase of lesser components that would be immediately replaced and discarded. This, of course, would be undesirable and would further penalize users for seeking better value in mobility. Policy must be better configured to allowing users to choose better value in their wheelchairs. Similarly, manufacturers and suppliers should offer options that provide better value as a means to meet the needs of their customers.
Limitations
This study measured the change in manual wheelchair performance across configurations with upgraded casters and tires. Many caster and tire options exist, so the changes reflected in this study may not apply to other components. Because they were selected, in part, by their rolling resistance and scrub performance, using similar parameters about other components will allow one to draw inferences about their impacts. Similarly, this study used a single K0004 wheelchair with a weight distribution of about 64% on its drive wheels. This appears to be a fairly typical weight distribution for K0004 wheelchairs, but results would possibly vary if the weight distributions were greater or lesser. The manoeuvres used in this study were representative of short bouts of mobility in straight and curvilinear trajectories. Indeed, there are an infinite number of potential manoeuvres that could be used, which might impact results. The manoeuvres defined in this study were meant to reflect typical speeds used in everyday mobility as a means to characterize the propulsion efficiencies of the mechanical systems.
Conclusion
This study provides a clear and objective comparison of the performances of a representative high-strength lightweight (K0004) wheelchair equipped with various common wheels and tires. The use of the wheelchair-propelling robot permitted precise measurements of propulsion costs across 4 configurations in 2 manoeuvres over tile and carpet surfaces, totalling 240 over-ground trials. The results of this study clearly demonstrate that manual wheelchair performance is inherently tied to the choice of components. Propulsion costs were reduced by up to 41% over linoleum tile and 18% over carpet by simply swapping the default drive wheels and casters with comparably-priced alternatives. Metrics of travel distance and yaw, representing the manoeuvrability of the wheelchair, increased favourably by up to 500% in certain cases. The alternative casters improved efficiency across tile surfaces. The alternative drive wheels improved efficiency across both tile and carpet surfaces. Evidently, the choice of components can influence several metrics of performance over high- and low-friction surfaces, as well as in manoeuvres featuring pure rolling (Straight) and turning (Slalom) trajectories. With careful consideration of the respective trade-offs of each component within the intended contexts of use, several metrics of performance (propulsion cost, distance, and yaw) can be optimized for an efficient and manoeuvrable wheelchair configuration. However, there is no “one-size-fits-all” configuration, as evidenced by the disparate 6"×1.5" caster performance between tile and carpet – some components may not work well on every surface. In addition to these findings, a metric of “value” has been proposed for the first time to represent performance as it relates to the retail cost of each component. This metric gives perspective on the affordability of attaining higher mechanical performances on a high-strength lightweight wheelchair. Knowledge of value can be highly beneficial to clinicians and users to customize the wheelchair for daily use, and can be especially useful to manufacturers as incentive to offer more configuration options in the fabrication phase, to prevent the user from relying on the retail component selections.
Disclosure statement
No potential conflict of interest was reported by the author(s).
Additional information
Funding
References
- van der Woude LH, de Groot G, Hollander AP, et al. Wheelchair ergonomics and physiological testing of prototypes. Ergonomics. 1986;29(12):1561–1573.
- van der Woude LH, Hendrich KM, Veeger HE, et al. Manual wheelchair propulsion: effects of power output on physiology and technique. Med Sci Sports Exerc. 1988;20(1):70–78.
- Boninger ML, Dicianno BE, Cooper RA, et al. Shoulder magnetic resonance imaging abnormalities, wheelchair propulsion, and gender. Arch Phys Med Rehabil. 2003;84(11):1615–1620.
- Brose SW, Boninger ML, Fullerton B, et al. Shoulder ultrasound abnormalities, physical examination findings, and pain in manual wheelchair users with spinal cord injury. Arch Phys Med Rehabil. 2008;89(11):2086–2093.
- Lin YS, Boninger M, Worobey L, et al. Effects of repetitive shoulder activity on the subacromial space in manual wheelchair users. Biomed Res Int. 2014;2014:1–9.
- Bascou J, Sauret C, Pillet H, et al. A method for the field assessment of rolling resistance properties of manual wheelchairs. Comput Methods Biomech Biomed Engin. 2013;16(4):381–391.
- Chan FHN, Eshraghi M, Alhazmi MA, et al. The effect of caster types on global rolling resistance in manual wheelchairs on indoor and outdoor surfaces. Assist Technol. 2018;30(4):176–182.
- Hoffman MD, Millet GY, Hoch AZ, et al. Assessment of wheelchair drag resistance using a coasting deceleration technique. Am J Phys Med Rehabil. 2003;82(11):880–889.
- Kauzlarich JJ, Thacker JG. Wheelchair tire rolling resistance and fatigue. J Rehabil Res Dev. 1985;22(3):25–41.
- Sprigle S, Huang M, Misch J. Measurement of rolling resistance and scrub torque of manual wheelchair drive wheels and casters. Assist Technol. 2019:1–13. DOI:10.1080/10400435.2019.1697907
- Sauret C, Bascou J, de Saint Remy N, et al. Assessment of field rolling resistance of manual wheelchairs. J Rehabil Res Dev. 2012;49(1):63–74.
- de Groot S, Vegter RJ, van der Woude LH. Effect of wheelchair mass, tire type and tire pressure on physical strain and wheelchair propulsion technique. Med Eng Phys. 2013;35(10):1476–1482.
- Kwarciak AM, Yarossi M, Ramanujam A, et al. Evaluation of wheelchair tire rolling resistance using dynamometer-based coast-down tests. J Rehabil Res Dev. 2009;46(7):931–938.
- Bascou J, Fallot C, Pillet H, et al. Assessment of power losses due to ground contact forces during usual manual wheelchair movements. Comput Methods Biomech Biomed Engin. 2017;20(sup1):7–8.
- Misch J, Huang M, Sprigle S. Modeling manual wheelchair propulsion cost during straight and curvilinear trajectories. PLOS One. 2020;15(6):e0234742.
- Sprigle S, Huang M. Impact of mass and weight distribution on manual wheelchair propulsion torque. Assist Technol. 2015;27(4):226–235.
- Sprigle S, Huang M. Manual wheelchair propulsion cost across different components and configurations during straight and turning maneuvers. J Rehabil Assist Technol Eng. 2020;7. DOI:10.1177/2055668320907819
- Parziale JR. Standard V lightweight wheelchair propulsion in spinal cord injured patients. Am J Phys Med Rehabil. 1991;70(2):76–80.
- Beekman CE, Miller-Porter L, Schoneberger M. Energy cost of propulsion in standard and ultralight wheelchairs in people with spinal cord injuries. Phys Ther. 1999;79(2):146–158.
- Oyster ML, Karmarkar AM, Patrick M, et al. Investigation of factors associated with manual wheelchair mobility in persons with spinal cord injury. Arch Phys Med Rehabil. 2011;92(3):484–490.
- Oliveira N, Blochlinger S, Ehrenberg N, et al. Kinematics and pushrim kinetics in adolescents propelling high-strength lightweight and ultra-lightweight manual wheelchairs. Disabil Rehabil Assist Technol. 2019;14(3):209–216.
- Bascou J, Pillet H, Kollia K, et al. Turning resistance of a manual wheelchair: a theoretical study. Comput Methods Biomech Biomed Engin. 2014;17(sup1):94–95.
- Chénier F, Bigras P, Aissaoui R, editors. A new dynamic model of the manual wheelchair for straight and curvilinear 2011 IEEE International Conference on Rehabilitation Robotics (ICORR); Zurich (Switzerland): IEEE; 2011.
- Lin J-T, Huang M, Sprigle S. Evaluation of wheelchair resistive forces during straight and turning trajectories across different wheelchair configurations using free-wheeling coast-down test. J Rehab Res Develop. 2015;52(7):1–22.
- Center for Medicare and Medicaid Services. Local Coverage Determination (LCD): Manual Wheelchair Bases (L33788). 2020. Available from: https://www.cms.gov/medicare-coverage-database/view/lcd.aspx?LCDId=33788&ContrId=389
- Liles H, Huang M, Caspall J, et al. Design of a robotic system to measure propulsion work of over-ground wheelchair maneuvers. IEEE Trans Neural Syst Rehabil Eng. 2015;23(6):983–991.
- Medola FO, Dao PV, Caspall JJ, et al. Partitioning kinetic energy during freewheeling wheelchair maneuvers. IEEE Trans Neural Syst Rehabil Eng. 2014;22(2):326–333.
- Cohen J. Statistical power analysis for the behavioral sciences. 2nd ed. Hillsdale, NJ: Lawrence Earlbaum Associates; 1988.
- Wellek S. Testing statistical hypotheses of equivalence and noninferiority. 2nd ed. Boca Raton: CRC Press; 2010.
- Hilbers PA, White TP. Effects of wheelchair design on metabolic and heart rate responses during propulsion by persons with paraplegia. Phys Ther. 1987;67(9):1355–1358.
- Lui J, MacGillivray MK, Sheel AW, et al. Mechanical efficiency of two commercial lever-propulsion mechanisms for manual wheelchair locomotion. J Rehabil Res Dev. 2013;50(10):1363–1372.
- Pavlidou E, Kloosterman MGM, Buurke JH, et al. Rolling resistance and propulsion efficiency of manual and power-assisted wheelchairs. Med Eng Phys. 2015;37(11):1105–1110.
- Sagawa Y, Jr., Watelain E, Lepoutre FX, et al. Effects of wheelchair mass on the physiologic responses, perception of exertion, and performance during various simulated daily tasks. Arch Phys Med Rehabil. 2010;91(8):1248–1254.
- Sawatzky BJ, Kim WO, Denison I. The ergonomics of different tyres and tyre pressure during wheelchair propulsion. Ergonomics. 2004;47(14):1475–1483.
- Hughes B, Sawatzky BJ, Hol AT. A comparison of spinergy versus standard steel-spoke wheelchair wheels. Arch Phys Med Rehabil. 2005;86(3):596–601.
- Center for Medicare and Medicaid Services. Part B National Summary Data File. Center for Medicare and Medicaid Services; 2020. Available from: https://www.cms.gov/Research-Statistics-Data-and-Systems/Downloadable-Public-Use-Files/Part-B-National-Summary-Data-File/Overview